Momentum Index [BigBeluga]The Momentum Index is an innovative indicator designed to measure the momentum of price action by analyzing the distribution of positive and negative momentum values over a defined period. By incorporating delta-based calculations and smoothing techniques, it provides traders with a clear and actionable representation of market momentum dynamics.
🔵 Key Features:
Delta-Based Momentum Analysis:
Calculates the momentum of price by comparing its current state to its value from a defined number of bars back.
Inside a loop, it evaluates whether momentum values are above or below zero, producing a delta value that reflects the net momentum direction and intensity.
Double EMA Smoothing:
Smooths the raw delta-based momentum values with a double EMA filter, reducing noise and providing a clearer trend signal.
tmi(len) =>
sum = 0.0
sum1 = 0.0
above = 0.0
below = 0.0
src_ = src - src
for i = 0 to len
sum := sum + (src_ > nz(src_ ) ? 1 : -1)
sum1 := sum1 + (sum > 0 ? 1 : -1)
sum1 := emaEma(sum1, 10)
for i = 1 to len
above := above + (sum1 > 0 ? 1 : 0)
below := below + (sum1 > 0 ? 0 : 1)
Directional Momentum Signals:
Generates momentum shift signals and displays them on both the oscillator and the main chart:
- △ Aqua Triangles: Represent upward momentum shifts.
- ▽ Red Triangles: Represent downward momentum shifts.
Dynamic Gradient Display:
Highlights momentum zones with gradient fills:
- Aqua shades for positive momentum (above zero).
- Red shades for negative momentum (below zero).
Dashboard Display:
A dashboard summarizing the count of momentum values above and below zero for the defined period (Sentiment Length e.g. 100), helping traders assess market sentiment at a glance.
🔵 How It Works:
The indicator takes price momentum as its source and evaluates the number of momentum values above and below zero within a defined period.
The delta calculation aggregates this information, providing a net representation of the prevailing market momentum.
A double EMA filter is applied to the delta values, smoothing the momentum line and enhancing signal clarity.
Momentum shifts are highlighted with visual signals on the oscillator and price chart, while the gradient display provides a visual representation of intensity.
🔵 Use Cases:
Momentum Tracking: Identify whether market momentum is predominantly bullish or bearish.
Signal Confirmation: Use chart-based signals to confirm potential trend reversals or continuation.
Analyze Market Strength: Leverage the dashboard to quickly assess the distribution of momentum over the chosen period.
Overbought/Oversold Conditions: Utilize gradient zones to detect areas of momentum extremes and possible price exhaustion.
Momentum Index offers a refined approach to analyzing momentum dynamics, combining delta-based calculations with smoothing techniques and intuitive visuals, making it an essential tool for traders looking to anticipate market movements effectively.
Cari skrip untuk "momentum"

Momentum Shift [Bigbeluga]
This indicator identifies momentum shifts using a smoothed momentum calculation. It plots dynamic shift zones consisting of five levels that expand or contract based on price action. When momentum rises, the indicator creates an upward shift zone, and when momentum falls, it generates a downward shift zone. The shift zones dynamically react to price, stopping extension when a level is crossed.
🔵Key Features:
Smoothed Momentum Calculation:
➣ Utilizes a Hull Moving Average (HMA) to smooth momentum and reduce noise.
➣ Identifies momentum shifts with crossovers between the current momentum value and its previous state.
➣ Uses a gradient color scheme to highlight momentum strength.
Dynamic Shift Zones:
➣ When momentum rises, the indicator plots an upper shift zone with five incremental levels.
➣ When momentum falls, a lower shift zone is formed with five descending levels.
➣ Each level within the shift zone represents a progressively stronger momentum shift.
Level Extension Control:
➣ Shift zones stop extending once a level is crossed by price.
➣ Levels closer to price act as key momentum resistance or support zones.
➣ If price retraces after a shift, the remaining levels stay intact for further reference.
Momentum Direction Indications:
➣ Labels (▲ and ▼) appear at momentum shift points to indicate rising or falling momentum.
🔵Usage:
Momentum-Based Entries: Identify momentum shifts early by using shift zones as confirmation for trade entries.
Trend Continuation & Exhaustion: Observe which shift levels price respects—if momentum shift zones hold, the trend may continue; if they break, momentum may reverse.
Dynamic Support & Resistance: Use the five-level shift zones as temporary support and resistance areas that adapt to momentum shifts.
Momentum Strength Analysis: If price moves through multiple shift levels in one direction, it signals strong momentum in that direction.
Momentum Shift is a powerful tool for traders looking to analyze momentum shifts with structured visual zones. By combining smoothed momentum calculations with dynamic shift zones, this indicator provides a clear view of market momentum and helps traders navigate price action effectively.

Momentum Percentage %A Percentage Momentum Indicator (oscillator) is a technical indicator which shows the trend direction and measures the pace of the price fluctuation by comparing current and past values. Normalized to be bounded to oscillate between 0 and 100 percent of recent price variation. As is, it average true range of an instrument can be easily compared to any other because of absolute percentage variation and not prices itselves.
The benefits of Percentage Momentum
It indicates volatility
It ideal to compare fluctuation and volatility between other assets
In assets that changes btw a large range of prices like crypto it's the best way to work with momentum.
It's the right way to work with algotrading.

Multi-timeframe MomentumThe Multi-timeframe momentum indicator is similar in concept to a velocity indicator like rate-of-change, but visualizes smoothed price changes by applying an EMA and linear regression to price difference at every bar. Momentums from 1 minute to 1 quarter are plotted on a single chart using the request.security function. Standard and Fibonacci timeframes are available as well as the ability to hide high-timeframes to keep the chart clean. Like any oscillator, divergence in the momentums can be used to identify price reversals in conjunction with support and resistance. When linear regression is applied, high and low inflection points are used to identify reversals in a manner similar to MACD.
Much love to DumpCap! The script is presented sans secret sauce.

Institutional Quantum Momentum Impulse [BullByte]## Overview
The Institutional Quantum Momentum Impulse (IQMI) is a sophisticated momentum oscillator designed to detect institutional-level trend strength, volatility conditions, and market regime shifts. It combines multiple advanced technical concepts, including:
- Quantum Momentum Engine (Hilbert Transform + MACD Divergence + Stochastic Energy)
- Fractal Volatility Scoring (GARCH + Keltner-based volatility)
- Dynamic Adaptive Bands (Self-adjusting thresholds based on efficiency)
- Market Phase Detection (Volume + Momentum alignment)
- Liquidity & Cumulative Delta Analysis
The indicator provides a Z-score normalized momentum reading, making it ideal for mean-reversion and trend-following strategies.
---
## Key Features
### 1. Quantum Momentum Core
- Combines Hilbert Transform, MACD divergence, and Stochastic Energy into a single composite momentum score.
- Normalized using a Z-score for statistical significance.
- Smoothed with EMA/WMA/HMA for cleaner signals.
### 2. Dynamic Adaptive Bands
- Upper/Lower bands adjust based on volatility and efficiency ratio .
- Acts as overbought/oversold zones when momentum reaches extremes.
### 3. Market Phase Detection
- Identifies bullish , bearish , or neutral phases using:
- Volume-Weighted MA alignment
- Fractal momentum extremes
### 4. Volatility & Liquidity Filters
- Fractal Volatility Score (0-100 scale) shows market instability.
- Liquidity Check ensures trades are taken in favorable spread conditions.
### 5. Dashboard & Visuals
- Real-time dashboard with key metrics:
- Momentum strength, volatility, efficiency, cumulative delta, and market regime.
- Gradient coloring for intuitive momentum visualization .
---
## Best Trade Setups
### 1. Trend-Following Entries
- Signal :
- QM crosses above zero + Market Phase = Bullish + ADX > 25
- Cumulative Delta rising (buying pressure)
- Confirmation :
- Efficiency > 0.5 (strong momentum quality)
- Liquidity = High (tight spreads)
### 2. Mean-Reversion Entries
- Signal :
- QM touches upper band + Volatility expanding
- Market Regime = Ranging (ADX < 25)
- Confirmation :
- Efficiency < 0.3 (weak momentum follow-through)
- Cumulative Delta divergence (price high but delta declining)
### 3. Breakout Confirmation
- Signal :
- QM holds above zero after a pullback
- Market Phase shifts to Bullish/Bearish
- Confirmation :
- Volatility rising (expansion phase)
- Liquidity remains high
---
## Recommended Timeframes
- Intraday (5M - 1H): Works well for scalping & swing trades.
- Swing Trading (4H - Daily): Best for trend-following setups.
- Position Trading (Weekly+): Useful for macro trend confirmation.
---
## Input Customization
- Resonance Factor (1.0 - 3.618 ): Adjusts MACD divergence sensitivity.
- Entropy Filter (0.382/0.50/0.618) : Controls stochastic damping.
- Smoothing Type (EMA/WMA/HMA) : Changes momentum responsiveness.
- Normalization Period : Adjusts Z-score lookback.
---
The IQMI is a professional-grade momentum indicator that combines institutional-level concepts into a single, easy-to-read oscillator. It works across all markets (stocks, forex, crypto) and is ideal for traders who want:
✅ Early trend detection
✅ Volatility-adjusted signals
✅ Institutional liquidity insights
✅ Clear dashboard for quick analysis
Try it on TradingView and enhance your trading edge! 🚀
Happy Trading!
- BullByte

Accelerating Dual Momentum ScoreThis is a score metric used by the Accelerating Dual Momentum strategy.
According to the website you referenced when you created, the strategy is as follows:
Strategy Rules
This strategy allocates 100% of of the portfolio to one asset each month.
1. On the last trading day of each month, calculate the “momentum score” for the S&P 500 ( SPY ) and the international small cap equities (SCZ). The momentum score is the average of the 1, 3, and 6-month total return for each asset.
2. If the momentum score of SCZ > SPY and is greater than 0, invest in SCZ.
3. If the momentum score of SPY > SCZ and is greater than 0, invest in SPY .
4. If neither momentum score is greater than 0, calculate the 1-month total return for long-term US Treasuries ( TLT ) and US TIPS (TIP). Invest in whichever has the higher return.
Source: portfoliodb.co

Momentum Structural AnalysisMomentum Structural Analysis (MSA‑style Oscillator)
This indicator implements a simple, MSA‑style momentum oscillator that measures how far price has moved above or below its own long‑term trend on the active timeframe, expressed in percentage terms. Instead of looking at raw price, it "oscillates" price around a timeframe‑appropriate simple moving average (SMA) and plots the percentage distance from that SMA as an orange line around a zero baseline. Zero means price is exactly at its structural trend; positive values mean price is extended above trend; negative values mean it is trading below trend.
The script automatically selects the SMA length based on the chart timeframe:
On daily charts it uses the configurable Daily SMA Length (default 252 trading days, roughly 1 year).
On weekly charts it uses Weekly SMA Length (default 208 weeks).
On monthly charts it uses Monthly SMA Length (default 120 months).
This approach is inspired by the ideas behind Momentum Structural Analysis (MSA), which studies where a market trades relative to long‑term moving averages and then treats the momentum line (the oscillator) as the primary object of analysis. The goal is to highlight structural overbought/oversold conditions and regime changes that are often clearer on momentum than on the raw price chart.
--------------------------------------------------
What the script computes and how it works
For each bar, the indicator:
Chooses an SMA length based on the current timeframe (daily/weekly/monthly).
Calculates the SMA of the close.
Computes the percentage distance:
\text{Diff %} = \frac{\text{Close} - \text{SMA}}{\text{SMA}} \times 100
Plots this Diff % as an orange line, with a dashed horizontal zero line as the base.
This produces a momentum oscillator that oscillates around zero and reflects the "structural" position of price versus its own long‑term mean.
--------------------------------------------------
How to use it on index charts (e.g., NIFTY50)
On indices like NIFTY50, use the indicator to see how stretched the index is versus its structural trend.
Typical uses:
Identify extremes: a). Historically high positive readings can signal euphoric, late‑stage conditions where risk is elevated. b). Deep negative readings can highlight panic/capitulation zones where downside may be exhausted.
Draw structural levels: a). Mark horizontal bands on the oscillator where past turns have occurred (e.g., +15%, −10%, etc. specific to NIFTY50). b). Watch how price behaves when the oscillator revisits these zones: repeated rejections can validate them as structural bounds; clean breaks can indicate a change of regime.
This is not a buy/sell signal generator by itself; it is a framework to understand where the index sits within its long‑term momentum structure and to support risk‑management decisions.
--------------------------------------------------
How to use it on ratio charts
Apply the same indicator to ratio symbols such as NIFTY50/GOLD, BANKNIFTY/NIFTY50, sector vs index, or any spread you plot as a ratio.
On a ratio chart:
The oscillator now measures relative momentum: how far that ratio is above or below its own long‑term mean.
High positive readings = strong outperformance of the numerator vs the denominator (e.g., equities strongly outperforming gold).
Deep negative readings = strong underperformance (e.g., equities structurally lagging gold).
This is very much in the spirit of MSA’s work on spreads between asset classes: it helps visualize major rotations (equities → gold, financials → commodities, etc.) and whether a relative‑performance trend is stretched, reverting, or breaking into a new phase.
--------------------------------------------------
Using multiple timeframes for better decisions
You can stack information across timeframes to get a more robust view:
Monthly : a). Use monthly charts to see secular/structural phases. b). Long multi‑year stretches above or below zero, and large bases or trendline breaks on the monthly oscillator, can mark major bull or bear cycles and big rotations between asset classes.
Weekly : a). Use weekly charts for the primary trend. b). Weekly structures (multi‑month highs/lows, channels, or trendlines on the oscillator) are useful for medium‑term positioning and for confirming or rejecting signals seen on the monthly view.
Daily : a). Use daily charts mainly for timing entries/exits once the higher‑timeframe direction is clear. b). Short‑term extremes on the daily oscillator that align with the larger weekly/monthly structure can offer better‑timed opportunities, while signals that contradict higher‑timeframe momentum are more likely to be noise.
--------------------------------------------------

ML - Momentum Index (Pivots)Building upon the innovative foundations laid by Zeiierman's Machine Learning Momentum Index (MLMI), this variation introduces a series of refinements and new features aimed at bolstering the model's predictive accuracy and responsiveness. Licensed under the Creative Commons Attribution-NonCommercial-ShareAlike 4.0 International License (CC BY-NC-SA 4.0), my adaptation seeks to enhance the original by offering a more nuanced approach to momentum-based trading.
Key Features :
Pivot-Based Analysis: Shifting focus from trend crosses to pivot points, this version employs pivot bars to offer a distinct perspective on market momentum, aiding in the identification of critical reversal points.
Extended Parameter Set: By integrating additional parameters for making predictions, the model gains improved adaptability, allowing for finer tuning to match market conditions.
Dataset Size Limitation: To ensure efficiency and mitigate the risk of calculation timeouts, a cap on the dataset size has been implemented, balancing between comprehensive historical analysis and computational agility.
Enhanced Price Source Flexibility: Users can select between closing prices or (suggested) OHLC4 as the basis for calculations, tailoring the indicator to different analysis preferences and strategies.
This adaptation not only inherits the robust framework of the original MLMI but also introduces innovations to enhance its utility in diverse trading scenarios. Whether you're looking to refine your short-term trading tactics or seeking stable indicators for long-term strategies, the ML - Momentum Index (Pivots) offers a versatile tool to navigate the complexities of the market.
For a deeper understanding of the modifications and to leverage the full potential of this indicator, users are encouraged to explore the tooltips and documentation provided within the script.
The Momentum Indicator calculations have been transitioned to the MLMomentumIndex library, simplifying the process of integration. Users can now seamlessly incorporate the momentumIndexPivots function into their scripts to conduct detailed momentum analysis with ease.

Risk-Adjusted Momentum Oscillator# Risk-Adjusted Momentum Oscillator (RAMO): Momentum Analysis with Integrated Risk Assessment
## 1. Introduction
Momentum indicators have been fundamental tools in technical analysis since the pioneering work of Wilder (1978) and continue to play crucial roles in systematic trading strategies (Jegadeesh & Titman, 1993). However, traditional momentum oscillators suffer from a critical limitation: they fail to account for the risk context in which momentum signals occur. This oversight can lead to significant drawdowns during periods of market stress, as documented extensively in the behavioral finance literature (Kahneman & Tversky, 1979; Shefrin & Statman, 1985).
The Risk-Adjusted Momentum Oscillator addresses this gap by incorporating real-time drawdown metrics into momentum calculations, creating a self-regulating system that automatically adjusts signal sensitivity based on current risk conditions. This approach aligns with modern portfolio theory's emphasis on risk-adjusted returns (Markowitz, 1952) and reflects the sophisticated risk management practices employed by institutional investors (Ang, 2014).
## 2. Theoretical Foundation
### 2.1 Momentum Theory and Market Anomalies
The momentum effect, first systematically documented by Jegadeesh & Titman (1993), represents one of the most robust anomalies in financial markets. Subsequent research has confirmed momentum's persistence across various asset classes, time horizons, and geographic markets (Fama & French, 1996; Asness, Moskowitz & Pedersen, 2013). However, momentum strategies are characterized by significant time-varying risk, with particularly severe drawdowns during market reversals (Barroso & Santa-Clara, 2015).
### 2.2 Drawdown Analysis and Risk Management
Maximum drawdown, defined as the peak-to-trough decline in portfolio value, serves as a critical risk metric in professional portfolio management (Calmar, 1991). Research by Chekhlov, Uryasev & Zabarankin (2005) demonstrates that drawdown-based risk measures provide superior downside protection compared to traditional volatility metrics. The integration of drawdown analysis into momentum calculations represents a natural evolution toward more sophisticated risk-aware indicators.
### 2.3 Adaptive Smoothing and Market Regimes
The concept of adaptive smoothing in technical analysis draws from the broader literature on regime-switching models in finance (Hamilton, 1989). Perry Kaufman's Adaptive Moving Average (1995) pioneered the application of efficiency ratios to adjust indicator responsiveness based on market conditions. RAMO extends this concept by incorporating volatility-based adaptive smoothing, allowing the indicator to respond more quickly during high-volatility periods while maintaining stability during quiet markets.
## 3. Methodology
### 3.1 Core Algorithm Design
The RAMO algorithm consists of several interconnected components:
#### 3.1.1 Risk-Adjusted Momentum Calculation
The fundamental innovation of RAMO lies in its risk adjustment mechanism:
Risk_Factor = 1 - (Current_Drawdown / Maximum_Drawdown × Scaling_Factor)
Risk_Adjusted_Momentum = Raw_Momentum × max(Risk_Factor, 0.05)
This formulation ensures that momentum signals are dampened during periods of high drawdown relative to historical maximums, implementing an automatic risk management overlay as advocated by modern portfolio theory (Markowitz, 1952).
#### 3.1.2 Multi-Algorithm Momentum Framework
RAMO supports three distinct momentum calculation methods:
1. Rate of Change: Traditional percentage-based momentum (Pring, 2002)
2. Price Momentum: Absolute price differences
3. Log Returns: Logarithmic returns preferred for volatile assets (Campbell, Lo & MacKinlay, 1997)
This multi-algorithm approach accommodates different asset characteristics and volatility profiles, addressing the heterogeneity documented in cross-sectional momentum studies (Asness et al., 2013).
### 3.2 Leading Indicator Components
#### 3.2.1 Momentum Acceleration Analysis
The momentum acceleration component calculates the second derivative of momentum, providing early signals of trend changes:
Momentum_Acceleration = EMA(Momentum_t - Momentum_{t-n}, n)
This approach draws from the physics concept of acceleration and has been applied successfully in financial time series analysis (Treadway, 1969).
#### 3.2.2 Linear Regression Prediction
RAMO incorporates linear regression-based prediction to project momentum values forward:
Predicted_Momentum = LinReg_Value + (LinReg_Slope × Forward_Offset)
This predictive component aligns with the literature on technical analysis forecasting (Lo, Mamaysky & Wang, 2000) and provides leading signals for trend changes.
#### 3.2.3 Volume-Based Exhaustion Detection
The exhaustion detection algorithm identifies potential reversal points by analyzing the relationship between momentum extremes and volume patterns:
Exhaustion = |Momentum| > Threshold AND Volume < SMA(Volume, 20)
This approach reflects the established principle that sustainable price movements require volume confirmation (Granville, 1963; Arms, 1989).
### 3.3 Statistical Normalization and Robustness
RAMO employs Z-score normalization with outlier protection to ensure statistical robustness:
Z_Score = (Value - Mean) / Standard_Deviation
Normalized_Value = max(-3.5, min(3.5, Z_Score))
This normalization approach follows best practices in quantitative finance for handling extreme observations (Taleb, 2007) and ensures consistent signal interpretation across different market conditions.
### 3.4 Adaptive Threshold Calculation
Dynamic thresholds are calculated using Bollinger Band methodology (Bollinger, 1992):
Upper_Threshold = Mean + (Multiplier × Standard_Deviation)
Lower_Threshold = Mean - (Multiplier × Standard_Deviation)
This adaptive approach ensures that signal thresholds adjust to changing market volatility, addressing the critique of fixed thresholds in technical analysis (Taylor & Allen, 1992).
## 4. Implementation Details
### 4.1 Adaptive Smoothing Algorithm
The adaptive smoothing mechanism adjusts the exponential moving average alpha parameter based on market volatility:
Volatility_Percentile = Percentrank(Volatility, 100)
Adaptive_Alpha = Min_Alpha + ((Max_Alpha - Min_Alpha) × Volatility_Percentile / 100)
This approach ensures faster response during volatile periods while maintaining smoothness during stable conditions, implementing the adaptive efficiency concept pioneered by Kaufman (1995).
### 4.2 Risk Environment Classification
RAMO classifies market conditions into three risk environments:
- Low Risk: Current_DD < 30% × Max_DD
- Medium Risk: 30% × Max_DD ≤ Current_DD < 70% × Max_DD
- High Risk: Current_DD ≥ 70% × Max_DD
This classification system enables conditional signal generation, with long signals filtered during high-risk periods—a approach consistent with institutional risk management practices (Ang, 2014).
## 5. Signal Generation and Interpretation
### 5.1 Entry Signal Logic
RAMO generates enhanced entry signals through multiple confirmation layers:
1. Primary Signal: Crossover between indicator and signal line
2. Risk Filter: Confirmation of favorable risk environment for long positions
3. Leading Component: Early warning signals via acceleration analysis
4. Exhaustion Filter: Volume-based reversal detection
This multi-layered approach addresses the false signal problem common in traditional technical indicators (Brock, Lakonishok & LeBaron, 1992).
### 5.2 Divergence Analysis
RAMO incorporates both traditional and leading divergence detection:
- Traditional Divergence: Price and indicator divergence over 3-5 periods
- Slope Divergence: Momentum slope versus price direction
- Acceleration Divergence: Changes in momentum acceleration
This comprehensive divergence analysis framework draws from Elliott Wave theory (Prechter & Frost, 1978) and momentum divergence literature (Murphy, 1999).
## 6. Empirical Advantages and Applications
### 6.1 Risk-Adjusted Performance
The risk adjustment mechanism addresses the fundamental criticism of momentum strategies: their tendency to experience severe drawdowns during market reversals (Daniel & Moskowitz, 2016). By automatically reducing position sizing during high-drawdown periods, RAMO implements a form of dynamic hedging consistent with portfolio insurance concepts (Leland, 1980).
### 6.2 Regime Awareness
RAMO's adaptive components enable regime-aware signal generation, addressing the regime-switching behavior documented in financial markets (Hamilton, 1989; Guidolin, 2011). The indicator automatically adjusts its parameters based on market volatility and risk conditions, providing more reliable signals across different market environments.
### 6.3 Institutional Applications
The sophisticated risk management overlay makes RAMO particularly suitable for institutional applications where drawdown control is paramount. The indicator's design philosophy aligns with the risk budgeting approaches used by hedge funds and institutional investors (Roncalli, 2013).
## 7. Limitations and Future Research
### 7.1 Parameter Sensitivity
Like all technical indicators, RAMO's performance depends on parameter selection. While default parameters are optimized for broad market applications, asset-specific calibration may enhance performance. Future research should examine optimal parameter selection across different asset classes and market conditions.
### 7.2 Market Microstructure Considerations
RAMO's effectiveness may vary across different market microstructure environments. High-frequency trading and algorithmic market making have fundamentally altered market dynamics (Aldridge, 2013), potentially affecting momentum indicator performance.
### 7.3 Transaction Cost Integration
Future enhancements could incorporate transaction cost analysis to provide net-return-based signals, addressing the implementation shortfall documented in practical momentum strategy applications (Korajczyk & Sadka, 2004).
## References
Aldridge, I. (2013). *High-Frequency Trading: A Practical Guide to Algorithmic Strategies and Trading Systems*. 2nd ed. Hoboken, NJ: John Wiley & Sons.
Ang, A. (2014). *Asset Management: A Systematic Approach to Factor Investing*. New York: Oxford University Press.
Arms, R. W. (1989). *The Arms Index (TRIN): An Introduction to the Volume Analysis of Stock and Bond Markets*. Homewood, IL: Dow Jones-Irwin.
Asness, C. S., Moskowitz, T. J., & Pedersen, L. H. (2013). Value and momentum everywhere. *Journal of Finance*, 68(3), 929-985.
Barroso, P., & Santa-Clara, P. (2015). Momentum has its moments. *Journal of Financial Economics*, 116(1), 111-120.
Bollinger, J. (1992). *Bollinger on Bollinger Bands*. New York: McGraw-Hill.
Brock, W., Lakonishok, J., & LeBaron, B. (1992). Simple technical trading rules and the stochastic properties of stock returns. *Journal of Finance*, 47(5), 1731-1764.
Calmar, T. (1991). The Calmar ratio: A smoother tool. *Futures*, 20(1), 40.
Campbell, J. Y., Lo, A. W., & MacKinlay, A. C. (1997). *The Econometrics of Financial Markets*. Princeton, NJ: Princeton University Press.
Chekhlov, A., Uryasev, S., & Zabarankin, M. (2005). Drawdown measure in portfolio optimization. *International Journal of Theoretical and Applied Finance*, 8(1), 13-58.
Daniel, K., & Moskowitz, T. J. (2016). Momentum crashes. *Journal of Financial Economics*, 122(2), 221-247.
Fama, E. F., & French, K. R. (1996). Multifactor explanations of asset pricing anomalies. *Journal of Finance*, 51(1), 55-84.
Granville, J. E. (1963). *Granville's New Key to Stock Market Profits*. Englewood Cliffs, NJ: Prentice-Hall.
Guidolin, M. (2011). Markov switching models in empirical finance. In D. N. Drukker (Ed.), *Missing Data Methods: Time-Series Methods and Applications* (pp. 1-86). Bingley: Emerald Group Publishing.
Hamilton, J. D. (1989). A new approach to the economic analysis of nonstationary time series and the business cycle. *Econometrica*, 57(2), 357-384.
Jegadeesh, N., & Titman, S. (1993). Returns to buying winners and selling losers: Implications for stock market efficiency. *Journal of Finance*, 48(1), 65-91.
Kahneman, D., & Tversky, A. (1979). Prospect theory: An analysis of decision under risk. *Econometrica*, 47(2), 263-291.
Kaufman, P. J. (1995). *Smarter Trading: Improving Performance in Changing Markets*. New York: McGraw-Hill.
Korajczyk, R. A., & Sadka, R. (2004). Are momentum profits robust to trading costs? *Journal of Finance*, 59(3), 1039-1082.
Leland, H. E. (1980). Who should buy portfolio insurance? *Journal of Finance*, 35(2), 581-594.
Lo, A. W., Mamaysky, H., & Wang, J. (2000). Foundations of technical analysis: Computational algorithms, statistical inference, and empirical implementation. *Journal of Finance*, 55(4), 1705-1765.
Markowitz, H. (1952). Portfolio selection. *Journal of Finance*, 7(1), 77-91.
Murphy, J. J. (1999). *Technical Analysis of the Financial Markets: A Comprehensive Guide to Trading Methods and Applications*. New York: New York Institute of Finance.
Prechter, R. R., & Frost, A. J. (1978). *Elliott Wave Principle: Key to Market Behavior*. Gainesville, GA: New Classics Library.
Pring, M. J. (2002). *Technical Analysis Explained: The Successful Investor's Guide to Spotting Investment Trends and Turning Points*. 4th ed. New York: McGraw-Hill.
Roncalli, T. (2013). *Introduction to Risk Parity and Budgeting*. Boca Raton, FL: CRC Press.
Shefrin, H., & Statman, M. (1985). The disposition to sell winners too early and ride losers too long: Theory and evidence. *Journal of Finance*, 40(3), 777-790.
Taleb, N. N. (2007). *The Black Swan: The Impact of the Highly Improbable*. New York: Random House.
Taylor, M. P., & Allen, H. (1992). The use of technical analysis in the foreign exchange market. *Journal of International Money and Finance*, 11(3), 304-314.
Treadway, A. B. (1969). On rational entrepreneurial behavior and the demand for investment. *Review of Economic Studies*, 36(2), 227-239.
Wilder, J. W. (1978). *New Concepts in Technical Trading Systems*. Greensboro, NC: Trend Research.

Momentum ChannelbandsThe "Momentum Channelbands" is indicator that measures and displays an asset's momentum. It includes options to calculate Bollinger Bands and Donchian Channels around the momentum. Users can customize settings for a comprehensive view of momentum-related insights. This tool helps assess trend strength, identify overbought/oversold conditions, and pinpoint highs/lows. It should be used alongside other indicators due to potential lag and false signals.

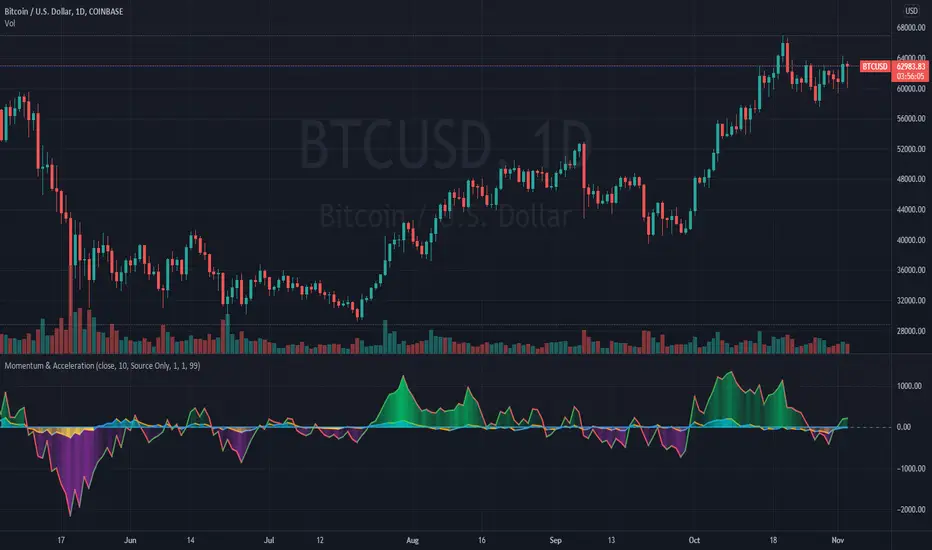
Momentum and AccelerationThe following oscillator is a twist on momentum, incorporating a 2nd derivative "acceleration" to help determine changes in momentum. Both are plotted directly accessing previous series values rather than using a moving average.
The script has an option to divide so the formula is d(Price)/d(Time), like a derivative. The script also provides options for the user to use their price source, volume, or a combination of price and volume.
Credit: This script utilizes the "color gradient framework" tutorial by LucF (PineCoders) to create user-adjustable gradient visuals.
Definitions
"1st Derivative - Momentum" - Momentum is most commonly referred to as a rate and measures the acceleration of the price and/or volume of a security.
"2nd Derivative - Acceleration" - Acceleration is the rate of change of momentum.
Value Added
This script may help the trader to assess directional changes in momentum easier.
This script also plots using previous series values rather than using a moving average function. To my knowledge, I was unable to find one that does this for "2nd derivative", so it had to be created.
Momentum Candle V2 by Sekolah Trading📌 Momentum Candle V2 by Sekolah Trading – Pair-Based Volatility & Wick Ratio Filter
This script provides a structured and adaptive approach to detecting high-probability momentum candles in intraday markets. It dynamically adjusts pip thresholds and wick filtering conditions based on the selected symbol and timeframe, making it highly practical for real-time trading.
🔍 Concept and Originality
Momentum Candle V2 by Sekolah Trading implements a custom-built methodology combining:
Dynamic Pip Calibration
For each supported instrument (e.g., XAUUSD, USDJPY, GBPUSD, AUDUSD, EURUSD, BTCUSD), the user can define a pip threshold that determines the minimum valid body size for momentum candles. These thresholds are tailored for each pair and timeframe (M5, M15, H1), ensuring the logic adjusts to different volatility profiles.
Wick-to-Body Ratio Filtering
The script filters out candles with large wicks by requiring that total wick length (upper + lower) be no more than 30% of the full candle range. This helps identify decisive candles with minimal rejection.
Directional Validation
Bullish momentum is defined as: Close > Open with a shorter upper wick.
Bearish momentum is: Close < Open with a shorter lower wick.
Real-Time Timing Filter
Alerts are only triggered when the current candle is between 20 and 90 seconds from closing, which reduces noise and encourages confirmation-based entry.
Non-Repainting Logic
All calculations run in real-time with confirmed candles only — no lookahead or future leak.
📊 Visual Output – How to Read the Chart
When the conditions above are met, the script displays triangle markers on the chart:
🔺 Red downward triangle above the candle: valid bearish momentum signal
🔻 Blue upward triangle below the candle: valid bullish momentum signal
These shapes appear on live bars during the final moments of the candle to alert traders to potential confirmed momentum.
🔔 Alert Conditions
Two alert types are provided:
Momentum Bullish: Large bullish candle with small upper wick, during last 20–90s of bar
Momentum Bearish: Large bearish candle with small lower wick, same timing window
Alerts are designed for precision entries at candle close.
🧭 How to Use
Apply the script to a 5m, 15m, or 1h chart.
Configure pip thresholds for your preferred pairs from the input settings.
Watch for triangle markers near the close of each candle:
Blue = potential bullish momentum
Red = potential bearish momentum
Set alerts:
Go to Alerts → Select Momentum Bullish or Momentum Bearish
Frequency: Once Per Bar
Customize message: e.g. “Momentum Bullish on XAUUSD M15”
Combine signals with:
EMA, S/R, or trend filters
Volume/Order Flow
Liquidity zone or breakout context
🛡️ Why This Script Is Closed-Source
This script uses proprietary logic developed by Sekolah Trading, including:
Custom pip calibration engine
Adaptive wick filtering
Real-time entry validation with triangle plots
While the code is protected, the methodology has been explained transparently here in accordance with TradingView publishing rules.
⚠️ Disclaimer
This script is provided for educational and technical analysis purposes only.
It does not guarantee results or provide financial advice. Always verify trades with your own strategy and risk controls.
Author: Sekolah Trading
Version: Momentum Candle V2
Built with Pine Script v6

Dynamic Volume-Volatility Adjusted MomentumThis Indicator in a refinement of my earlier script PC*VC Moving average Old with easier to follow color codes, overbought and oversold zones. This script has converted the previous script into a standardized measure by converting it into Z-scores and also incorporated a volatility based dynamic length option. Below is a detailed Explanation.
The "Dynamic Volume-Volatility Adjusted Momentum" or "Nasan Momentum Oscillator" is designed to capture market momentum while accounting for volume and volatility fluctuations. It leverages the Typical Price (TP), calculated as the average of high, low, and close prices, and introduces the Price Coefficient (PC) based on deviations from the simple moving average (SMA) across various time frames. Additionally, the Volume Coefficient (VC) compares current volume to SMA, and calculates Intraday Volatility (IDV) which gauges the daily price range relative to the close. Then intraday volatility ratio is calculated ( IDV Ratio) as the ratio of current Intraday Volatility (IDV) to the average of IDV for three different length periods, which provides a relative measure of current intraday volatility compared to its recent historical average. An inter-day ATR based Relative Volatility (RV) is calculated to adjusts for changing market volatility based on which the dynamic length adjustment adapts the moving average (standard length is 14). The PC *VC/IDV Ratio integrates price, volume, and volatility information which provides a volume and volatility adjusted momentum. This volume and volatility adjusted momentum is converted into a standardized Z-Score. The Z-Score measures deviations from the mean. Color-coded plots visually represent momentum, and thresholds aid in identifying overbought or oversold conditions.
The indicator incorporates a nuanced approach to emphasize the joint impact of price and volume while considering the stabilizing effect of lower intraday volatility. Placing the volume ratio (VC) in the numerator means that higher volume positively contributes to the overall ratio, aligning with the observation that increased volumes often accompany robust price movements. Simultaneously, the decision to include the inverse of intraday volatility (1/IDV) in the denominator acts as a dampener, reducing the impact of extreme intraday volatility on the momentum indicator. This design choice aims to filter out noise, giving more weight to significant price changes supported by substantial trading activity. In essence, the indicator's design seeks to provide a more robust momentum measure that balances the influence of price, volume, and volatility in the analysis of market dynamics.
Composite Momentum IndicatorComposite Momentum Indicator" combines the signals from several oscillators, including Stochastic, RSI, Ultimate Oscillator, and Commodity Channel Index (CCI) by averaging the standardized values (Z-Scores). Since it is a Z-Score based indicators the values will be typically be bound between +3 and -3 oscillating around 0. Here's a summary of the code:
Input Parameters: Users can customize the look-back period and set threshold values for overbought and oversold conditions. They can also choose which oscillators to include in the composite calculation.
Oscillator Calculations: The code calculates four separate oscillators - Stochastic, RSI, Ultimate Oscillator, and CCI - each measuring different aspects of market momentum.
Z-Scores Calculation: For each oscillator, the code calculates a Z-Score, which normalizes the oscillator's values based on its historical standard deviation and mean. This allows for a consistent comparison of oscillator values across different timeframes.
Composite Z-Score: The code aggregates the Z-Scores from the selected oscillators, taking into account user preferences (whether to include each oscillator). It then calculates an average Z-Score to create the "Composite Momentum Oscillator."
Conditional Color Coding: The composite oscillator is color-coded based on its average Z-Score value. It turns green when it's above the overbought threshold, red when it's below the oversold threshold, and blue when it's within the specified range.
Horizontal Lines: The code plots horizontal lines at key levels, including 0, ±3, ±2, and ±1, to help users identify important momentum levels.
Gradient Fills: It adds gradient fills above the overbought threshold and below the oversold threshold to visually highlight extreme momentum conditions.
Combining the Stochastic, RSI, Ultimate Oscillator, and Commodity Channel Index (CCI) into one composite indicator offers several advantages for traders and technical analysts:
Comprehensive Insight: Each of these oscillators measures different aspects of market momentum and price action. Combining them into one indicator provides a more comprehensive view of the market's behavior, as it takes into account various dimensions of momentum simultaneously.
Reduced Noise: Standalone oscillators can generate conflicting signals and produce noisy readings, especially during choppy market conditions. A composite indicator smoothes out these discrepancies by averaging the signals from multiple indicators, potentially reducing false signals.
Confirmation and Divergence: By combining multiple oscillators, traders can seek confirmation or divergence signals. When multiple oscillators align in the same direction, it can strengthen a trading signal. Conversely, divergence between the oscillators can warn of potential reversals or weakening trends.
Customization: Traders can tailor the composite indicator to their specific trading strategies and preferences. They have the flexibility to include or exclude specific oscillators, adjust look-back periods, and set threshold levels. This adaptability allows for a more personalized approach to technical analysis.
Clarity and Efficiency: Rather than cluttering the chart with multiple individual oscillators, a composite indicator condenses the information into a single plot. This enhances the clarity of the chart and makes it easier for traders to quickly interpret market conditions.
Overbought/Oversold Identification: Combining these oscillators can improve the identification of overbought and oversold conditions. It reduces the likelihood of false signals since multiple indicators must align to trigger these extreme conditions.
Educational Tool: For novice traders and analysts, a composite indicator can serve as an educational tool by demonstrating how different oscillators interact and influence each other's signals. It allows users to learn about multiple technical indicators in one glance.
Efficient Use of Screen Space: A single composite indicator occupies less screen space compared to multiple separate indicators. This is especially beneficial when analyzing multiple markets or timeframes simultaneously.
Holistic Approach: Instead of relying on a single indicator, a composite approach encourages a more holistic assessment of market conditions. Traders can consider a broader range of factors before making trading decisions.
Increased Confidence: A composite indicator can boost traders' confidence in their decisions. When multiple reliable indicators align, it can provide a stronger basis for taking action in the market.
In summary, combining the Stochastic, RSI, Ultimate Oscillator, and CCI into one composite indicator enhances the depth and reliability of technical analysis. It simplifies the decision-making process, reduces noise, and offers a more complete picture of market momentum, ultimately helping traders make more informed and well-rounded trading decisions.
* Feel free to compare against individual oscillatiors*

[LazyBear] SQZ Momentum + 1st Gray Cross Signals ━ whvntrI have modified LazyBears Squeeze Momentum Indicator with enhancements, plus added signals
LazyBear mentioned that in John F. Carter's book, Chapter 11, "Mastering the Trade", that "Mr. Carter suggests waiting till the first gray after a black cross, and taking a position in the direction of the momentum (for ex., if momentum value is above zero, go long). Exit the position when the momentum changes (increase or decrease --- signified by a color change)." I have done just that. Now at each "first gray after a black cross", there are now Bearish and Bullish signals.. The signals only appear in the direction of the momentum.
Disclaimer: This indicator does not constitute investment advice. Trade at your own
risk with this method of identifying changes in stock market momentum.

TradFi Fundamentals: Momentum Trading with Macroeconomic DataIntroduction
This indicator combines traditional price momentum with key macroeconomic data. By retrieving GDP, inflation, unemployment, and interest rates using security calls, the script automatically adapts to the latest economic data. The goal is to blend technical analysis with fundamental insights to generate a more robust momentum signal.
Original Research Paper by Mohit Apte, B. Tech Scholar, Department of Computer Science and Engineering, COEP Technological University, Pune, India
Link to paper
Explanation
Price Momentum Calculation:
The indicator computes price momentum as the percentage change in price over a configurable lookback period (default is 50 days). This raw momentum is then normalized using a rolling simple moving average and standard deviation over a defined period (default 200 days) to ensure comparability with the economic indicators.
Fetching and Normalizing Economic Data:
Instead of manually inputting economic values, the script uses TradingView’s security function to retrieve:
GDP from ticker "GDP"
Inflation (CPI) from ticker "USCCPI"
Unemployment rate from ticker "UNRATE"
Interest rates from ticker "USINTR"
Each series is normalized over a configurable normalization period (default 200 days) by subtracting its moving average and dividing by its standard deviation. This standardization converts each economic indicator into a z-score for direct integration into the momentum score.
Combined Momentum Score:
The normalized price momentum and economic indicators are each multiplied by user-defined weights (default: 50% price momentum, 20% GDP, and 10% each for inflation, unemployment, and interest rates). The weighted components are then summed to form a comprehensive momentum score. A horizontal zero line is plotted for reference.
Trading Signals:
Buy signals are generated when the combined momentum score crosses above zero, and sell signals occur when it crosses below zero. Visual markers are added to the chart to assist with trade timing, and alert conditions are provided for automated notifications.
Settings
Price Momentum Lookback: Defines the period (in days) used to compute the raw price momentum.
Normalization Period for Price Momentum: Sets the window over which the price momentum is normalized.
Normalization Period for Economic Data: Sets the window over which each macroeconomic series is normalized.
Weights: Adjust the influence of each component (price momentum, GDP, inflation, unemployment, and interest rate) on the overall momentum score.
Conclusion
This implementation leverages TradingView’s economic data feeds to integrate real-time macroeconomic data into a momentum trading strategy. By normalizing and weighting both technical and economic inputs, the indicator offers traders a more holistic view of market conditions. The enhanced momentum signal provides additional context to traditional momentum analysis, potentially leading to more informed trading decisions and improved risk management.
The next script I release will be an improved version of this that I have added my own flavor to, improving the signals.

SMI Momentum Bollinger Squeeze Signals - TradeUIMomentum Bollinger Squeeze Signals - TradeUI
The Squeeze Momentum Indicator (SMI) uses the principles of the Squeeze Indicator, which is a volatility indicator, and combines them with a momentum calculation to provide a more comprehensive view of the market.
The original Squeeze Indicator uses the relationship between the Bollinger Bands and Keltner Channels to identify periods of low volatility, known as "Squeezes", and potential breakout points. The SMI takes this one step further by adding a momentum calculation, making it a more dynamic tool for trading.
The momentum calculation is based on the rate of change of the asset's price. When the price increases rapidly, it signifies positive momentum, and when the price decreases rapidly, it signifies negative momentum.

Chiko-Span Momentum_PineScript_Version5This is Momentum indicator based on "Chiko-span" of Ichimoku Kinko-Hyo.
Differ from normal momentum indicator, this indicator is using "close" and "open" as default parameter which is based on 9 week-candle chart Invented by Ichimoku-Sanjin. And, It is located 26 period before to match chiko-span.
(Parameters can change as you like)
The usage is same as normal momentum indicator so please check momentum indicator usage. However, due to use this indicator, it may support to compare momentum of chiko-span movement and to predict effect 5 lines of ichimoku.
For example, when price break out tenkan-sen, you can measure slope or period of chiko-span momentum and compare previously chiko-span momentum. If momentum is stronger than previously price, we can think that price try to out kijun- sen, touch cloud or break out cloud.
I wish, this indicator helps ichimoku users.
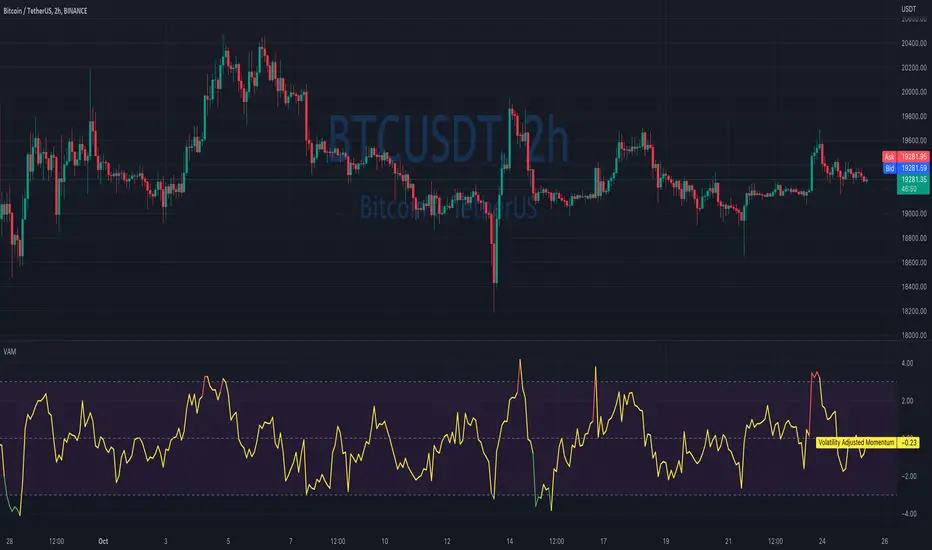
Volatility Adjusted MomentumIt's a script that computes volatility-adjusted momentum indicators.
The problem with the momentum indicator is that it's absolute and it's hard to interpret its value. For example, if you'll change the timeframe or instrument value of Momentum will be very different.
We tried to solve that by expressing momentum in volatility. This way you can easier spot overbought/oversold values.
You can choose to use Standard Deviation or ATR for adjustments.
Thanks to @MUQWISHI for helping me code it.
Disclaimer
Please remember that past performance may not be indicative of future results.
Due to various factors, including changing market conditions, the strategy may no longer perform as well as in historical backtesting.
This post and the script don’t provide any financial advice.
Trend Surfers - Momentum + ADX + EMAThis script mixes the Lazybear Momentum indicator, ADX indicator, and EMA.
Histogram meaning:
Green = The momentum is growing and the ADX is growing or above your set value
Red = The momentum is growing on the downside and the ADX is growing or above your set value
Orange = The market doesn't have enough momentum or the ADX is not growing or above your value (no trend)
Background meaning:
Blue = The price is above the EMA
Purple = The price is under the EMA
Cross color on 0 line:
Dark = The market might be sideway still
Light = The market is in a bigger move

Momentum Trail Oscillator [AlgoAlpha]🟠 OVERVIEW
This script builds a Momentum Trail Oscillator designed to measure directional momentum strength and dynamically track shifts in trend bias using a combination of smoothed price change calculations and adaptive trailing bands. The oscillator aims to help traders visualize when momentum is expanding or contracting and to identify transitions between bullish and bearish conditions.
🟠 CONCEPTS
The core idea combines two methods. First, the script calculates a normalized momentum measure by smoothing price changes relative to their absolute values, which creates a bounded oscillator that highlights whether moves are directional or choppy. Second, it uses a trailing band mechanism inspired by volatility stops, where bands adapt to the oscillator’s volatility, adjusting the thresholds that define a shift in directional bias. This dual approach seeks to address both the magnitude and persistence of momentum, reducing false signals in ranging markets.
🟠 FEATURES
The momentum calculation applies Hull Moving Averages and double EMA smoothing to price changes, producing a smooth, responsive oscillator.
The trailing bands are derived by offsetting a weighted moving average of the oscillator by a multiple of recent momentum volatility. A directional state variable tracks whether the oscillator is above or below the bands, updating when the momentum crosses these dynamic thresholds.
Overbought and oversold zones are visually marked between fixed levels (+30/+40 and -30/-40), with color fills to highlight when momentum is in extreme areas. The script plots signals on both the oscillator pane and optionally overlays markers on the main price chart for clarity.
🟠 USAGE
To use the indicator, apply it to any symbol and timeframe. The “Oscillator Length” controls how sensitive the momentum line is to recent price changes—lower values react faster, higher values smooth out noise. The “Trail Multiplier” sets how far the adaptive bands sit from the oscillator mid-line, which affects how often trend state changes occur. When the momentum line rises into the upper filled area and then crosses back below +40, it signals potential overbought exhaustion. The opposite applies for the oversold zone below -40. The plotted trailing bands switch visibility depending on the current directional state: when momentum is trending up, the lower band acts as the active trailing stop, and when trending down, the upper band becomes active. Trend changes are marked with circular symbols when the direction variable flips, and optional overlay arrows appear on the price chart to highlight overbought or oversold reversals. Traders can combine these signals with their own price action or volume analysis to confirm entries or exits.

Momentum Commitment Delta (MCD)What it is
M C D fuses five micro-structure clues into one 0-to-1 score that says, “how hard are traders actually leaning on this move?”
1. Body-Delta Momentum – average net candle body direction.
2. Volume Commitment – up-volume ÷ down-volume over the same window.
3. Wick Compression – shrinking upper/lower wicks = clean conviction.
4. Candle Sequencing – rewards orderly, staircase-style body growth.
5. Pin Ratio – where the close pins inside each candle’s range.
The five factors are multiplied, then auto-normalized so extremes always land near 0 / 1 on any symbol or timeframe.
I recommend tweaking the settings to fit your edge, the pre-loaded settings may not be suitable for most traders. The MCD works on all timeframes as well :)
⸻
How to read basic signals
• Fresh cross above 0.70 → often the birth of a real breakout.
• Cluster of > 0.70 bars → “commitment lock,” pull-backs usually shallow.
• Price makes new high while M C D doesn’t → beware...
• Cross back below 0.30 after a run → momentum is out of fuel.
⸻
Because M C D is multiplicative, it’s hard to hit the extremes—so when the bars light lime green, the print is usually telling the truth.
I personally use the MCD to identify the peak of a high-conviction range, NOT a breakout. If a bar prints over 0.70 (green) and then a range forms off of the bar which exceeded 0.70, the breakout has a high chance to be explosive, regardless of what MCD reads at the breakout inflection point.
Play around with it, im sure there are plenty of other patterns.
Disclaimer: The Momentum Commitment Delta (MCD) indicator is provided strictly for educational and informational purposes. It does not constitute financial or investment advice, nor is it a recommendation to buy or sell any security. Trading involves substantial risk, and you should always perform your own due diligence and consult a qualified financial professional before making any trading decisions. Past performance is not indicative of future results.
Volume-Price Momentum IndicatorVolume-Price Momentum Indicator (VPMI)
Overview
The Volume-Price Momentum Indicator (VPMI), developed by Kevin Svenson , is a powerful technical analysis tool designed to identify strong bullish and bearish momentum in price movements, driven by volume dynamics. By analyzing price changes and volume surges over a user-defined lookback period, VPMI highlights potential trend shifts and continuation patterns through a smoothed histogram, optional labels, and background highlights. Ideal for traders seeking to capture momentum-driven opportunities, VPMI is suitable for various markets, including stocks, forex, and cryptocurrencies.
How It Works
VPMI calculates the difference between volume-weighted buying and selling pressure based on price changes over a specified lookback period. It amplifies signals during high-volume periods, applies smoothing to reduce noise, and uses momentum checks to detect sustained trends.
Indicator display:
A histogram that oscillates above (bullish) or below (bearish) a zero line, with brighter colors indicating stronger momentum and faded colors for weaker signals.
Optional labels ("Bullish" or "Bearish") to mark significant momentum shifts.
Optional background highlights to visually emphasize strong trend conditions.
Alerts to notify users when strong bullish or bearish momentum is detected.
Key Features
Customizable Settings:
Adjust the lookback period, volume threshold, momentum length, and smoothing to suit your trading style.
Volume Sensitivity:
Emphasizes price movements during high-volume surges, enhancing signal reliability.
Momentum Detection: Uses linear regression and momentum change to confirm sustained trends, reducing false signals.
Visual Clarity:
Offers a clear histogram with color-coded signals, plus optional labels and backgrounds for enhanced chart readability.
Alerts:
Configurable alerts for strong momentum signals, enabling timely trade decisions.
Inputs and Customization
Lookback Period (Default: 9):
Sets the number of bars to analyze price changes. Higher values smooth signals but may lag.
Volume Threshold (Default: 1.4):
Defines the volume level (relative to a 20-period SMA) that qualifies as a surge, amplifying signals.
High Volume Multiplier (Default: 1.5):
Boosts histogram values during high-volume periods for stronger signals.
Histogram Smoothing Length (Default: 4):
Controls the EMA smoothing applied to the histogram, reducing noise.
Momentum Check Length (Default: 4):
Sets the period for momentum trend analysis (recommended to be less than Lookback Period).
Momentum Threshold (Default: 6):
Defines the minimum momentum change required for strong signals.
Show Labels (Default: Off):
Toggle to display "Bullish" or "Bearish" labels on significant momentum shifts.
Show Backgrounds (Default: Off):
Toggle to highlight chart backgrounds during strong momentum periods.
Bullish/Bearish Colors:
Customize colors for bullish (default: green) and bearish (default: red) signals.
Faded Transparency (Default: 40):
Adjusts the transparency of weaker signals for visual distinction.
How to Use
Interpret Signals:
Above Zero (Green):
Indicates bullish momentum. Bright green suggests strong, sustained buying pressure.
Below Zero (Red):
Indicates bearish momentum. Bright red suggests strong, sustained selling pressure.
Faded Colors:
Weaker momentum, potentially signaling consolidation or trend exhaustion.
Enable Visuals:
Turn on "Show Labels" and "Show Backgrounds" in the settings for additional context on strong momentum signals.
Set Alerts:
Use the built-in alert conditions ("Strong Bullish Momentum" or "Strong Bearish Momentum") to receive notifications when significant trends emerge.
Combine with Other Tools:
Pair VPMI with support/resistance levels, trendlines, or other indicators (e.g., RSI, MACD) for confirmation.
Best Practices
Timeframe:
VPMI works on all timeframes, but shorter timeframes (e.g., 5m, 15m) may produce more signals, while longer timeframes (e.g., 1h, 4h, 1D) offer higher reliability.
Market Conditions:
Most effective in trending markets. In choppy or sideways markets, consider increasing the smoothing length or momentum threshold to filter noise.
Risk Management:
Always use VPMI signals in conjunction with a robust trading plan, including stop-losses and position sizing.
Limitations
Lagging Nature:
As a momentum indicator, VPMI may lag in fast-moving markets due to smoothing and lookback calculations.
False Signals:
In low-volume or ranging markets, signals may be less reliable. Adjust the volume threshold or momentum settings to improve accuracy.
Customization Required:
Optimal settings vary by asset and timeframe. Experiment with inputs to align with your trading strategy.
Why Use VPMI?
VPMI offers a unique blend of volume and price momentum analysis, making it a versatile tool for traders seeking to identify high-probability trend opportunities. Its customizable inputs, clear visuals, and alert capabilities empower users to tailor the indicator to their needs, whether for day trading, swing trading, or long-term analysis.
Get Started
Apply VPMI to your chart, tweak the settings to match your trading style, and start exploring momentum-driven opportunities. For questions or feedback, consult TradingView’s community forums or documentation. Happy trading!
