CandelaCharts - Volume Imbalance (VI) 📝 Overview
Volume Imbalance occurs when there’s a noticeable gap between the bodies of two consecutive candlesticks, with no overlap between them. While the wicks of the candles might intersect, the candle bodies remain entirely separate. This phenomenon often signifies that the algorithm driving market activity did not evenly distribute prices between these two levels, leaving behind a small Volume Imbalance (VI).
A Bullish Volume Imbalance forms when the body of a green candlestick gaps above the previous candle’s body, with no overlap, indicating strong upward momentum and insufficient sell-side liquidity.
A Bearish Volume Imbalance forms when the body of a red candlestick gaps below the previous candle’s body, with no overlap, signaling intense downward pressure and a lack of buy-side liquidity.
This indicator can automatically identify volume imbalances by scanning candlestick patterns and detecting gaps between consecutive candle bodies. These volume imbalances act as price magnets, often attracting the market back to fill the gap before resuming its original direction. Recognizing and leveraging these gaps can be a powerful tool in technical analysis for predicting price movements.
📦 Features
MTF
Mitigation
Consequent Encroachment
Threshold
Hide Overlap
Advanced Styling
⚙️ Settings
Show: Controls whether VIs are displayed on the chart.
Show Last: Sets the number of VIs you want to display.
Length: Determines the length of each VI.
Mitigation: Highlights when a VI has been touched, using a different color without marking it as invalid.
Timeframe: Specifies the timeframe used to detect VIs.
Threshold: Sets the minimum gap size required for VI detection on the chart.
Show Mid-Line: Configures the midpoint line's width and style within the VI. (Consequent Encroachment - CE)
Show Border: Defines the border width and line style of the VI.
Hide Overlap: Removes overlapping VIs from view.
Extend: Extends the VI length to the current candle.
Elongate: Fully extends the VI length to the right side of the chart.
⚡️ Showcase
Simple
Mitigated
Bordered
Consequent Encroachment
Extended
🚨 Alerts
This script provides alert options for all signals.
Bearish Signal
A bearish alert triggers when a red candlestick gaps below the previous body, signaling downward pressure.
Bullish Signal
A bullish alert triggers when a green candlestick gaps above the previous body, indicating upward momentum.
⚠️ Disclaimer
Trading involves significant risk, and many participants may incur losses. The content on this site is not intended as financial advice and should not be interpreted as such. Decisions to buy, sell, hold, or trade securities, commodities, or other financial instruments carry inherent risks and are best made with guidance from qualified financial professionals. Past performance is not indicative of future results.
Cari skrip untuk "imbalance"

Machine Learning-Inspired Supply & Demand Zones [AlgoPoint]This indicator is a Smart Supply & Demand Zone tool, developed with principles inspired by Machine Learning (ML). It intelligently filters out market noise, allowing you to focus only on the most significant zones where institutional order flow is likely present.
💡 How It Works: Why Is This Indicator "Smart"?
Unlike traditional indicators that only measure simple price movements, this script uses an algorithm that asks the same critical questions an experienced market analyst would to qualify a zone:
- 1. Price Imbalance: How fast and aggressively did the price leave the zone? Our algorithm measures the body size of the "departure candle" relative to the current market volatility (ATR). A zone is only considered if it was formed by an explosive move that is statistically significant, indicating a major imbalance between buyers and sellers.
- 2. Volume Confirmation: Did the "smart money" participate in this move? The script checks if the volume on the departure candle was significantly higher than the recent average volume. A spike in volume confirms that the move was backed by institutional interest, adding strength and validity to the zone.
- 3. Valid Pivot Structure: Did the zone originate from a meaningful swing high or low? The algorithm first identifies a valid pivot structure, ensuring that zones are not drawn from insignificant or random price fluctuations.
Only when a potential zone passes these three critical tests—our "quality filter"—is it drawn on your chart.
🚀 Features & How to Use
Using the indicator is straightforward. You will see two primary types of boxes on your chart:
* 🟥 Red Box (Supply Zone): An area of potential resistance where selling pressure is likely to be strong. Look for potential shorting opportunities as the price approaches this zone.
* 🟩 Green Box (Demand Zone): An area of potential support where buying pressure is likely to be strong. Look for potential long opportunities as the price pulls back into this zone.
Dynamic Zone Management
This indicator is not static; it lives and breathes with the market:
- Fresh Zone: A newly formed zone appears in its full, vibrant color. These are the highest-probability zones as they have not yet been re-tested.
- Broken / Flipped Zone: You have full control over what happens when a zone is broken! In the settings, you can choose:
- Delete Zone: The zone will be removed completely when the price closes through it.
- Show as Broken (Flip): When broken, the zone will turn gray, stop extending, and remain on your chart. This is extremely useful for identifying Support/Resistance Flips, where a broken demand zone becomes new resistance, or a broken supply zone becomes new support.
⚙️ Settings & Customization
Fine-tune the indicator to match your personal trading style via the settings menu:
- Breakout Behavior: The most powerful feature. Choose between Delete Zone and Show as Broken (Flip) to customize your chart.
- Zone Finding Logic: Control the indicator's sensitivity.
- Selective: Requires both strong imbalance and high volume. Finds fewer, but higher-quality, zones.
- Moderate: Requires either strong imbalance or high volume. Finds more potential zones.
- Sensitivity Settings: Adjust the ATR Multiplier and Volume Multiplier to make the criteria for a "strong" zone stricter or looser.

Unmitigated Liquidity Imbalances [AlgoAlpha]🎉 Introducing the Unmitigated Liquidity Imbalance Indicator by AlgoAlpha! 🎉
Dive into the depths of market analytics with our "Unmitigated Liquidity Imbalance" indicator. This tool harnesses unique algorithms to detect liquidity imbalances between bulls and bears, helping traders spot trends and potential entry and exit points with greater accuracy. 📈🚀
🔍 Key Features:
🌟 Advanced Analysis : Analyses candle direction and length to forecast market peaks and valleys.
🎨 Customizable Visuals : Tailor the chart with your choice of bullish green or bearish red to reflect different market conditions.
🔄 Real-Time Updates : Continuously updates to reflect live market changes.
🔔 Configurable Alerts : Set up alerts for key trading signals such as bullish and bearish reversals, as well as trend shifts.
📐 How to Use:
🛠 Add the Indicator : Add the indicator to your favourites and customize the settings to suite your needs.
📊 Market Analysis : Monitor the oscillator threshold; readings above 0.5 suggest bullish sentiment, while below 0.5 indicate bearish conditions. And reversal signals are displayed to show potential entry points.
🔔 Set Alerts : Enable notifications for reversal conditions or trend changes to seize trading opportunities without constant chart watching.
🧠 How It Works:
The core mechanism of the indicator is based on detecting changes in candlestick size and direction to identify bullish and bearish liquidity levels from the peak & valley indicator's logic. By comparing the length of a current candle to the previous one and checking the change in direction, it pinpoints moments where market sentiment could be shifting, indicating if the liquidity at that point is bullish or bearish. The script then looks at what percentage of the past few unmitigated levels are bullish or bearish based on a customizable lookback and determines the liquidity imbalance which can then be interpreted as trend.
Empower your trading with the Unmitigated Liquidity Imbalance indicator and navigate the markets with confidence and precision. 🌟💹
Happy trading, and may your charts be ever in your favour! 🥳✨
💎 Related Indicator

Liquidity Void and Repair EngineLiquidity Void & Repair Engine
OVERVIEW
The Liquidity Void & Repair Engine is a high-fidelity institutional order flow tool designed to identify and track "Market Imbalances" or "Fair Value Gaps" (FVG). Unlike standard gap indicators that clutter the chart with every minor price jump, this engine uses Volatility-Adjusted Range Mapping to isolate high-conviction voids where price moved so rapidly that liquidity was left "unfilled."
The standout feature of this tool is its Active Repair Logic. The engine doesn't just draw static boxes; it monitors price action in real-time to determine when an imbalance has been "healed" by subsequent trading volume, providing a dynamic look at where the market has "unfinished business."
TECHNICAL LOGIC & ORIGINALITY
This script is published Open Source to contribute to the Pine Script community’s understanding of dynamic object management and order flow visualization.
ATR-Relative Filtering: To ensure only significant voids are plotted, the script uses a user-defined ATR (Average True Range) multiplier. This filters out market noise and focuses on institutional "impulse" moves.
Dynamic Box Management: Utilizing the Pine Script box array system, the script manages memory efficiently by updating existing objects rather than creating redundant ones.
The "Repair" Algorithm: The script tracks the high and low of every active void. When price action fully traverses the coordinates of a void, the script "seals" the box, visually marking the moment of liquidity equilibrium.
HOW TO USE
1. Identifying the "Magnet" (The Void)
When price moves aggressively, it leaves a "hole" in the auction.
Bullish Voids (Green): These represent areas where price surged so fast that buyers may still have unfilled orders sitting below. These act as Magnets for pullbacks.
Bearish Voids (Red): These represent areas where price plummeted, leaving a vacuum of selling pressure. These act as Magnets for relief rallies.
2. Trading the "Repair" Process
The Engine tracks how the market "repairs" these holes:
Partial Fill: If price enters a box but doesn't cross it, the "Magnet" is still active.
Full Repair: When a box is "sealed" (stops extending right), it indicates the imbalance is gone. If price "Seals" a green box and then bounces, it confirms the zone as Valid Institutional Support.
3. Confluence with the Trend
Continuation: In a strong uptrend, look for price to drop into a Green Bullish Void and find support. This is often the "Golden Entry" for trend followers.
Reversal Confirmation: If price ignores a Red Bearish Void and blasts right through it (sealing it instantly), it signals a massive shift in market regime and extreme bullish conviction.
USER SETTINGS
Lookback Period: How far back the engine searches for un-repaired gaps.
Min Gap Size (ATR %): Increase this to see only the "Major" institutional gaps; decrease it for a more granular intraday look.
Visual Styles: Fully customizable colors and transparency to match any chart theme (Dark/Light).
NOTES & DISCLAIMER
This script is a visualization of historical price imbalances and is intended for educational purposes only. It does not provide trade signals, entry/exit points, or financial advice. All trading involves risk.

Directional Imbalance Index [BigBeluga]🔵 OVERVIEW
The Directional Imbalance Index is designed to track market strength by counting how often price sets new highs or lows over a defined lookback period. Every time a bar forms a new extreme, the indicator records a +1 count for either bullish (highs) or bearish (lows). These counts are aggregated into a rolling calculation, allowing traders to see which side dominates and how directional imbalance evolves.
🔵 CONCEPTS
Each new highest high → adds a bullish count (+1).
Each new lowest low → adds a bearish count (+1).
Counts are stored inside arrays over a user-defined Calculation Period .
for i = 0 to period-1
h = high
l = low
if h == upper
countUp.push(1)
if l == lower
countDn.push(1)
The balance between bullish and bearish counts highlights dominance and imbalance.
Normalized percentages help compare both sides (e.g., 65% bullish vs 35% bearish).
🔵 FEATURES
Counts new highs/lows over a chosen Highest/Lowest Length .
Aggregates values over a rolling Calculation Period .
Plots cumulative bullish vs bearish totals in the subchart.
Displays % share of bulls vs bears from total counts.
On-chart labels mark bars where a count was added.
Plots reference lines of the current upper (high) and lower (low) ranges.
Dynamic fill between bullish/bearish plots to visualize which side dominates.
🔵 HOW TO USE
Look for persistent bullish imbalance (bull % > bear %) as confirmation of upward momentum.
Look for persistent bearish imbalance (bear % > bull %) as confirmation of downward momentum.
Watch for shifts in % dominance — often early signs of trend reversal or weakening strength.
Use labels on the chart to visually confirm which bars contributed to directional bias.
Combine with trend or volume tools to confirm whether imbalance aligns with market direction.
🔵 CONCLUSION
The Directional Imbalance Index offers a systematic way to measure directional pressure. By counting how often price pushes into new territory, the indicator reveals whether bulls or bears are taking control. This makes it a valuable tool for detecting early signs of trend continuation or exhaustion, helping traders align with the side most likely to dominate.

Noise Footprint ImbalanceNoise Footprint Imbalance Indicator
The Noise Footprint Imbalance Indicator highlights areas of imbalance in price action, marking potential zones of support and resistance. This indicator helps traders visualize "footprints" of imbalance on the chart, allowing for better identification of areas where price moves significantly away from equilibrium. This can help traders pinpoint potential reversal points or zones where buyers or sellers may step in.
Features
Customizable Box Count: Choose the maximum number of imbalance zones displayed on the chart, keeping your workspace clear and focused.
Imbalance Detection: Highlights both top and bottom imbalances, identifying them based on price discrepancies between open/close and high/low levels.
Dynamic Zone Boxes: Draws boxes around imbalance zones with customizable colors and transparency, providing visual clarity without overwhelming the chart.
Usage
This indicator is beneficial for traders who:
Use imbalance zones as potential areas of interest for entries or exits.
Want to combine it with other indicators or price action analysis to improve trade setups.
Customization Options
Maximum Imbalance Zones: Adjusts the maximum number of imbalance boxes shown.
Imbalance Box Color: Customize the color and transparency of the imbalance zones to suit your chart's theme.
Add this script to your chart to enhance your technical analysis and bring more structure to your trading approach with the Noise Footprint Imbalance Indicator.

Volume Flow ImbalanceVolume Flow Imbalance (VFI) Indicator
The Volume Flow Imbalance (VFI) indicator is designed to provide traders with insights into the market's buying and selling pressure by calculating the imbalance between buy and sell volumes over a user-defined lookback period. This indicator is particularly useful for identifying potential pivot points and market sentiment shifts.
How to Use :
Setup Parameters :
Lookback Period: Set the number of bars over which the imbalance is calculated. Increasing this number provides a broader view of market trends.
Lower Timeframe Data: Optionally enable this feature to analyze volume data from lower timeframes, offering a more granified view of volume flows.
Interpreting the Indicator :
The VFI outputs a value that represents the net imbalance between buying and selling volumes. Positive values indicate a predominance of buying volume, suggesting bullish conditions, while negative values suggest bearish conditions with more selling volume.
The indicator also provides dynamic threshold lines based on the standard deviation of the calculated imbalances, helping to visually identify extreme conditions where reversals might occur.
Application :
Apply the VFI to any chart to assess the balance of trade volumes in real-time.
Use the indicator in conjunction with other technical analysis tools to confirm trends or potential reversals.
Tips :
Adjust the lookback period based on the volatility and trading volume of the asset to optimize performance.
The VFI is best used in liquid markets where volume data is a reliable indicator of market activity.
By providing a clear measure of how much buying and selling is occurring relative to the past, the VFI helps traders make informed decisions based on underlying market dynamics.

Bagang Pivot Zones | Supply & Demand, Support & ResistanceBagang Pivot Zones detects imbalances from classic reversal and momentum price actions.
Imbalances create pivot zones, a.k.a Supply & Demand / Support & Resistance / Orderblock zones.
Use Cases
1. Traders using Supply & Demand theory can quickly pinpoint imbalance zones created by BUY-to-SELL and SELL-to-BUY candles.
2. Trend Following traders can systematically catch and follow a trend based on pivot zones analysis.
3. Breakout traders can easily target pivot zones’ breakout and breakdown.
4. Take the guesswork out of risk management: manage stop-loss precisely behind pivot zones.
5. Analyze contrary pivot zones to set realistic profit targets.
Objectivity
By only comparing OHLC values to identify notable price actions, Bagang Pivot Zones avoids derived calculations with subjective parameters.
Chart Issue
If the chart zooms out after adding an indicator, right-click the price scale and toggle "Scale price chart only” on.

Candle Colored by Volume Z-score [Morty]This indicator colors the candles according to the z-score of the trading volume. You can easily see the imbalance on the chart. You can use it at any timeframe.
In statistics, the standard score (Z-score) is the number of standard deviations by which the value of a raw score (i.e., an observed value or data point) is above or below the mean value of what is being observed or measured. Raw scores above the mean have positive standard scores, while those below the mean have negative standard scores.
This script uses trading volume as source of z-score by default.
Due to the lack of volume data for some index tickers, you can also choose candle body size as source of z-score.
features:
- custom source of z-score
- volume
- candle body size
- any of above two
- all of above two
- custom threshold of z-score
- custom color chemes
- custom chart type
- alerts
default color schemes:
- green -> excheme bullish imbalance
- blue -> large bullish imbalance
- red -> excheme bearish imbalance
- purple -> large bearish imbalance
- yellow -> low volume bars, indicates "balance", after which volatility usually increases and tends to continue the previous trend
Examples:
* Personally, I use dark theme and changed the candle colors to black/white for down/up.
Volume as Z-score source
Any as Z-score source, more imbalances are showed

Volume-Time Imbalance (VTI)Volume-Time Imbalance (VTI) – Indicator Description
This indicator measures the imbalance between traded volume and the time elapsed between bars to identify unusual spikes in volume per second (volume per unit of time). Its purpose is to highlight volume movements that may indicate moments of strong interest, acceleration, or reversal in the market.
How it works:
It calculates the traded volume divided by the time (in seconds) elapsed since the previous bar — thus obtaining the volume per second.
An EMA (exponential moving average) of this volume per second is calculated to smooth the data.
The VTI value is the ratio between the current volume per second and this moving average, showing if the current volume is above what is expected for that pace.
The higher the VTI, the greater the imbalance between volume and time, indicating possible bursts of activity.
Settings:
VTI Moving Average Length: The period of the moving average used to smooth the volume per second (default is 20).
Alert Thresholds: Alert levels to identify moderate and high imbalances (defaults are 1.5 and 2.0).
Show VTI Histogram: Displays the VTI histogram in the indicator window.
Color Background: Colors the indicator background based on the strength of the imbalance (orange for moderate, red for high).
Show Alert Arrows: Shows arrows below the chart when a strong volume spike occurs (high alert).
Interpretation:
VTI values above the moderate level (1.5) indicate an unusual increase in volume relative to time.
Values above the high level (2.0) signal strong spikes that may anticipate significant moves or trend changes.
Use the colors and arrows as visual confirmations to quickly identify these moments.

Initial Imbalance [First FVG - ICT] v1Initial Imbalance v1
This indicator identifies the first Fair Value Gap (FVG) at the start of a user-defined session, inspired by The Inner Circle Trader. It helps traders spot initial imbalance in a sessions price action, offering filter options to refine FVG detection and optional session high/low lines for context.
Features:
Detects the first bullish or bearish FVG at the session start (default: 08:30). ISE: Sets a custom session start time (hour and minute).
Filters FVGs by size: None, ATR-based, or Points-based.
Displays session high/low lines (optional) to visualize the session range.
Customizable colors for bullish and bearish FVGs (background and border derived from a single color input).
Alerts for new FVGs and mitigated FVGs.
Settings:
Session Start Time: Define the hour and minute for the session start.
FVG Filter Type: Choose None, ATR, or Points to filter FVGs by size.
ATR Multiple / Minimum Points: Set the minimum FVG size for ATR or Points filters.
Show Session High/Low Lines: Toggle visibility of session range lines.
Bullish/Bearish FVG Colors: Customize colors for FVGs.
Technical Details:
Overlay indicator, displayed directly on the price chart.
This indicator is ideal for traders seeking to identify key price imbalances at the start of a session, with flexible filtering and visualization options.

Liquidity Voids (FVG) [LuxAlgo]The Liquidity Voids (FVG) indicator is designed to detect liquidity voids/imbalances derived from the fair value gaps and highlight the distribution of the liquidity voids at specific price levels.
Fair value gaps and liquidity voids are both indicators of sell-side and buy-side imbalance in trading. The only difference is how they are represented in the trading chart. Liquidity voids occur when the price moves sharply in one direction forming long-range candles that have little trading activity, whilst a fair value is a gap in price.
🔶 USAGE
Liquidity can help you to determine where the price is likely to head next. In conjunction with higher timeframe market structure, and supply and demand, liquidity can give you insights into potential price movement. It's essential to practice using liquidity alongside trend analysis and supply and demand to read market conditions effectively.
The peculiar thing about liquidity voids is that they almost always fill up. And by “filling”, we mean the price returns to the origin of the gap. The reason for this is that during the gap, an imbalance is created in the asset that has to be made up for. The erasure of this gap is what we call the filling of the void. And while some voids waste no time in filling, some others take multiple periods before they get filled.
🔶 SETTINGS
The script takes into account user-defined parameters and detects the liquidity voids based on them, where detailed usage for each user-defined input parameter in indicator settings is provided with the related input's tooltip.
🔹 Liquidity Detection
Liquidity Voids Threshold: Act as a filter while detecting the Liquidity Voids. When set to 0 basically means no filtering is applied, increasing the value causes the script to check the width of the void compared to a fixed-length ATR value
Bullish: Color customization option for Bullish Liquidity Voids
Bearish: Color customization option for Bearish Liquidity Voids
Labels: Toggles the visibility of the Liquidity Void label
Filled Liquidity Voids: Toggles the visibility of the Filled Liquidity Voids
🔹 Display Options
Mode: Controls the lookback length of detection and visualization
# Bars: Lookback length customization, in case Mode is set to Present
🔶 RELATED SCRIPTS
Buyside-Sellside-Liquidity
Fair-Value-Gaps

📊 Volume Tension & Net Imbalance📊 Volume Tension & Net Imbalance (With Table + MultiLang + Alerts)
//
This indicator measures bullish vs. bearish pressure using volume-based tension and net imbalance.
It identifies accumulation zones, displays real-time market strength, trend direction, and triggers alerts on buildup entries.
Fully customizable table size, colors, and bilingual support (English/Russian).

Displacement (Two FVGs)A simple indicator that attempts to identify displacement in price by alerting you when two simultaneous Fair Value Gaps (FVGs) occur.
When two fair value gaps occur, the indicator will print a green bar (if bullish) or a red bar (if bearish). If you right click on the indicator you can turn on alerts that will pop up every time a dual FVG occurs.
Fair Value Gaps are most commonly used amongst price action traders and are defined as instances in which there are inefficiencies, or imbalances, in the market.
The concept for this indicator is very simple. Apply it to your chart and enable alerts on the instruments and timeframe you trade. When you get an alert, it could indicate larger players getting involved.
This is NOT a trading strategy. Its intention is to save time by alerting you to large imbalances in price on the instruments you trade.

Market Imbalance Tracker (Inefficient Candle + FVG)# 📊 Overview
This indicator combines two imbalance concepts:
• **Squared Up Points (SUP)** – midpoints of large, "inefficient" candles that often attract price back.
• **Fair Value Gaps (FVG)** – 3-candle gaps created by strong impulse moves that often get "filled."
Use them separately or together. Confluence between a SUP line and an FVG boundary/midpoint is high-value.
---
# ⚡ Quick Start (2 minutes)
1. **Add to chart** → keep defaults (Percentile method, 80th percentile, 100-bar lookback).
2. **Watch** for dashed SUP lines to print after large candles.
3. **Toggle Show FVG** → see green/red boxes where gaps exist.
4. **Turn on alerts** → New SUP created, SUP touched, New FVG.
5. **Trade the reaction** → look for confluence (SUP + FVG + S/R), then manage risk.
---
# 🛠 Features
## 🔹 Squared Up Points (SUP)
• **Purpose:** Midpoint of a large candle → potential support/resistance magnet.
• **Detection:** Choose *Percentile* (adaptive) or *ATR Multiple* (absolute).
• **Validation:** Only plots if the preceding candle does not touch the midpoint (with tolerance).
• **Lifecycle:** Line auto-extends into the future; it's removed when touched or aged out.
• **Visual:** Horizontal dashed line (color/width configurable; style fixed to dashed if not exposed).
## 🔹 Fair Value Gaps (FVG)
• **Purpose:** 3-candle gaps from an impulse; price often revisits to "fill."
• **Detection:** Requires a strong directional candle (Marubozu threshold) creating a gap.
• **Types:**
- **Bullish FVG (Green):** Gap below; expectation is downward fill.
- **Bearish FVG (Red):** Gap above; expectation is upward fill.
• **Close Rules (if implemented):**
- *Full Fill:* Gap closes when the opposite boundary is tagged.
- *Midpoint Fill:* Gap closes when its midpoint is tagged.
• **Visual:** Colored boxes; optional split-coloring to emphasize the midpoint.
> **Note:** If a listed FVG option isn't visible in Inputs, you're on a lighter build; use the available switches.
---
# ⚙️ Settings
## SUP Settings
• **Candle Size Method:** Percentile (top X% of recent ranges) or ATR Multiple.
• **Candle Size Percentile:** e.g., 80 → top 20% largest candles.
• **ATR Multiple & Period:** e.g., 1.5 × ATR(14).
• **Percentile Lookback:** Bars used to compute percentile.
• **Lookback Period:** How long SUP lines remain eligible before auto-cleanup.
• **Touch Tolerance (%):** Buffer based on the inefficient candle's range (0% = exact touch).
## Line Appearance
• **Line Color / Width:** Customizable.
• **Style:** Dashed (fixed unless you expose a style input).
## FVG Settings (if present in your build)
• **Show FVG:** On/Off.
• **Close Method:** Full Fill or Midpoint.
• **Marubozu Wick Tolerance:** Max wick % of the impulse bar.
• **Use Split Coloring:** Two-tone box halves around midpoint.
• **Colors:** Bullish/Bearish, and upper/lower halves (if split).
• **Max FVG Age:** Auto-remove older gaps.
---
# 📈 How to Use
## Trading Applications
• **SUP Lines:** Expect reaction on first touch; use as S/R or profit-taking magnets.
• **FVG Fills:** Price frequently tags the midpoint/boundary before continuing.
• **Confluence:** SUP at an FVG midpoint/boundary + higher-timeframe S/R = higher quality.
• **Bias:** Clusters of unfilled FVGs can hint at path of least resistance.
## Best Practices
• **Timeframe:** HTFs for swing levels, LTFs for execution.
• **Volume:** High volume at level = stronger signal.
• **Context:** Trade with broader trend or at least avoid counter-trend without confirmation.
• **Risk:** Always pre-define invalidation; structures fail in chop.
---
# 🔔 Alerts
• **New SUP Created** – When a qualifying inefficient candle prints a SUP midpoint.
• **SUP Touched/Invalidated** – When price touches within tolerance.
• **New FVG Detected** – When a valid gap forms per your rules.
> **Tip:** Set alerts *Once Per Bar Close* on HTFs; *Once* on LTFs to avoid noise.
---
# 🧑💻 Technical Notes
• **Percentile vs ATR:** Percentile adapts to volatility; ATR gives consistency for backtesting.
• **FVG Direction Logic:** Gap above price = bearish (expect up-fill); below = bullish (expect down-fill).
• **Performance:** Limits on lines/boxes and auto-aging keep things snappy.
---
# ⚠️ Limitations
• Imbalances are **context tools**, not signals by themselves.
• Works best with trend or clear impulses; expect noise in narrow ranges.
• Lower-timeframe gaps can be plentiful and lower quality.
---
# 📌 Version & Requirements
• **Pine Script v6**
• Heavy drawings may require **TradingView Pro** or higher (object limits).
---
*For best results, combine with your existing trading strategy and proper risk management.*

Unrecovered Imbalanced Zone with PVRSAThis indicator highlights imbalanced PVSRA candles that have not been recovered.
Bullish Candles/Zones
200% Volume = Green
150% Volume = Blue
Bearish Candles/Zones
200% Volume = Red
150% Volume = Fuchsia
Imbalanced Zones with normal/below 150% Average 10ema volume can be displayed or hidden from view (Hidden by default)

Fair Value Gaps Mitigation Oscillator [LuxAlgo]The Fair Value Gaps Mitigation Oscillator is an oscillator based on the traditional Fair Value Gaps (FVGs) imbalances. The oscillator displays the current total un-mitigated values for the number of FVGs chosen by the user.
The indicator also displays each New FVG as a bar representing the current ratio of the New FVG in relation to the current un-mitigated total for its direction.
🔶 USAGE
When an FVG forms, it is often interpreted as strong market sentiment in the direction of the gap. For example, an upward FVG during an uptrend is typically seen as a confirmation of the strength and continuation of the trend, as it indicates that buyers are willing to purchase at higher prices without much resistance, suggesting strong demand and positive sentiment.
By analyzing the mitigation (or lack thereof), we can visualize the increase of directional strength in a trend. This is where the proposed oscillator is useful.
🔶 DETAILS
The oscillator's values are expressed as Percentages (%). Each FVG is allocated 100% of the total of its width with a max potential value of 100 and minimum potential value of 0.
Based on the "FVG Lookback" Input, the FVGs are scaled to fit within the range of +1 to -1. Using a higher "FVG Lookback" value will allow you to get indications of longer-term trends.
A higher value of the normalized bullish FVG areas suggest a stronger and cleaner uptrend, while lower values of the bearish the normalized bullish FVG areas suggest a stronger and cleaner downtrend.
+1 or -1 indicates that there is a Full Lookback of FVGs, and each one is fully un-mitigated, and the opposite direction of FVGs is entirely Mitigated.
When the price closes over/under or within an FVG it begins to get mitigated, when this happens the % of mitigation is subtracted from the total.
When a New FVG is formed, a Histogram bar is created representing the ratio of the current FVG's width to the total width off all un-mitigated FVGs.
The entire bar represents 100% of total un-mitigated FVG Width.
The filled area represents the current FVG's width relative to the whole.
A 50% hash mark is also displayed for reference.
🔶 SETTINGS
FVG Lookback - Determines the number of FVGs (Bullish and Bearish Pairs) to keep in memory for analysis.

ICT Fair Value Gap [LM]Hello traders,
I would like to present you ICT Fair Value Gap script. The idea is the same as in my other script to look form imbalances. I have improved the previous script from teaching of ICT and created this script to train the eye to see those gaps. Shrinking option also shows if the gap has been already filled and also in case gap is filled you can get alert in case you will set it up .
The script has two settings:
general settings - definition of volatility condition for middle candle
box settings - setting for boxes, box colors, shrinking
I hope you enjoy it,
Lukas

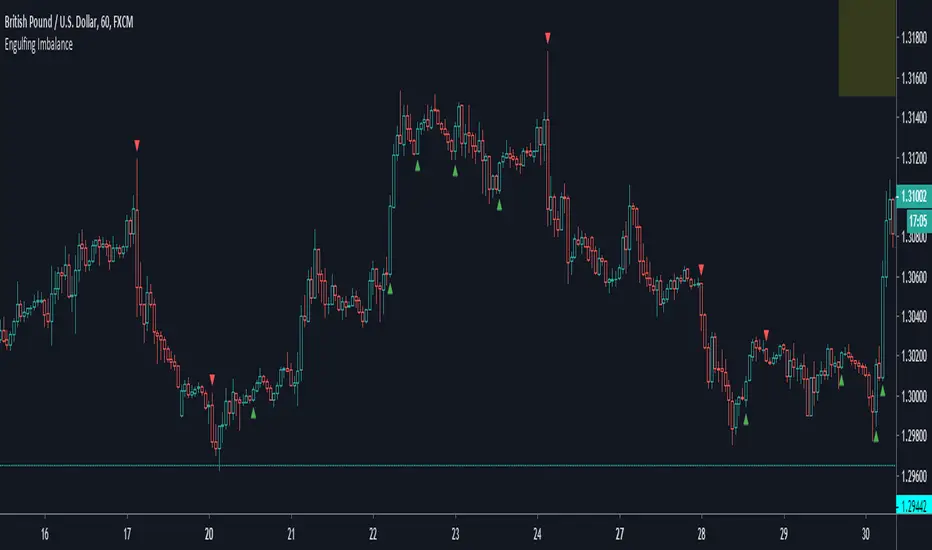
Engulfing ImbalanceShows Engulfing candles which are immediately followed by an imbalance. Useful to quickly identify impulsive moves and future reversal areas.
FVG Heatmap [Hash Capital Research]FVG Map
FVG Map is a visual Fair Value Gap (FVG) mapping tool built to make displacement imbalances easy to see and manage in real time. It detects 3-candle FVG zones, plots them as clean heatmap boxes, tracks partial mitigation (how much of the zone has been filled), and summarizes recent “fill speed” behavior in a small regime dashboard.
This is an indicator (not a strategy). It does not place trades and it does not publish performance claims. It is a market-structure visualization tool intended to support discretionary or systematic workflows.
What this script detects
Bullish FVG (gap below price)
A bullish FVG is detected when the candle from two bars ago has a high below the current candle’s low.
The zone spans from that prior high up to the current low.
Bearish FVG (gap above price)
A bearish FVG is detected when the candle from two bars ago has a low above the current candle’s high.
The zone spans from the current high up to that prior low.
What makes it useful
Heatmap zones (clean, readable FVG boxes)
Bullish zones plot below price. Bearish zones plot above price.
Partial fill tracking (mitigation progress)
As price trades back into a zone, the script visually shows how much of the zone has been filled.
Mitigation modes (your definition of “filled”)
• Full Fill: price fully trades through the zone
• 50% Fill: price reaches the midpoint of the zone
• First Touch: price touches the zone one time
Optional auto-cleanup
Optionally remove zones once they’re mitigated to keep the chart clean.
Fill-Speed Regime Dashboard
When zones get mitigated, the script records how many bars it took to fill and summarizes the recent environment:
• Average fill time
• Median fill time
• % fast fills vs % slow fills
• Regime label: choppy/mean-revert, trending/displacement, or mixed
How to use
Use FVG zones as structure, not guaranteed signals.
• Bullish zones are often watched as potential support on pullbacks.
• Bearish zones are often watched as potential resistance on rallies.
The fill-speed dashboard helps provide context: fast fills tend to appear in more rotational conditions, while slow fills tend to appear in stronger trend/displacement conditions.
Alerts
Bullish FVG Created
Bearish FVG Created
Notes
FVGs are not guaranteed reversal points. Fill-speed/regime is descriptive of recent behavior and should be treated as context, not prediction. On realtime candles, visuals may update as the bar forms.

ICT FVG & Swing Detector Basic by Trader RiazICT FVG & Swing Detector Basic by Trader Riaz
Unlock Precision Trading with the Ultimate Fair Value Gap (FVG) and Swing Detection Tool!
Developed by Trader Riaz , the ICT FVG and Swing Detector Basic is a powerful Pine Script indicator designed to help traders identify key market structures with ease. Whether you're a day trader, swing trader, or scalper, this indicator provides actionable insights by detecting Bullish and Bearish Fair Value Gaps (FVGs) and Swing Highs/Lows on any timeframe. Perfect for trading forex, stocks, crypto, and more on TradingView!
Key Features:
1: Bullish and Bearish FVG Detection
- Automatically identifies Bullish FVGs (highlighted in green) and Bearish FVGs (highlighted in red) to spot potential reversal or continuation zones.
- Displays FVGs as shaded boxes with a dashed midline at 70% opacity, making it easy to see the midpoint of the gap for precise entries and exits.
- Labels are placed inside the FVG boxes at the extreme right for clear visibility.
2: Customizable FVG Display
- Control the number of Bullish and Bearish FVGs displayed on the chart with user-defined inputs (fvg_bull_count and fvg_bear_count).
- Toggle the visibility of Bullish and Bearish FVGs with simple checkboxes (show_bull_fvg and show_bear_fvg) to declutter your chart.
3: Swing High and Swing Low Detection
- Detects Swing Highs (blue lines) and Swing Lows (red lines) to identify key market turning points.
- Labels are positioned at the extreme right edge of the lines for better readability and alignment.
- Customize the number of Swing Highs and Lows displayed (swing_high_count and swing_low_count) to focus on the most recent market structures.
4: Fully Customizable Display
- Toggle visibility for Swing Highs and Lows (show_swing_high and show_swing_low) to suit your trading style.
- Adjust the colors of Swing High and Low lines (swing_high_color and swing_low_color) to match your chart preferences.
5: Clean and Efficient Design
- Built with Pine Script v6 for optimal performance on TradingView.
- Automatically removes older FVGs and Swing points when the user-defined count is exceeded, keeping your chart clean and focused.
- Labels are strategically placed to avoid clutter while providing clear information.
Why Use This Indicator?
Precision Trading: Identify high-probability setups with FVGs and Swing points, commonly used in Smart Money Concepts (SMC) and Institutional Trading strategies.
User-Friendly: Easy-to-use inputs allow traders of all levels to customize the indicator to their needs.
Versatile: Works on any market (Forex, Stocks, Crypto, Commodities) and timeframe (1M, 5M, 1H, 4H, Daily, etc.).
Developed by Trader Riaz: Backed by the expertise of Trader Riaz, a seasoned trader dedicated to creating tools that empower the TradingView community.
How to Use:
- Add the Custom FVG and Swing Detector to your chart on TradingView.
- Adjust the input settings to control the number of FVGs and Swing points displayed.
- Toggle visibility for Bullish/Bearish FVGs and Swing Highs/Lows as needed.
- Use the identified FVGs and Swing points to plan your trades, set stop-losses, and target key levels.
Ideal For:
- Traders using Smart Money Concepts (SMC), Price Action, or Market Structure strategies.
- Those looking to identify liquidity grabs, imbalances, and trend reversals.
- Beginners and advanced traders seeking a reliable tool to enhance their technical analysis.
Happy trading!

Fair Value Gaps (FVG) [UAlgo]A fair value gap is especially popular among price action traders and occurs when there are inefficiencies or imbalances in the market, or when the buying and selling are not equal. Fair value gaps can become a magnet for the price before continuing in the same direction.
🔶 Key Features :
Fair Value Gap Identification:
Bullish fair value gaps occur when the current market price exceeds the previous high. The indicator identifies bullish gaps by comparing the low of the current candle with the high of the candle two candles ago . If the low of the current candle is higher than the high two candles ago and the closing price of the previous candle is also higher than the high two candles ago, a bullish fair value gap is detected.
Bearish fair value gaps occur when the current market price falls below the previous low. The indicator identifies bearish gaps by comparing the high of the current candle with the low of the candle two candles ago. If the high of the current candle is lower than the low two periods ago and the closing price of the previous candle is also lower than the low two candles ago, a bearish fair value gap is detected.
Fair Value Gap Filter :
ATR measures market volatility by analyzing the range of price movements over a specified period. It provides insights into the average price range that a security experiences within a given timeframe. After the ATR is calculated, a Simple Moving Average (SMA) is computed for the ATR values. This moving average smoothens out the ATR data, providing a clearer indication of the average volatility levels over time.
When the filter is active, fair value gaps are identified only if they occur during periods of relatively higher volatility, as indicated by the ATR being greater than the SMA. This helps in refining and obtaining the detection of stronger fair value gaps
An example with FVG filtering off:
An example with FVG filtering on:
Customizable Settings: Users have the flexibility to customize various parameters to suit their trading preferences. They can adjust settings such as the number of fair value gaps displayed, mitigation method (either based on closing prices or wicks), and apply filters based on Average True Range (ATR) to refine gap detection.
🔶 Disclaimer :
Use with Caution: Trading involves significant risk, and this indicator should be used with caution. While it can help identify potential trading opportunities, it does not guarantee profits and may sometimes provide false signals.
Not Financial Advice: The information provided by the Fair Value Gaps indicator is for educational and informational purposes only and should not be considered as financial advice. Traders should conduct their own research and consult with financial professionals before making any trading decisions.
Past Performance: Past performance is not indicative of future results. Historical price movements analyzed by the indicator may not accurately predict future market behavior.

Strong Demands & Supplies + Liquidity | Zonas de Compra e VendaThis indicator is inspired on the Smart Money Concepts indicator (Credits to @LuxAlgo) and it was optimized to show only the most relevant demand and supply zones (premium) on every time frame - but on higher time frames (1H and above) the zones are more relevant and stronger, meaning these zones can handle the price for longer time.
I've added a new feature that includes the Liquidity lines in order to add more confluence and importance to a demand or supply zone: when a demand or supply zone has strong liquidity (like weekly or monthly) next to it means that zone can be a strongest price target.
- Blue Line: Daily liquidity
- Yellow Line: Weekly Liquidity
- Purple Line: Monthly Liquidity
Main Features:
- Displays the most relevant demand and supply zones (green and red boxes) and which ones are strong and weak
- Displays the relevant change of character and break of structure
- Displays the previous day highest price and previous day lowest price
- Display imbalances between sell and buy orders (purple boxes)
- Displays the liquidity areas with lines on each point.
- It works for Forex and Cryptocurrency as well.
Portuguese:
Este indicador é inspirado no Smart Money Concepts (Créditos para @LuxAlgo) e foi otimizado para mostrar apenas as zonas de procura e oferta mais relevantes em cada time frame - mas em time frames maiores as zonas são mais relevantes e mais fortes.
Adicionei uma nova funcionalidade que inclui as linhas de Liquidez de forma a adicionar mais confluência e importância a uma zona de procura ou oferta: quando uma zona de procura ou oferta tem forte liquidez (como semanal/linha amarela ou mensal/linha roxa) junto a ela significa que aquela zona pode ser um alvo de preço mais forte.
- Linha Azul: Liquidez diária
- Linha Amarela: Liquidez Semanal
- Linha Roxa: Liquidez Mensal
Principais características:
- Exibe as zonas de procura e oferta mais relevantes (zonas a verde e zonas a vermelho) e quais delas são fortes e fracas
- Exibe a mudança relevante de caráter e quebra de estrutura
- Exibe o preço mais alto do dia anterior e o preço mais baixo do dia anterior
- Exibe as imbalances entre as ordens de venda e compra (zonas a roxo)
- Exibe as zonas de maior liquidez através de linhas no gráfico
- Funciona tanto para Forex como para Criptomoedas
