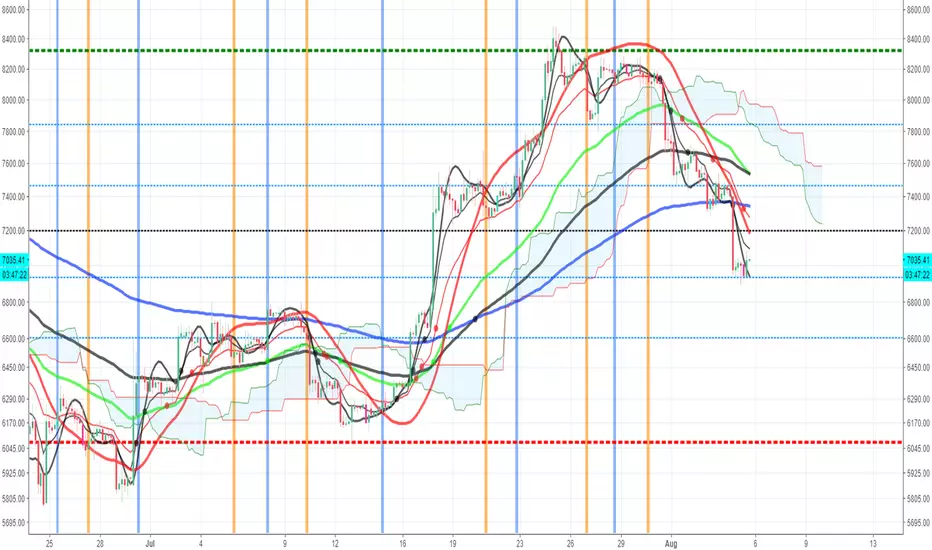
Fibonacci Moving Average (EMA/SMA) Bundle //@v1.2 Fibonacci Moving Average (EMA/SMA) Bundle
//By Tantamount
//Save your TV indicator use counts by using the Fibonacci SMA/EMA all in one indicator! Toggle between Exponetial or Simple moving averages functionality, using Fibonacci the sequence.
//Fib moving averages are very good at locating support and resistance zones on multiple time frames.
//Customize and or input your very own moving average nomenclature by simply changing the input options from default: SMA (21, 55, 89, 144, 233) or EMA (21, 55, 89, 144, 233) Example: (8,13,21,55,89)
Support and Resistance Lines
Cari skrip untuk "fib"


Fibonacci Pivot RangeThis is based on Fibonacci Pivot Points. I forked "CristianD CD_PivotR" code for this. Thanks
"Fibonacci Pivot Points start just the same as Standard Pivot Points. From the base Pivot Point, Fibonacci multiples of the high-low differential are added to form resistance levels and subtracted to form support levels."
Pivot Point (P) = (High + Low + Close)/3
Support 1 (S1) = P - {.382 * (High - Low)}
Support 2 (S2) = P - {.618 * (High - Low)}
Resistance 1 (R1) = P + {.382 * (High - Low)}
Resistance 2 (R2) = P + {.618 * (High - Low)}
Adding more support or resistance levels should be really easy.

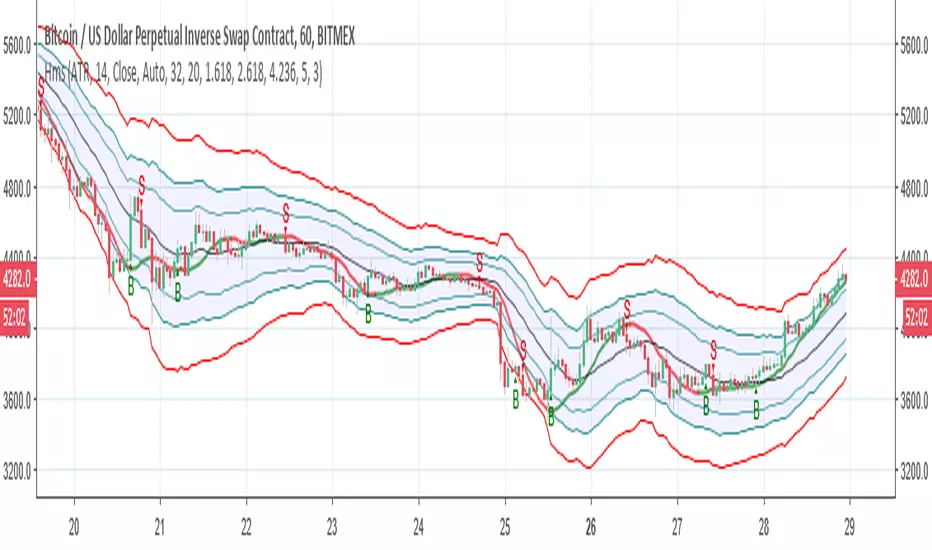
Hull modelius take profit and stop lossThis model has Hull moving average, fibs in form of Bollinger ,SMA and Modelius model with ATR for buy and sell power based on weis volume. Inside alerts for buy and sell. take profit and stop loss for both longs and shorts
so have fun
Golden Fib WavesDynamic Fibonacci levels in pleasing gold shades. Smoothing (SMA) of swing lows and highs enabled by default. Boldly, this just looks good. I am not sure whether it is of any help for trading purposes. If you do in fact find it useful, feel free to drop me a line and to share your insights.

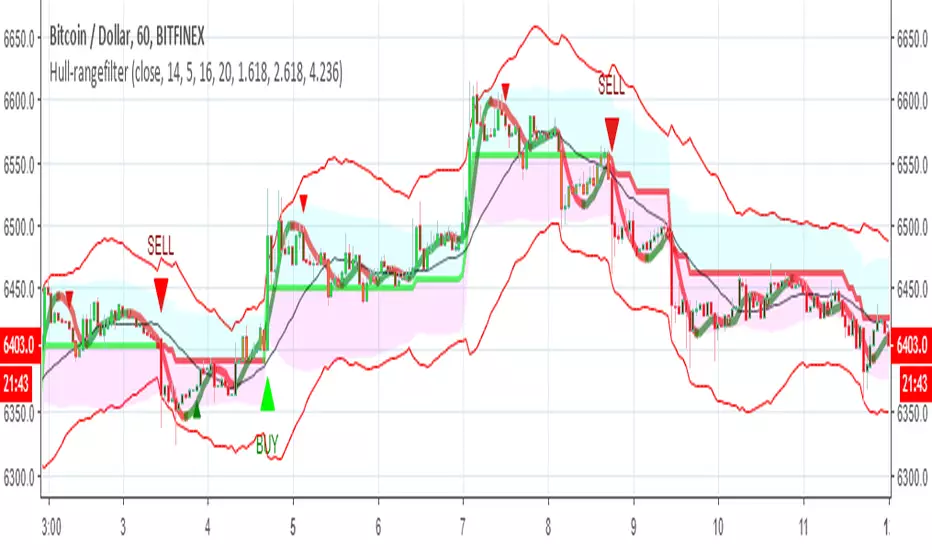
Hull-rangefilterMix of XAvi range filter and Hull fib , seems to be nice hybrid
alerts inside for both systems
for each coin isuugets to optimise the Hull length or the range (now set to 5) and then to test it
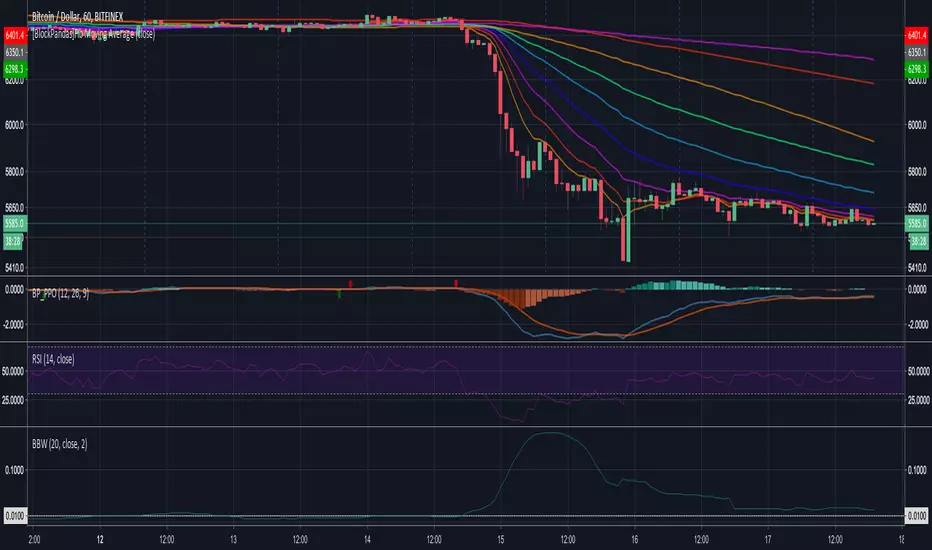
[BlockPandas]Fib Moving AverageThis is a Moving Average cluster in one overlay indicator. You can choose to use SMA or EMA or Mixed Moving Average. The mixed mode is only taking affect if you select 'Use EMA', which uses SMA when length of MA is above 100.
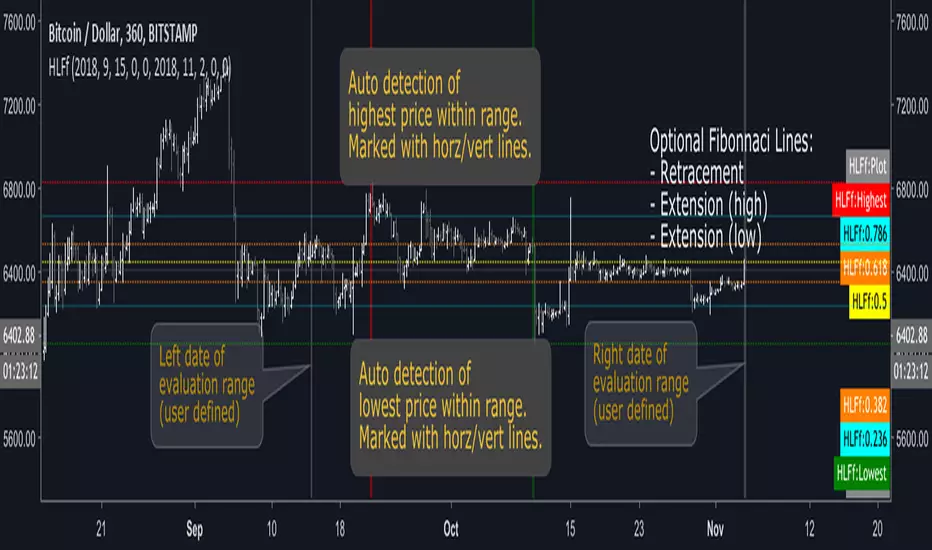
Auto High Low Fib-FixedAuto detect highest/lowest price within a range of bars. The range is user defined by selecting a fixed date (timestamp) for the left and right endpoints. As new bars appear in the chart, the endpoints do not move (thus "fixed" in time).
Optionally add Fibonnaci Lines (retracement or extension).
See the comments at the beginning of the script for a complete description.
---------------------------
While there are several versions of this indicator in TradingView, this one adds some unique flexibility. And it's open source, so you can improve on it.
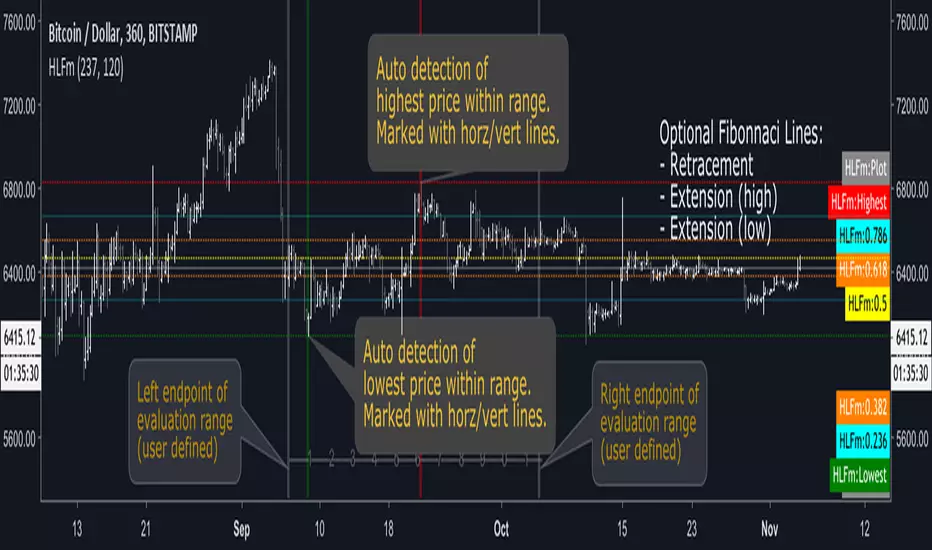
Auto High Low Fib-MovingAuto detect highest/lowest price within a range of bars (user defined). The range slides forward in time as new bars appear in the chart.
Optionally add Fibonnaci Lines (retracement or extension).
See the comments at the beginning of the script for a complete description.
---------------------------
While there are several versions of this indicator in TradingView, this one adds some unique flexibility. And it's open source, so you can improve on it.
Philosof fib maI like Fibonacci and I think multiple MAs are best for identifying the trend. This one is based on someone else's script. I just need to share it with a friend =)

Trading ComboThis is a combo of many indicators including :
Ichimoku Cloud(With Buy and Sell Signals)
EMA
MA
HULL MA
Fibonacci Lines
Bitcoin Kill Zones(Turned off by Default)
MA Turning Points
Reversal(Pin) Bars and Upshaved and Downshaved Bars(Inside and Outside Bars Disabled By default)
Credits to for the source code:
Lazybear
ChrisMoody
100kiwi
Gesundheit
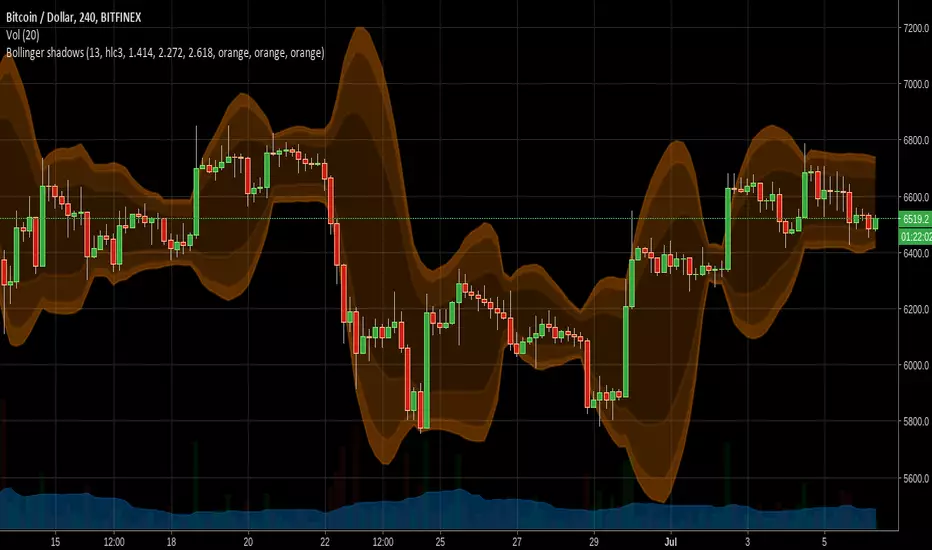
Cooltoyz : Bollinger ShadowsFinally, another gadget for the cooltoyz series :)
this is a simple tool to allow vizualizing bollinger bands with several values/levels. usually boll bands have the levels at 1.5, 2, 3, for multiplier of standadrd deviations. but, just changing those values, we can apply fibbonnaci levels to the bands.
The inputs on this indicator come with fib levels by default, but the values are part of input fields, so it's easy to change to whatever you prefer, back to the calssic std.deviation values, for example. also, the colors are set to make a visual slope, so it's more instinctive to see how strong the candles are moving.
just play with it, and like it. or not :)
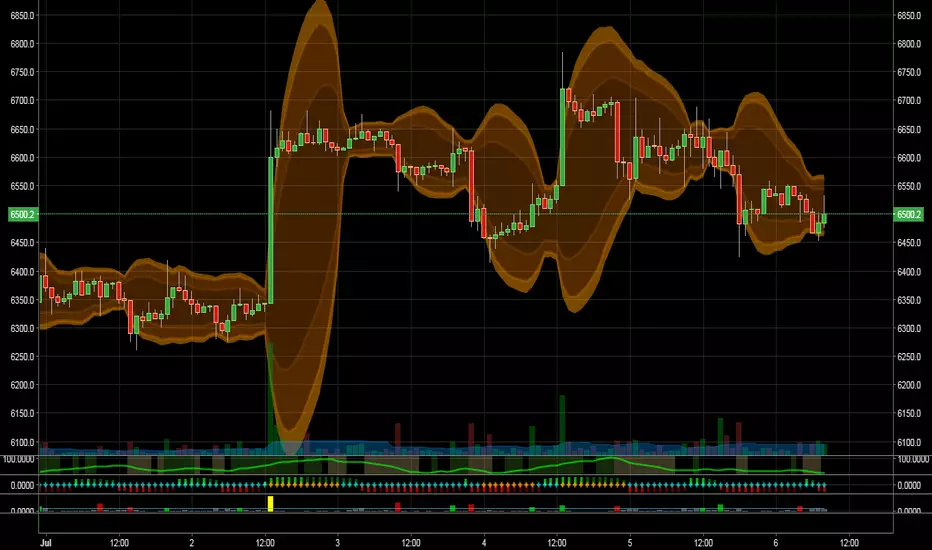
here is another example, where the colors are reversed, to create a more classic "shadowy" effect.
i just like to have the edge level set stronger, it's easier to see when stuff is "on fire" :)
Cooltoyz: Multi level Bollinger ShadowsFinally, another gadget for the cooltoyz series :)
this is a simple tool to allow vizualizing bollinger bands with several values/levels. usually boll bands have the levels at 1.5, 2, 3, for multiplier of standadrd deviations. but, just changing those values, we can apply fibbonnaci levels to the bands.
The inputs on this indicator come with fib levels by default, but the values are part of input fields, so it's easy to change to whatever you prefer, back to the calssic std.deviation values, for example. also, the colors are set to make a visual slope, so it's more instinctive to see how strong the candles are moving.
just play with it, and like it. or not :)
Daily Auto Fibonacci ToolCalculates Fibonacci retracements based on daily highs/lows, and further beyond that if specified. The main difference between this and other auto Fibbing tools is ease of visibility.
Options:
Take highs/lows from a few days back or take highs/lows from each daily candle
Hide retracements before today
Show labels for each retracement level
Hide/Show retracement levels
Change colors quickly and uniformly (in script)
Retracements used:
-0.382 / 0 / 0.236 / 0.382 / 0.5 / 0.618 / 0.786 / 1 / 1.272

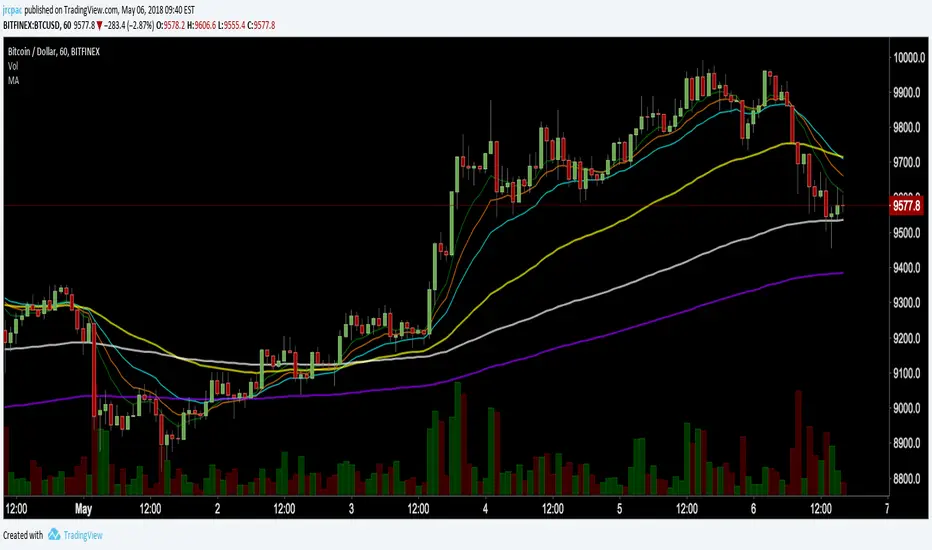
Fibonacci Exponential Moving Averages (+ 200EMA)One indicator to rule them all...
So here you have the fib based EMA`s (8,3,21,55) plus I added the 200 EMA cause I love it and should give you the complete picture. Have fun!
To add click on "Add to favorite scripts" and then select in your TV settings.
*Thanks to behind_crypto for publishing the base version of the script!*

Ichimoku Fibonacci HybridHey guys, this is a variation of Ichimoku using Fibonacci principles.
Overview
As you may know, Ichimoku uses in its calculations (high + low)/2 to calculate Tenkan-sen (Conversion line) and Kijun-sen (Base line) for different periods: Tenkan is a shorter period, so it reacts faster to reversals, while Kijun is slower, so it reacts slower, and it is contextually more reliable due to how conservative it is.
Why does the Ichimoku Cloud works? My theory that inspired this indicator is that it works because it looks at 50% retracements from highest point to the lowest point. In other words, Tenkan plots the 50% line between the peak and the trough from the recent period, which has proven to often be a good estimation for retracements. Similarly, Kijun applies the same, but for a longer period*.
However, if we look at Fibonacci retracement, it is often the case that price retracts to those magical percentages: 23.6%, 38.2%, 50%, 61.8%, and sometimes even 88.6% and 78.6%. Why this happens is largely unknown to the academic community, but, empirically, it often seems that these numbers just work.
Therefore, I wanted to apply this principle to Ichimoku calculations, and instead of calculating (high + low)/2, I calculated both (high + low) * 0.382 and (high + low) * 0.618. These lines should provide pessimistic/bearish estimations, and optimistic/bullish estimations, respectively. Naturally, these results in 4 extra lines: a bearish Tenkan/Kijun pair and a bullish Tenkan/Kijun pair.
Therefore, applying this indicator will crowd the chart quite a bit: you have 6 lines on the chart among which 2 of them are the original Tenkan and Kijun lines, and the other 4 are Fib-inspired Tenkan/Kijun lines.
Usage
As with most indicators, usage is subjective to the user and relative to the chart. However, some ways in which this indicator can be used are as follows:
In a strong uptrend, price is typically above both Ichi Kijun and Tenkan. In this case, you can use this indicator to provide you with a new pair of bullish Kijun/Tenkan that provide the same usage as before. Similarly, in a downtrend, the bearish Kijun/Tenkan apply.
Using the new lines, one can apply R/S levels, crossover signals, overbought/oversold areas, price channels, retracement levels, and trend indications.
One may simply use it out of convenience, as it automatically computes potential areas of interest without having to perform manual work.
Please note that because the indicator was so full, I did not keep the Cloud, nor did I keep the Chikou span (Lagging span.) These can be easily implemented, but it would crowd the chart to an extent that it would be difficult to gauge much information. However, I did consider adding them as optional indicators that are disabled by default, and I may potentially do so in the future. For reference, this would help by simply disabling everything else besides the "bullish Ichi" in an uptrend.
Footnotes
* I have heard people referring to Ichimoku Cloud as "a glorified average mean," but, mathematically, I don't believe there is much relationship between MAs and Ichimoku Cloud. However, I acknowledge the visual similarity between the two and the potential to use both in a similar fashion, so one may interpret this indicator as such if they please.

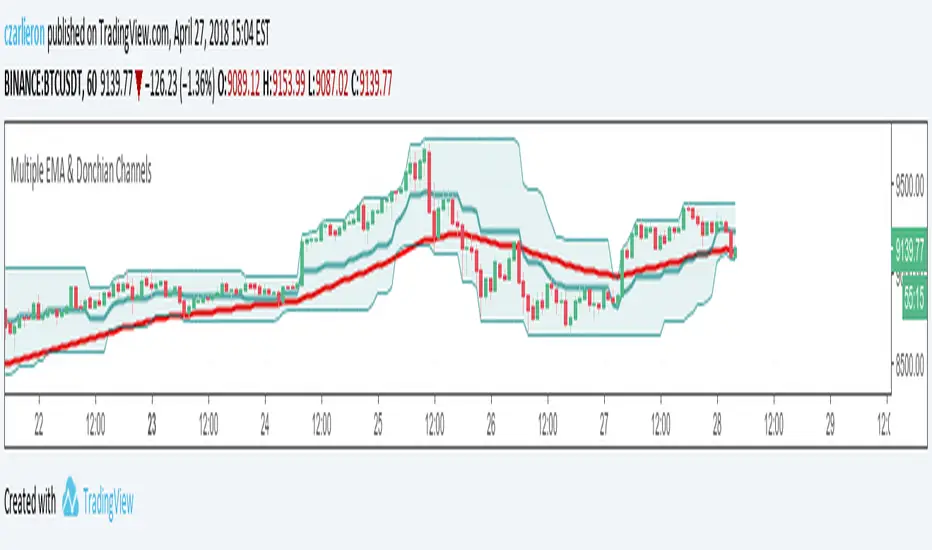
My Multiple EMA with Donchian ChannelsDonchian Channels with EMA's 8, 13, 21, 34, 55, 89 (fib numbers). Everything is configurable.
MG - Fibonacci Alerts - 1.1Updated version of
Allows users to receive alerts when price reach a new Fibonacci level.
By default, the Fibonacci levels extend upwards. This can be changed to extend downwards by unchecking 'Extend Upwards' option.
Usage:
- Perform a Fib extension analysis and determine a high value, low value and direction of extension
- Add indicator and specify these values
- Optionally, to view the levels used by the indicator on the main chart, copy the indicator source and:
- Set overlayed = true
- Set highPrice and lowPrice to your determined values (optional, but will save re-entering them later)
- Add to chart
- This will show you the exact levels used by the indicator
- Set overlayed = false
- Remove and re-add the indicator
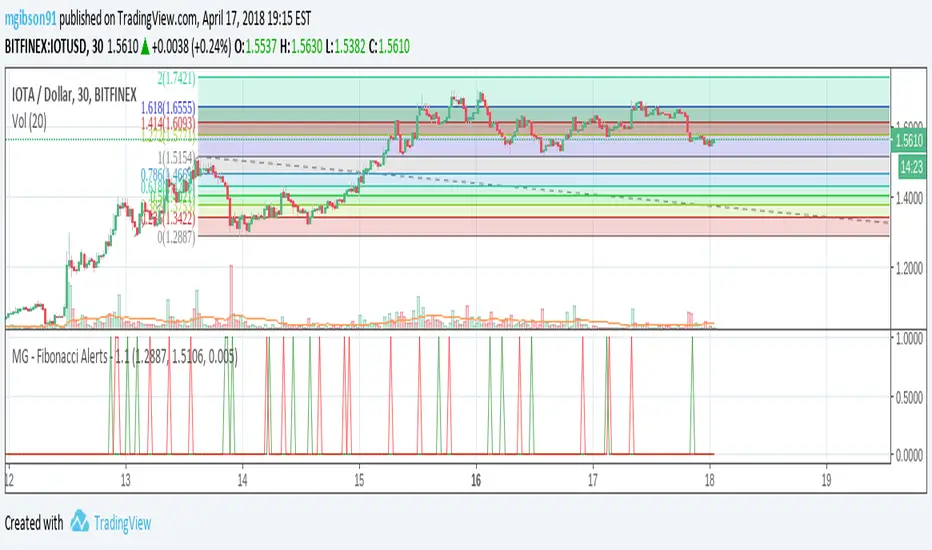
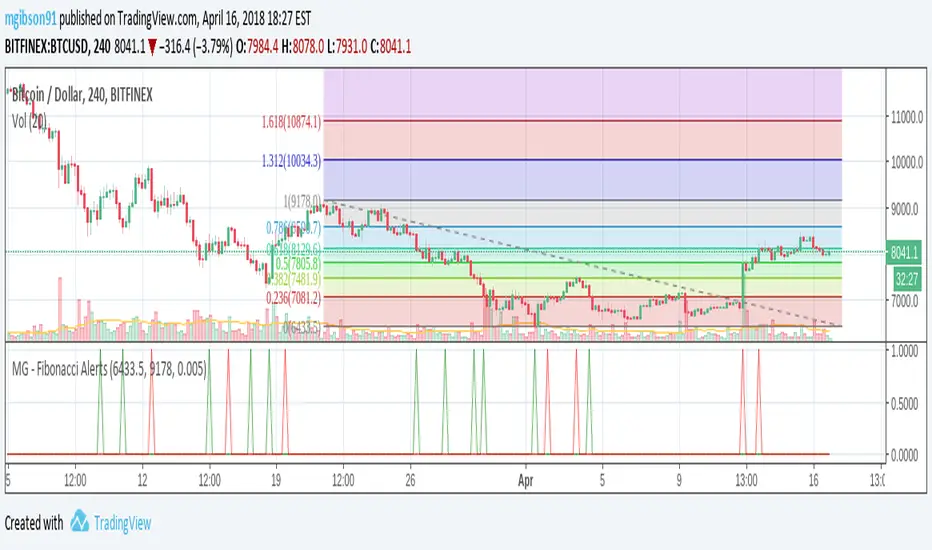
MG - Fibonacci Alerts - 1.0This script allows a user to get alerts when the price goes within a certain percentage threshold of a Fibonacci level.
If connected with AutoView, it could allow an easy way to do automated range trading between Fibonacci levels. Although I plan to do this myself, I haven't used it for this purpose yet so please be cautious and verify with live results beforehand before using it for any automation.
NOTE: The image shown of the indicator is not fully correct as the close price is used. In many cases in the example image, the candle close price DID come within the alert threshold but closed outside the threshold
Usage:
1. User performs a Fibonacci retracement / extension analysis to identify a sensible high and low point. (Currently, this script is geared towards dip pullbacks during a bull market with the ability to toggle rise pullbacks in a bear market in the pipeline)
2. User enters the high and low points into this indicator
3. User can then set alerts on the buy and sell signals which should provide alerts at excellent entry / exit points.
a. Alerts must be created on the buy and sell signal bars. E.g. Buy signal => Alert when 'Buy Signal' crosses up '0.9'
4. Set the alerts to once per bar (not per close). In this indicator, we want to catch things as soon as they happen.
NOTE: Should use in conjunction with another indicator for maximize results.
I personally use this indicator ()
TODO
- Add negative alert levels
- Allow user to specify direction of Fib retracement as the levels are different in bull and bear markets
All feedback is welcome
2 hours ago