Cari skrip untuk "entry"

Double Supertrend Entry with ADX Filter and ATR Exits/EntriesThe Double Supertrend Entry with ADX Filter and ATR Exits/Entries indicator is a custom trading strategy designed to help traders identify potential buy and sell signals in trending markets. This indicator combines the strengths of multiple technical analysis tools, enhancing the effectiveness of the overall strategy.
Key features:
Two Supertrend Indicators - The indicator includes two Supertrend indicators with customizable parameters. These trend-following indicators calculate upper and lower trendlines based on the ATR and price. Buy signals are generated when the price crosses above both trendlines, and sell signals are generated when the price crosses below both trendlines.
ADX Filter - The Average Directional Index (ADX) is used to filter out weak trends and only generate buy/sell signals when the market exhibits a strong trend. The ADX measures the strength of the trend, and a customizable threshold level ensures that trades are only entered during strong trends.
ATR-based Exits and Entries - The indicator uses the Average True Range (ATR) to set profit target and stop-loss levels. ATR is a measure of market volatility, and these levels help traders determine when to exit a trade to secure profit or minimize loss.
Performance Statistics Table - A table is displayed on the chart, recording and showing the total number of winning trades, losing trades, percentage of profitable trades, average profit, and average loss. This information helps traders evaluate the performance of the strategy over time.
The Double Supertrend Entry with ADX Filter and ATR Exits/Entries indicator is a powerful trend-following strategy that can assist traders in making more informed decisions in the financial markets. By combining multiple technical analysis tools and providing performance statistics, this indicator helps traders improve their trading strategy and evaluate its success.

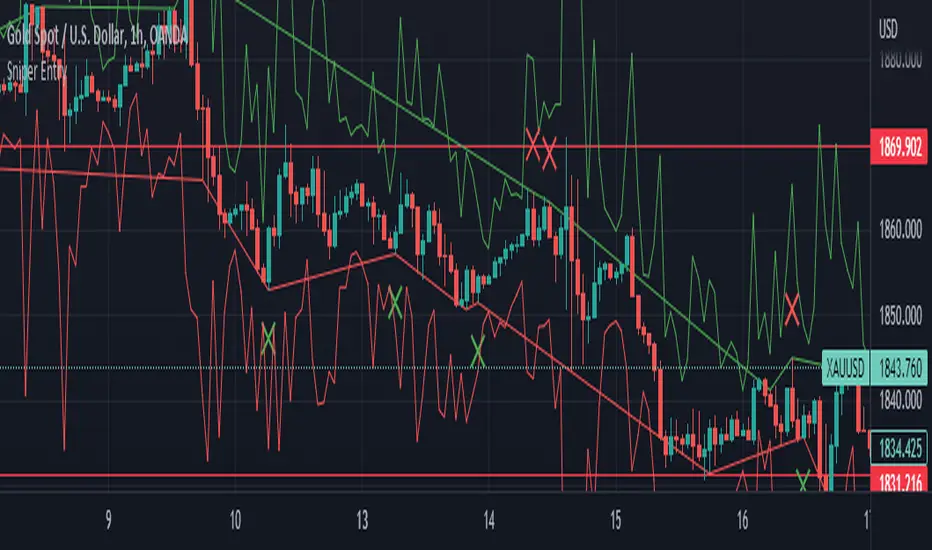
Sniper EntryThis source code is an implementation of a TradingView indicator called "Sniper Entry". The purpose of this indicator is to identify potential entry points for trades based on certain candlestick patterns and the Stochastic oscillator.
The indicator calculates the Stochastic oscillator based on the close, high, and low prices of the asset over a period of 14 bars. It then uses this oscillator to generate buy and sell signals.
For a buy signal to be generated, the Stochastic oscillator must cross above the oversold level of 20, and the current candle must either be a bullish pin bar or a bullish engulfing pattern. For a sell signal to be generated, the Stochastic oscillator must cross below the overbought level of 80, and the current candle must either be a bearish pin bar or a bearish engulfing pattern.
The indicator also calculates the stop loss and target levels for both buy and sell trades. The stop loss is calculated based on the low or high of the candle that generated the signal, depending on whether it's a buy or sell signal. The target is calculated based on the risk/reward ratio, which is set to 3 in this implementation. The lot size is also set to 0.01, and the starting capital is set to 100.
The indicator then plots the buy and sell signals, the stop loss and target levels, and the Stochastic oscillator on the chart.
It's important to note that this is just one example of a trading indicator, and its effectiveness may vary depending on market conditions and the asset being traded. It's also important to perform your own analysis and use proper risk management techniques when making trades based on any indicator or strategy.
VWOP: Volume Weighted & Oscillated PriceWhile playing around with the standard "ta.vwap" I wondered why there was no length input, so I did some research on what the underlying calculation actually is, and did my best to augment it so as to allow for a variable length based on an oscillator value.
Normal VWAP = (Number of Shares Bought x Typical Price) / Total Volume
In my VWOP Calculation, typical price is replaced by selected moving average type or "matype" and then multiplied by the volume.
Then a total value is calculated using math.sum with a length value that changes according to a selected oscillator's value. The total is then divided by
the sum of just volume using the same oscillating length value. Result is then passed through the selected"matype" once more to give the final result.
Indicator designed for use as a entry/exit indicator in conjunction with more traditional moving averages and/or signal filters. Useful for taking volume + an oscillator into account along with price, instead of just the price as with a simple moving average.

OTE optimal trade entry (ICT); visible chart only: Dynamic-simple tool based on ICT free YouTube material of many years.
-Highlights a box showing Optimal Trade Entry (OTE): 61.8% - 78.6% retracement
-Auto shifts depending on Bull or Bear move on chart.
--If visible chart is Bullish (low then high): shows OTE box 61.8-78.6% retracement down from the high
--If visible chart is Bearish (high then low): shows OTE box 61.8-78.6% retracement up from the low
-Thanks the use of PineCoders Visible Chart Library, and some of the example code there

SuperTrend Entry(My goal creating this indicator) : Provide a way to enter the market systematically, automatically create Stop Loss Levels and Take Profit Levels, and provide the position size of each entry based on a fix Percentage of the traders account.
The Underlying Concept :
What is Momentum?
The Momentum shown is derived from a Mathematical Formula, SUPERTREND. When price closes above Supertrend Its bullish Momentum when its below Supertrend its Bearish Momentum. This indicator scans for candle closes on the current chart and when there is a shift in momentum (price closes below or above SUPERTREND) it notifies the trader with a Bar Color change.
Technical Inputs
- If you want to optimize the rate of signals to better fit your trading plan you would change the Factor input and ATR Length input. Increase factor and ATR Length to decrease the frequency of signals and decrease the Factor and ATR Length to increase the frequency of signals.
Quick TIP! : You can Sync all VFX SuperTrend Indicators together! All VFX SuperTrend indicators display unique information but its all derived from that same Momentum Formula. Keep the Factor input and ATR Length the same on other VFX SuperTrend indicators to have them operating on the same data.
Display Inputs
- The indicator has a candle overlay option you can toggle ON or OFF. If toggled ON the candles color will represent the momentum of your current chart ( bullish or bearish Momentum)
your able to change the colors that represent bullish or bearish to your preference
- You can toggle on which shows the exact candle momentum switched sides
your able to change the colors that represent a bullish switch or bearish switch to your preference
- The trader can specify which point you would like your stop loss to reference. (Low and High) Which uses the Low of the Momentum signal as the reference for your Stop Loss during buy signals and the High as the reference during sell signals. Or (Lowest Close and Highest Close) which uses the Lowest Close of the Momentum signal as the reference for your Stop Loss during buys and the Highest Close as the reference during sells.
- The colors that represent your Stop Loses and Take Profits can also be changed
Risk Management Inputs
- Your Risk MANAGMENT section is used to set up how your Stop Loss and Take Profit are calculated
- You have the option to take in account Volatility when calculating your Stop Loss. A adjusted ATR formula is used to achieve this. Increase Stop Loss Multiplier from 0 to widen stops.
- Increase Take Profit Multiplier from 0 to access visual Take Profit Levels based on your Stop Loss. This will be important for traders that Prefer trading using risk rewards. For Example: If the the Take Profit Multiplier is 3 a Take Profit level 3 times the size or your stop loss from your entry will be shown and a price number corresponding to that Take Profit Level becomes available.
- Enter your current Account size, Bet Percentage and Fixed Spread to get your Position Size for each trade
-Toggle on the Current Trade Chart and easily get the size of your Position and the exact price of your Take Profit and Stop Loss.
You can increase the Size of the Current Trade Chart= Tiny, Small, Normal, Large, Huge and change the Position of the Current
trade Chart to your preference, (Top- Right, Center, Left) (Middle- Right, Center, Left) (Bottom- Right, Center, Left).
How it can be used ?
- Enter Trades and always know where your stop is going to be
- Eliminate the need to manual calculate Position Size
- Get a consistent view of the current charts momentum
- Systematical enter trades
- Reduce information overload

Fractal Potential EntryFractal Potential Entry combine 3 ema and fractal and follow the strategy from Trade Pro on YouTube:
www.youtube.com
with good performance on the 1 minute chart
Feature:
Alert Sell and buy Potential Entry
Happy Trading

BB-RSI-ADX Entry PointsThis is a combination of indicators used to find oversold and overbought entry points for possible reversion.
A Green arrow will appear when all condition are met for an ENTER LONG position.
A Red arow will appear when all condition are met for an ENTER SHORT position.
You can modify all of these condition parameters from the indicator's settings.
How does the indicator work
The signals are using Bollinger Bands , BB %B , RSI and ADX indicators to try and find points of reversal
Enter LONG Conditions
Current candle low is below BB lower band.
The BB %B is more than 0.
RSI > 30
ADX > 25
Enter SHORT Conditions
Current candle high is above BB upper band.
The BB %B is less than 1.
RSI < 70
ADX > 25
Those are the default settings that seem to work for me but you can customize all of these from the indicator settings.
I find this strategy to best work on a 3 minute timeframe
Note: The bb %B is calculated for stDev - 1. This will help you see a change happening faster.

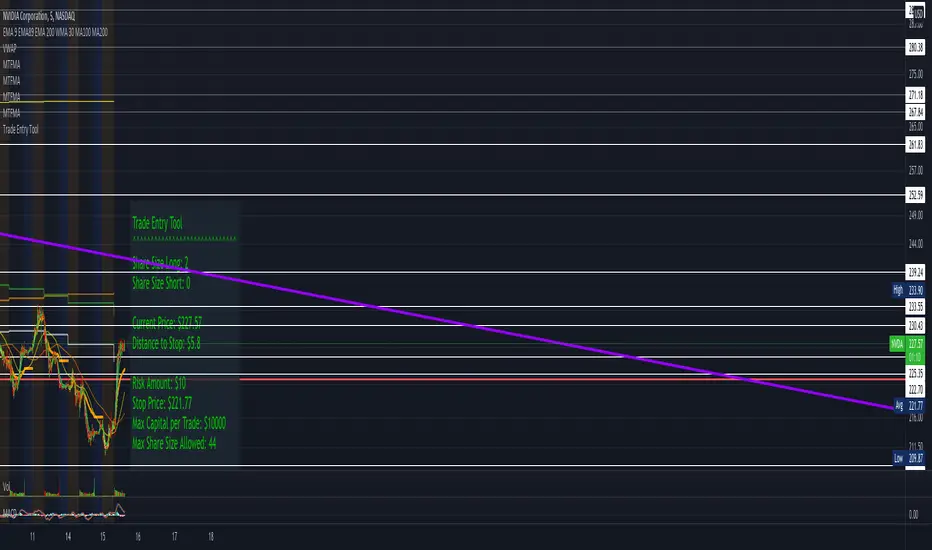
LCDT Trade Entry ToolLCDT Trade Entry Tool
Enter the Offset for the X Axis for the Entry Tool.
Enter the Offset for the Y Axis for the Entry Tool.
Enter the Price for your Stop Loss in $.
Enter your desired Risk Amount in $.
Enter the max amount of of Capital per Trade in $.
There are toggle buttons in the setup to reveal/remove more data in the label that pops up, as well as a toggle to make the text larger.

Bjorgum MTF MAScope:
Up to 3 MA's can be applied at the users discretion
Choose between 10 different average types including favorites from the Bjorgum series from HEMA to Reversal T3's
Each MA can be independently set
Go Multi-timeframe! Any MA can be set to any timeframe of reference you choose (ex. using 3 different timeframes of higher resolution to your chart reference to establish a multi-time frame trend)
RSI HEATMAP. Use the bar color or the MA color selection toggle to set your color to reference RSI on a gradient. This helps to establish clear visual reference to momentum on top of trend analysis
Assigning RSI bar color to an MA of a higher time frame can allow you to see visual reference of momentum of the greater trend that may be at play.
Example: trying to get short on a 15min while your 1hr and 4hr RSI Heatmap burns deep in oversold.
RSI color can be assigned to the bar color, the MA (1,2 or 3), or both. Alternatively, bar color can be assigned to a more simple rising/ falling MA color and price above/ below the MA for bar color.
ALL MTF FUNCTIONS ARE NON_REPAINTING.
The Idea
The original inspiration behind the script came from an observation of a constant struggle of Pinecoders of both youth or experience to find accurate multi-timeframe indicators that do not repaint, and appear as should on historical bars, while performing reliably in real time. I encourage you to scroll the Pinecoders FAQ on a recent piece explaining the difficulties and caveats of different approaches, but I would like to reference the elimination of the historical bar offset for THIS purpose. MA's are based on closing prices, that is to say they are confirmed and will not change once the bar has closed. There is no need to offset these for historical reference. The purpose of the historical offset is best exemplified, for example, with an intraday strategy involving daily breakouts. Let's entertain going long on a break to a new daily high. We would not know that in real time so we need to reference the previous bars close for BACKTESTING purposes, otherwise we get "lookahead bias". There is no shortage of strategies unintentionally employing this bias out there (I'm sure you have come across them with their unrealistic results).
There is no worry of repainting with the MTF security function included within this script, nor will it offset for something involving lookahead bias. I encourage those that are playing with the code or perhaps writing strategies of their own to borrow the functions within. There is also a function that will return the 10 MA variable selection - yours to keep.
With all that in mind, I wanted a practical script that is easily deployable in everyday trading for the average trader that gives the user a firm grip on their trading steering wheel equipped with the feel of the road. Incorporating several MA's of differing times with the RSI heatmap gives a good visual reference and feel to your trading environment, while offering a level of customization that will fit an individuals personal trading style. The RSI heatmap gradient is per percentage between 30 and 70 and your 2 colors - anything outside of those levels gives you the vibrant bias color
Below I walk through 2 examples of live trades scenarios I made using the mindset the script offers.
The Trade
LONG IZEA
Timeframe: 4hr chart
- 3 Tilson MA's of varying length are deployed at varying intraday time frames
- A bullish pattern in an uptrend offers a possible trade allowing entry from a low risk point from the pattern low
- See the chart for notes and observations using the script
- Notice how the heatmap brightens up as price extends far away from the averages - your risk has elevated for a new position
- Notice the heatmap cool off while price action consolidates sideways
The Trade
SHORT BTCUSDT
Timeframe: 4hr chart
- 3 EMAs are employed - same length (50), with 3 successive timeframe resolutions
- A downtrend is formed with a sharp move to stack the EMAs into layers
- A pull back opportunity presents itself in bearish consolidation
- Notice a Doji star at resistance establishing a swing high as RSI cools off into the EMA dynamic resistance for entry
- An '"equal legs" measured move can be used for a trade target with a stop out above the swing high.
- Again, take note of distance from EMA's, the heatmap in combination with trend development surrounding the MA's
These were just two ideas to show you an example of how to implement some strategy into your trading and to get some interesting use from the indicator. Hope you enjoyed the read and happy trading.

Stochastic RVIBased on the Stochastic RSI but uses RVI (Relative Volatility Index) as source. Another great tool for finding market lows and entry points. This oscillator is also good for finding accurate diversions.

Reflex - A new Ehlers indicatorSource: Stocks and Commodities V38
Hooray! A new John Ehlers indicator!
John claims this indicator is lag-less and uses the SPY on the Daily as an example.
He states that drawing a line from peak to peak (or trough to trough) will correspond perfectly with the Asset.
I have to say I agree! There is typically one bar of lag or no lag at all!
I believe this indicator can be used for either entries or exits, but not both.
Entry
1. Entering Long positions at the pivot low points (Stocks and ETFs)
2. Entering Long when the Reflex crosses above the zero lines (Stocks, ETFs, Commodities)
Exit
1. Exiting Long positions at a new pivot high point (Stocks and ETFs)
2. Exiting Long when the Reflex crosses below the zero lines (Stocks, ETFs, Commodities)
In this example, I place a Long order on the SPY every time the Reflex crosses above the zero level and exit when it crosses below or pops my stop loss, set at 1.5 * Daily ATR.
4/6 Wins
+10.76%
For me, that's good enough to create a strategy and backtest on several Indices and ETFs, which is what I have a hunch this will work on.
I think there is a lot of promise from a single Indicator!
Let me know in the comment section if you're able to use this in a strategy.

FauxLife EFIModification to Elder's Force Index (EFI)
Ability to change calculation from standard EMA to your choice of SMA, EMA, WMA, or HMA. Very interesting results!
Adjust lookback from standard/suggested 13 candlesticks
Added a color indication to positive or negative force reading
Added background color tint for an easier read on dashboard setups
Suggested pair with my On Balance Volume with Cross to use as a filter & entry/exit setup. Enter or exit trades when the two indicators switch at the same time or within 1-2 candlesticks of each other.

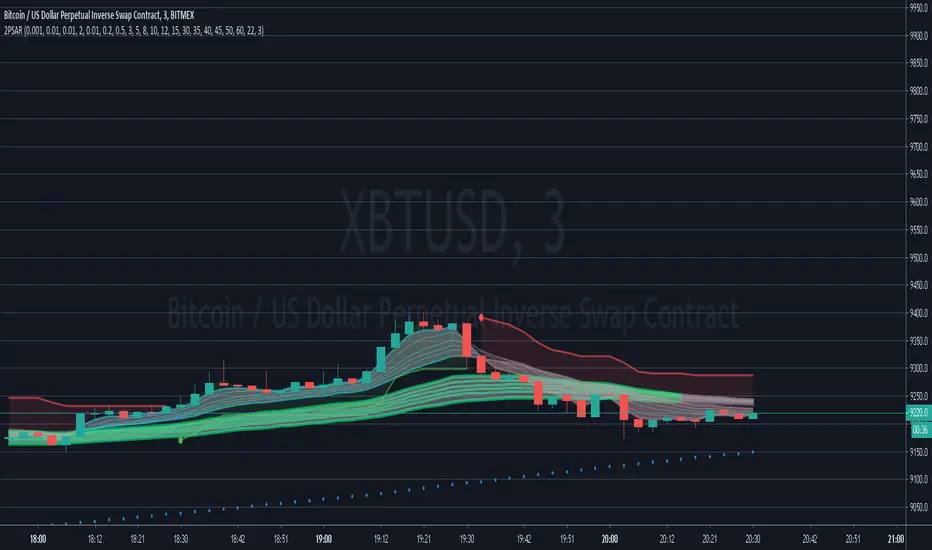
IMPULSE_2PSAR_ST_CMGEmasCurrently under Development.
Designed to easily get the trend using both SuperTrend and CM Guppy Emas, and using 2 PSARs for entry and trend change alert.
intended to trade scalping and options
CryptoJJ - SSL indicatorThe SSL indicator with colour change. Tool for spotting trends and finding good entry points. I recommend using it for higher timeframes, from 4h to 1D.
Play with the settings, you can change the moving avarage type, its length, if you prefer having the default
bar colours in your chart, disable the colouring function in the script.
Good luck crypto traders!
CryptoJJ

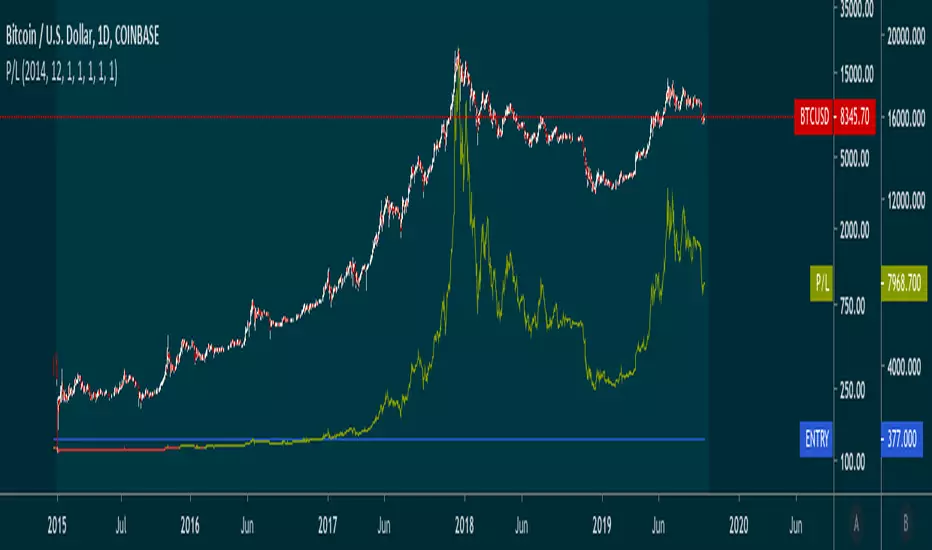
SOLARIZED PRICE ENTRY P/LYou can enter in a date, time and quantity of entry and track a P/L on the trade.
Momentum and Trend Strength Entry Exit Pivot StudyUpdated version of previous Momentum Strength Entry Exit Pivot Study:
//************************
// @TheGeeBee - Credit where used
//
//Notes:
//
// Use 1,2,3,5 minute timeframes
// EMA Cross line and offset allows user to alter the sell characteristics where the candle low is above the EMA line and indicates a possible pre-pivot reversal
// Adjust Min and Max pivots based on risk profile
// Single Candle drawdown value represents the maximum size of a single red candle before an Exit Pivot is generated
// ADX Threshold inhibits Pivots when trending signal is below the threshold value
// Percentage Max drawdown since Entry Pivot allows the system to generate an Exit Pivot if the security has dropped X percent from the most recent Entry Pivot point
// Use Bars, Candles (preferred) or Heikin-Ashi
// Multiple Green Bars = BTFD
// Multiple Red bars = If you didn't already get out, do it now!
//
//************************
Allows for Alerts to be set for Entry and Exit Pivots.
LINEdicator - Trendanalysis toolThis indicator creates an trend channel based on an EMA/SMA combo and a Parabolc SAR indicator.
Watch for the peaks and the size of the red/green channel for possible trend change.
Can also be used as an Entry/Exit/Stop-Loss setting tool.

LongSetups with Entry Signals and Trailing Stop(HA)High probable Long Setups for any time frame and asset.
75+ win rate
Trailing stop always used as exit point
To trade only with the trand - enable MAs in the Inputs tab
x - means Entry signal is active and waiting for long validation
B - on a closed bar is entry signal for long
C - on a developing bar is exit long signal
Green line - long validation line. must close above to go long
Pink line - trailing stop
On Long Entry alert - use Once Per Bar Close option.
On Long Exit alert (Trailing stop triggered) - use Once Per Bar option to trigger sooner and protect your capital.
Always do your own analysis and make trades on your own risk. Find a confluence point where everything aligns and make your own decision. Don't enter a trade because the indicator tells you so. You are free to make a copy of the script and change it to your own needs for your own personal use.
RSI/MFI - MTF - Entry signals/Trend colored bars - JD@version=2
This indicator is designed to give early entry signals as well as to follow trend moves, according to different settings.
The indicator shows a histogram of the RSI ro MFI in relation to an ema of the RSI or MFI.
The histogram is then smoothed to give early reversal/entry signals.
The actual RSI/MFI line with oversold/overbought indication can be displayed or omitted, as preferred.
in addition to the RSI/MFI line or as an alternative to it, the background colour can be set to change folowing the RSI/MFI signals.
The timeframe can be chosen. Higher timeframes (eg. 3h) tend to give less false signals.
version 5.
added support for custom Multiple Time Frame selection.
added option for choice of RSI or MFI as base indicator.
added option for price bar coloring according to the indicator. (deselecting "borders" in the "style" tab is recommended)
price bar coloring can be adjusted for different strategies:
1. following the slope of the histogram (for faster entry/exit signals)
2. according to positive or negative histogram (for longer moves)
3. according to pos. or neg. RSI/MFI (for longer term trend holds)
4. uptrend: biased towards faster buy signals and slower sell signals to stay in the uptrend
5. downtrend: biased towards faster sell signals and slower buy signals to stay in the downtrend
A longer timeframe (eg. 3x) is recommended for following trend moves.
try different strategies to see what works better for RSI or MFI.
JD.

Revolution Entry IndicatorSimple entry indicator where the entry is decided by the relative strength of each individual candle.

RSI-MTF-Histo-EntryThis indicator gives a histogram of RSI in relation to an ema of the RSI.
The histogram is then smoothed to reduce false signals.
The actualiteit RSI line with overbought/overvols signals can be added or omitted as preferred.
The background can be color coded if the RSI is above or below 50.
Version 2. Added support for MTF. Longer timesframes (1h-3h) tend to give better entry results.
As an example the indicator was added two times, one for the current timeframe and one for a longer timeframe.
