Boom Hunter XBoom Hunter X is built to target breakouts and explosive moves. The strength of this indicator is in slower timeframes like daily, weekly and monthly but it also works great on 4 hour timeframes. It is a modified version of Boom Hunter XL designed to be simple and easy to use. There are minimal settings available, aside from being able to choose the length of the oscillator there are 3 presets available. Preset 1 is the fastest and is great for targeting entries. Preset 3 is the slowest and is perfect for highlighting trends and setting up big moves. Preset 2 is somewhere in the middle and works great for entries and trend. To get a full picture of price action it is recommended to use all three indicators on your chart. The indicator will automatically adjust lengths when using weekly and monthly charts. If using faster timeframes try adjust the length to 6 or 9.
To get best results use Preset 3 to identify the trend of price action. When Preset 3 is in teal look for long entries on Presets 1 and 2. Likewise, when in red look for shorts. The best entries come from the first pullbacks. Below is an example of entering with the trend.
Using slow charts like weekly and monthly makes it easy to see what is happening with the markets. Below is an example of how easy it is to stay ahead of the curve and identify booms.
First pullbacks are signalled with outlined triangles: ▵▿
These signals are only available on preset 2 and 3. First pullbacks are picked up after price action breaks its median or dynamic median also known as OSC3 (OSC3 is hidden and works in the background), The strongest long pullbacks are when the oscillator is above the median and in the teal. Likewise the strongest short entries are when the oscillator is below the median and in the red. First pullback signals often signal the start of a new trend. Below is an example on a daily chart.
Breaks in support and resistance are signalled with white arrows: ˰˅
Preset 3 highlights the biggest breakouts while preset 1 will show the breaks within the breaks. Preset 2 provides a nice blend between the both and works great for targeting breakouts. It is not recommended to enter on the break as price action will come back to test. The first pullback after the break is typically the best and safest entry for breakouts. Below is an example of the break signal using preset 2 on weekly chart.
Breakout entries are signalled with teal and red triangles. Breakout signals filter price action for safe confirmed pullback entries. The slower the timeframe the bigger the breakout. Presets 2 and 3 are best for finding these entries.
Booms are signalled with this explosive icon: 💥
Simply put booms are polarity flips within the ticker signal. They are fast and explosive moves that can be detected using several different methods. Some of these boom signals are picked up using pure chart mechanics while others use filtering and signal processing to pinpoint the exact moment before an explosion. To make big moves the charts have to set it up first. Below is an example on a daily chart.
Boom Hunter X comes with the following alerts:
Overbought - Reversal attempt
Oversold - Reversal attempt
Long First Pullback - Only available on Preset 2 and 3
Short First Pullback - Only available on Preset 2 and 3
Pivot Up - Oscillator crosses over trigger
Pivot Down - Oscillator crosses under trigger
Long Breakout - Entry point for breakout
Short Breakout - Entry point for breakout
Break Support - Price action breaks its support
Break Resistance - Price action breaks its resistance
Boom! - Alerts for all the booms
Crossing Over Median - Price action enters top half of channel
Crossing Under Median - Price action enters bottom half of channel
Cari skrip untuk "breakout"

PriceCatch BOSS IOHi TradingView Community.
I am publishing a script that uses a proprietary logic based on Fibonacci retracement for identifying breakouts. This is a script that focuses on long side trades only.
PriceCatch BOSS IO: - PriceCatch Breakout Screener Script (Invite Only).
This script is not an indicator that plots anything on the chart but is a Screener.
SLIPPED OPPORTUNITIES
One of the problems faced by traders is that while they are watching or studying the chart of one stock or Forex pair, a super opportunity slips by them in another stock or another instrument and it is frustrating when that happens. With the PriceCatch BOSS IO script, you can now capture such moves made by other symbols whilst you are watching some other instrument.
USP:
The uniqueness of this script is that you can screen Nine of your favorite symbols for breakout opportunities simultaneously.
Users can pick Nine symbols of their choice and specify a resolution in the Settings dialog screen that the script will use to find out any probable breakouts in those selected nine symbols continuously.
The symbols could be from any exchange across the world and of any type - stocks, futures, commodities, Forex and Crypto. Simply put, if you can plot the symbol in TradingView, PriceCatch BOSS can monitor that instrument for breakouts on the time interval chosen by you.
ACTIONABLE INFORMATION:
What traders look for and expect from their charts is actionable information. This script does that. It clearly tells you the Entry Price and Stop Loss price for each symbol when a breakout opportunity presents itself in that symbol. You can then open up the chart of that specific symbol to validate the given information with any other indicators that you use and then take the call with regards to a trade. You may also use this script alone without adding any other indicator to your chart. The choice is yours.
CLARITY BEFORE TRADE:
As both Entry Price and Stop Loss Price are identified by the script, you receive advance information about the risk and can set your own Reward based on your personal preferences. So, with the necessary information provided to you in advance, you can plan your trades with clarity.
HOW IT WORKS:
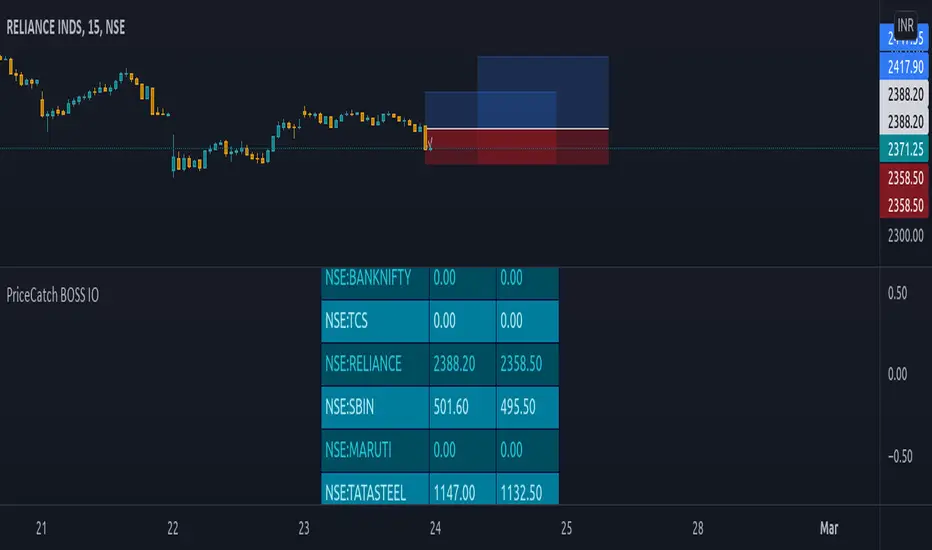
Once the list of symbols are selected and resolution chosen, the script then continuously monitors those given symbols for breakout opportunities. At the close of every interval, it presents the results as shown below:
Results Set
This script shows the results of the screening in a Table as under:
SYMBOL Entry Price Stop Price
TSLA 830.84 802.88
EURUSD 1.13425 1.13160
Similarly for seven more instruments chosen by you.
NOTE: 0.00 under Entry and Stop price columns mean that there is no opportunity in that symbol.
ADVANTAGE:
The advantage of this script is that it helps you spot trades in your favorite symbols without manually loading their charts. With the ability to screen the symbols from Intraday time frames to higher time frames such as Weekly, you will be able to spot opportunities to go long in intraday, swing and even positional trades of longer duration.
Another significant advantage of this script is that while you may be watching a symbol in, say 15 minutes time frame, you can set the script to monitor breakouts in any other higher time frame starting from 15 minutes. This, in effect, gives you unsurpassed advantage.
DISCIPLINE:
As you choose your nine instruments/assets, the script indirectly inculcates discipline as your attention will be only on the selected instruments and you will not be distracted or search for opportunities in a whole bunch of other symbols / assets / instruments. As you can at any time change the set of nine assets as per your personal preference, you get the flexibility that you seek to work with a different set of symbols. For Forex traders who like to monitor only Major Pairs the ability to scan Nine pairs is quite sufficient. Similarly, to traders who trade S&P500, ES1! and other instruments, the nine symbols flexibility is adequate.
LONG POSITION TOOL
For visual cues, you may use the Long Position tool to set the Entry, Stop and Targets as per your preference on the main chart.
TRICK:
Can I only screen nine instruments? What if I am interested to screen more? Actually, you can screen more instruments. You see, you can add this script on to your chart multiple times and can select a set of nine unique stocks per script instance. That way you can actually screen more than nine stocks!
EXAMPLES:
Nifty 50
TSLA
Maruti
USDJPY
MSFT
UI
The script allows you to fine tune display options as per your personal preferences.
NOTE: This script runs in a separate pane without obstructing the view of your main chart.
NOTE: The formatting of price is based on mintick. As a result, since Forex and Crypto have more number of digits after the Decimal, if your screener list consists of a mix of stocks, Forex and Crypto - please change to a Forex chart to get the correct Forex price and to Crypto for correct Crypto price and so on.
NOTE: You will not get accurate results if you are in a higher time frame chart and the Screener resolution is set to lower time frame. For example, if chart is in 15 MTF and Screener resolution is set to 3 MTF, the results may not be accurate.
TIP: If you have added this script multiple times to your chart, then you may have to maximize the pane to view the results table.
NOTE - PRIOR TO USING THIS SCRIPT:
Please remember that the script is shared with absolutely no assurances about usability and any warranties whatsoever and as a responsible trader, please satisfy yourselves thoroughly and use it only if you are convinced it works for you. Remember, you are 100% responsible for your actions and must, therefore, do your due diligence before using this script and also before every trade. Profits and losses are part and parcel of trading activity and you are solely responsible for both. If you understand and accept that, you may use the script.
QUERIES/FEEDBACK
Please PM me.
Hope you find this script useful. Wish everyone all the best with trading.
Sentinel 5 — OHL daybreak signals [KedArc Quant]Overview
Sentinel 5 plots the first-bar high/low of each trading session and gives clean, rules-based signals in two ways:
1) OHL Setups at the close of the first bar (Open equals/near High for potential short; Open equals/near Low for potential long).
2) Breakout Signals later in the session when price breaks the first-bar High/Low, with optional body/penetration filters.
Basic workflow
1. Wait for the first session bar to finish.
*If O≈H (optionally by proximity) → short setup. •
*If O≈L → long setup. • If neither happens, optionally allow later breakouts.
2. Optional: Act only on breakouts that penetrate a minimum % of that bar’s range/body.
3. Skip the day automatically if the first bar is abnormally large (marubozu-like / extreme ATR / outsized vs yesterday).
Signals & Markers
Markers on the chart:
▲ O=L (exact) / O near L (proximity) – long setup at first-bar close.
▼ O=H (exact) / O near H (proximity) – short setup at first-bar close.
▲ Breakout Long – later bar breaks above first-bar High meeting your penetration rule.
▼ Breakout Short – later bar breaks below first-bar Low meeting your penetration rule.

Rapid Killzone BreakoutFinal Indicator Title: Rapid Killzone Break & HTF Levels
Overview
Welcome to the Rapid Killzone Break & HTF Levels, an all-in-one trading toolkit designed for precision and context. This indicator was built to solve a common problem for day traders: how to combine a precise, lower-timeframe (LTF) entry model with the essential context of higher-timeframe (HTF) levels.
This tool is founded on a session-based breakout strategy, leveraging the volatility and liquidity generated during specific market hours (the "Killzones"). It then layers critical HTF support and resistance levels onto your chart, allowing you to make more informed trading decisions without ever needing to switch timeframes.
Whether you trade Forex, Gold, or major Indices, this indicator provides a comprehensive framework for identifying high-probability breakout opportunities.
The Core Strategy
The methodology is a powerful three-step process based on session liquidity and qualified breakouts:
The Killzone Range: The indicator first identifies the high and low established during a specific, high-volatility trading session (e.g., the first hour of London or New York). This range acts as a pool of liquidity. The core idea is that the market will often seek to "sweep" or run the liquidity resting above the session high or below the session low.
The Qualified Breakout: This is not just any breakout strategy. A valid entry signal only appears when price closes decisively outside the Killzone range with significant momentum. To ensure the quality of the signal, the breakout must meet several user-defined criteria:
The Killzone must have a minimum pip range.
The breakout candle must have a strong body-to-wick ratio.
The breakout must be accompanied by a spike in volume.
Higher Timeframe Confluence: A breakout is more likely to succeed if it aligns with the HTF narrative. This indicator plots the previous higher-timeframe candle's high and low directly onto your chart. These levels act as powerful magnets for price or as formidable support/resistance zones. A breakout on the LTF that targets the HTF previous high is a much higher-probability setup than one trading directly into it.
Key Features
📊 DST-Aware Killzones: Automatically adjusting session boxes for London and New York. The timezones are fully configurable (e.g., Europe/London, America/New_York) and automatically handle Daylight Saving Time changes so you never have to manually adjust them.
📈 Killzone Pivots: Automatically draws the High, Low, and a dotted Midpoint from each Killzone session, acting as key intraday levels.
🏛️ Higher Timeframe (HTF) Levels: Plots the previous HTF candle's High and Low as dashed lines on your chart, providing critical context for support, resistance, and targets.
🕯️ HTF Mini-Candles: Displays a visual summary of the last three HTF candles on the right side of your chart, so you can see the HTF trend at a glance.
⏰ Custom Vertical Timestamps: Up to three configurable vertical lines with labels to mark key events like other session opens (e.g., "Sydney Open").
🎛️ Advanced Breakout Filters: Fine-tune your signals with filters for minimum Killzone range, minimum candle body percentage, and volume spikes. (Important: The volume filter requires a data feed that provides real volume, such as OANDA, FXCM, or futures/stock data).
✅ Dynamic Entry Advice Table: After a signal, a table provides a suggested entry technique (e.g., "50% retrace to signal candle") based on how far price has moved from the breakout level.
📋 Killzone Range Stats Table: A clean table shows the current and average pip range for both the London and New York sessions, helping you gauge current volatility.
🛠️ Fully Customizable: Nearly every visual element can be toggled on/off or have its color and style changed to suit your personal chart theme.
How to Use This Indicator
This tool is designed to provide a clear, step-by-step workflow for your trading sessions.
Setup: In the settings, choose your desired Reference Timeframe (e.g., 240 for 4-Hour). Configure your Killzone session times and colors.
Context is King: Before the session begins, take note of where price is in relation to the dashed HTF High/Low lines. Is price consolidating below the previous HTF low? A breakout might target it. Is price approaching the HTF high? This could be a take-profit area or a point of resistance.
Wait for the Range: Allow the London or New York Killzone (the colored box) to form completely.
Anticipate the Breakout: Once the session box is closed, the indicator is now hunting for a valid breakout.
Validate the Signal: When a "Long" or "Short" label appears, this is your entry signal. Check the Info-Box data (RSI, volume, candle body %) to confirm the strength of the move.
Manage the Trade: Use the Killzone pivots and the HTF High/Low lines as potential areas to manage your trade, take partial profits, or identify a final target. Check the Entry Advice table for ideas on refined entries if you miss the initial move.
Applicable Markets
This strategy is most effective on instruments known for their session-based volatility. It has been tested and works exceptionally well on:
Forex Majors: EUR/USD, GBP/USD, etc.
Gold: XAU/USD
Indices: NASDAQ 100 (NQ100), S&P 500 (SPX500)
It is best used on lower timeframes (such as the 5-minute or 15-minute chart) for trade execution.

Pivot Breakouts with MA FilterPivot Breakouts with MA Filter
This script identifies pivot breakouts (both bullish and bearish) using support and resistance levels and overlays breakout labels, arrows, and customizable Moving Averages. It allows traders to fine-tune their analysis with multiple options to customize the display and behavior of the breakout signals.
Key Features:
Pivot Support and Resistance:
Support is defined by the lowest low in a given range (using the lookback period).
Resistance is defined by the highest high in a given range (using the lookback period).
The script draws support and resistance boxes on the chart when these levels change, providing clear visual markers for potential breakout areas.
Breakout Detection:
Bullish Breakout: A breakout above resistance and the price is above the selected moving average (MA).
Bearish Breakout: A breakdown below support and the price is below the selected MA.
Breakout events trigger labels indicating "Resistance Breakout" (for bullish) and "Support Breakout" (for bearish).
The option to show Breakout Labels (with customizable colors) is available in the settings.
Moving Average Filter:
You can select the type of moving average (SMA or EMA) to use for filtering breakout signals.
MA Filter Length: This input allows you to set the period of the moving average to act as a filter for breakout conditions. This helps ensure the breakout aligns with the broader trend.
Multiple Moving Averages (Optional):
You can add up to four different moving averages (SMA or EMA), each with its own length and color.
You have the option to toggle each moving average on or off and adjust their appearance settings (color and length).
The script supports dynamic plots for each moving average, helping to visualize multiple trends at once.
Breakout Arrows:
The script can display arrows (or other shapes) below the bar for bullish breakouts and above the bar for bearish breakouts.
Arrows are optional and can be turned on/off in the settings.
You can customize the shape of the arrows (e.g., arrow, circle, square, or even a large or small triangle).
Customizable Colors and Labels:
The color of the breakout labels and arrows can be customized in the settings to make them fit your chart's style and personal preferences.
Alerts:
Alerts can be set for new support and resistance levels, as well as when breakouts occur (either bullish or bearish).
The alert system helps to notify traders when significant price action takes place without needing to constantly monitor the chart.
Settings:
Select Moving Average Type (SMA or EMA)
MA Filter Length: Length of the moving average used for filtering breakout conditions.
Lookback Range: Determines the range over which the pivot points (support and resistance) are calculated.
Breakout Labels: Option to turn on/off breakout labels, and customize label colors.
Show Breakout Arrows: Enable or disable breakout arrows with shape options (arrow, circle, square, large triangle, small triangle).
Multiple Moving Averages: Option to show up to 4 MAs with customizable colors and lengths.

Head and Shoulders PatternHello Traders!
The Head and Shoulders Pattern indicator utilizes a unique swing-based pattern recognition to pinpoint head and shoulders patterns in real-time with unparalleled precision.
The head and shoulders chart pattern is a technical analysis pattern used to identify potential trend reversals in financial markets. It consists of three swing highs (peaks), with the middle peak being the highest and the two outside swing highs being slightly lower. The middle peak is referred to as the "head" and the two outside peaks are referred to as the "shoulders."
The pattern typically forms after an uptrend and is in most cases a bearish signal. The neckline is a support level that connects the lows of the two shoulders. Once the price breaks below the neckline, the pattern is confirmed, and a new down trend starts. Conversely, an "inverse head and shoulders" pattern forms after a downtrend and is a bullish signal.
Feature List
Real-time pattern detection
Visualization of entry, stop-loss and take-profit levels
Pattern performance statistics
Calculation of risk-rewards ratio
Risk Management
Breakout alerts
Customizable pattern size and accuracy
Customizable look and feel
The value of this indicator is to support traders to easily identify the Head and Shoulders pattern in an automated way. The special swing-based pattern recognition and the numerous built-in premium features make this indicator unique. The trader saves a lot of time scanning the markets for head and shoulders patterns, since everything is done automatically for the trader: Finding the pattern, looking and alerting for a breakout, computing the entry, stop loss and take profit levels as well as handling the risk management and computing the optimal order quantity.
How to Trade with the TRN Head and Shoulders Indicator
Identify the Pattern
Add the Head and Shoulders Pattern Indicator to your chart and look for the pattern on the asset and timeframe of your choice. The pattern is detected in real-time. If the pattern develops further in the next bars, then the indicator updates the pattern accordingly until a breakout is confirmed or the pattern becomes invalid.
You can also use the built-in alerts to easily get notified when a pattern occurs. In the indicator settings in the "Alerts" section you can choose whether you want to get notified when a pattern is
1. in the making (Pattern active),
2. confirms an up breakout (B/O Up Confirmed)
3. confirms a down breakout (B/O Down Confirmed)
4. (Unconfirmed) in case a pattern breakout occurs, even if the pattern is not yet confirmed
This allows you to stay informed about potential breakout opportunities that are still awaiting confirmation.
Check Pattern Statistics
The pattern statistics make it easy for you to see how successful a pattern is on the asset and timeframe you are watching. You should always check the statistics before entering a trade. The chart displays the statistics in the upper right corner. These statistics are categorized into two sections: "long" for inverse head and shoulders patterns and "short" for head and shoulders patterns.
In the initial columns, labeled as "short" and "long", the identified breakouts are further divided based on whether the risk-reward ratio (R) is below a specified value (< x) or equal to/greater than the specified value (>= x). The following columns represent the count of the events:
1. Occ. (Occurrence) categorized according to the values of R from the first column
2. TP1, TP2, TP3 (Take Profit) - targets 1, 2 and 3
3. SL (Stop Loss)
4. T/O (Time Out) - neither stop loss or targets where hit in a certain amount of time
Breakout – Entry, Stop Loss and Targets
The indicator automatically displays the entry price line (EP) in grey at the point where the price breaks through the neckline, indicating a breakout. Once a breakout has been confirmed, place a buy order near the EP level for a long position, or a sell order for a short position. Set your stop-loss at the price level of the red stop-loss line (SL) and set your take-profits at the price level of the green take-profit-lines (TP1, TP2, TP3).
Risk Management
The Head and Shoulders Pattern Indicator comes with a built-in risk management feature. Just go to the settings and scroll down to the section "Risk Management". Here you can enter your Account Size and the percentage you want to Risk when you enter a position after a pattern breakout.
In the "Trade Management" section, you have the option to define the minimum accepted risk-reward ratio for confirmed rectangles. This means that breakouts of patterns failing to meet the minimum risk-reward ratio will not be considered as confirmed signals. If a breakout gets confirmed, the indicator automatically calculates the position size (Quantity). You can read the quantity from the gray entry point line (EP), which is located to the right of the risk-reward ratio (R). Note that your risk-reward ratio (R) is calculated based on TP1.
Customization and Settings
The indicator can scan for smaller and larger patterns at the same time. Adjust the Head and Shoulders Sizes in the indicator settings to align them with your preferences. A larger size results in larger patterns. Depending on the asset class, the market or the market phase, different sizes should be used for the Head and Shoulders pattern detection.
To detect more patterns, increase the tolerance level, even though it may result in lower accuracy. However, be mindful that a higher tolerance level may result in more patterns hitting their stop-loss. Look for a tolerance level that leads to favorable statistics and focus on trading patterns with a proven performance history.
Finally, you have the flexibility to customize various visual elements, such as the color of the pattern and whether to display values like price, target, or risk-reward ratio on your chart. You can also choose where these values appear.
Computation Details
The real-time detection of the Head and Shoulders Pattern Indicator utilizes a unique swing-based pattern recognition. The difference to other swing-based computations is that the pivot points are identified without a look-ahead value. The result is a faster and better real-time detection. Furthermore, the detection of the ratios between the single swings is based on a dynamic volatility measurement similar to the ATR. The tolerance level unites several internal parameters into one and results in a user-friendly setting.
Risk Disclaimer
The content, tools, scripts, articles, and educational resources offered by TRN Trading are intended solely for informational and educational purposes. Remember, past performance does not ensure future outcomes.

ORB Heikin Ashi SPY 5min Correlation StrategyOverview:
The ORB (Opening Range Breakout) strategy combined with Heikin Ashi candles and Relative Volume (RVOL) indicator aims to capitalize on significant price movements that occur shortly after the market opens. This strategy identifies breakouts above or below the opening range, using Heikin Ashi candles for smoother price visualization and RVOL to gauge the strength of the breakout.
Components:
Opening Range Breakout (ORB): The strategy starts by defining the opening range, typically the first few minutes of the trading session. It then identifies breakouts above the high or below the low of this range as potential entry points.
Heikin Ashi Candles: Heikin Ashi candles are used to provide a smoother representation of price movements compared to traditional candlesticks. By averaging open, close, high, and low prices of the previous candle, Heikin Ashi candles reduce noise and highlight trends more effectively.
Relative Volume (RVOL): RVOL compares the current volume of a stock to its average volume over a specified period. It helps traders identify abnormal trading activity, which can signal potential price movements.
Candle for correlation : In this case we are using SPY candles. It can also use different asset
Strategy Execution:
Initialization: The strategy initializes by setting up variables and parameters, including the ORB period, session timings, and Heikin Ashi candle settings.
ORB Calculation: It calculates the opening range by identifying the high and low prices during the specified session time. These values serve as the initial reference points for potential breakouts. For this we are looking for the first 30 min of the US opening session.
After that we are going to use the next 2 hours to check for breakout opportunities.
Heikin Ashi Transformation: Optionally, the strategy transforms traditional candlestick data into Heikin Ashi format for smoother visualization and trend identification.
Breakout Identification: It continuously monitors price movements within the session and checks if the current high breaches the ORB high or if the current low breaches the ORB low. These events trigger potential long or short entry signals, respectively.
RVOL Analysis: Simultaneously, the strategy evaluates the relative volume of the asset to gauge the strength of the breakout. A surge in volume accompanying the breakout confirms the validity of the signal. In this case we are looking for at least a 1 value of the division between currentVolume and pastVolume
Entry and Exit Conditions: When a breakout occurs and is confirmed by RVOL and is within our session time, the strategy enters a long or short position accordingly. It does not have a stop loss or a takie profit level, instead it will always exit at the end of the trading session, 5 minutes before
Position Sizing and Commissions: For the purpose of this backtest, the strategy allocated 10% of the capital for each trade and assumes a trading commission of 0.01$ per share ( twice the IBKR broker values)
Session End: At the end of the trading session, the strategy closes all open positions to avoid overnight exposure.
Conclusion:
The combination of ORB breakout strategy, Heikin Ashi candles, and RVOL provides traders with a robust framework for identifying and capitalizing on early trends in the market. By leveraging these technical indicators together, traders can make more informed decisions and improve the overall performance of their trading strategies. However, like any trading strategy, it's essential to backtest thoroughly and adapt the strategy to different market conditions to ensure its effectiveness over time.

First 15-Min Candle Detector [With Breakout Alerts]Indicator: First 15-Minute Candle Detector
Purpose
This indicator helps traders by identifying and marking the high, low, and mid-point of the first 15-minute candle of the market session. It also provides visual aids and alerts for price breakouts above or below these levels, making it ideal for intraday trading strategies.
This script is suitable for traders focusing on early session momentum or reversal strategies.
Key Features
Market Start Customization: Configure the market start time (hour and minute) to align with your trading session or exchange timezone.
Visual Aids:
Horizontal lines to mark the High , Low , and Mid-point of the first 15-minute candle.
Background highlighting to identify the first 15-minute candle.
Configurable colors and line widths for clear visuals.
Breakout Alerts:
Real-time alerts for breakouts above the high or below the low of the first 15-minute candle.
Customizable alert messages.
Alerts configured using alertcondition .
Dynamic Adjustments:
Adapts dynamically to timeframes of 15 minutes or lower.
Resets and recalculates at the start of each new session.
Inputs and Configurations
Market Settings:
Market Start Hour: Default is 9.
Market Start Minute: Default is 30.
Visual Settings:
Enable/disable background highlighting.
Set colors for the background, high line, low line, and mid-line.
Adjust line width (1 to 5).
Toggle the visibility of the mid-line.
Alert Settings:
Enable breakout alerts.
Set custom alert messages for high and low breakouts.
How It Works
// First 15-Minute Candle Detection
The indicator monitors the first 15-minute candle after the market opens based on the configured start time. It records the high , low , and calculates the mid-point of this candle.
// Visual Markings
Horizontal lines are drawn at the high, low, and mid-point of the first 15-minute candle, extending to the right for the rest of the session.
// Breakout Detection
The indicator checks for price breakouts above the high or below the low of the first 15-minute candle and triggers alerts if enabled.
// Dynamic Reset
The indicator resets values and deletes previous session lines at the start of each new session.
Conditions and Alerts
Breakout Conditions:
High Breakout: The closing price exceeds the high of the first 15-minute candle.
Low Breakout: The closing price falls below the low of the first 15-minute candle.
Alert Triggers: Configurable alerts notify you of breakouts in real-time.
Use Cases
Intraday Traders: Ideal for early-session momentum or reversal strategies.
Breakout Traders: Helps identify entry points when price breaks key levels.
Visual Clarity: Simplifies tracking important session levels.
Limitations
Works only on 15-minute or lower timeframes.
Requires accurate market start time configuration.

TradingIQ - Impulse IQIntroducing "Impulse IQ" by TradingIQ
Impulse IQ is an exclusive trading algorithm developed by TradingIQ, designed to trade breakouts and established trends. By integrating artificial intelligence and IQ Technology, Impulse IQ analyzes historical and real-time price data to construct a dynamic trading system adaptable to various asset and timeframe combinations.
Philosophy of Impulse IQ
Impulse IQ combines IQ Technology (AI) with the classic principles of trend and breakout trading. Recognizing that markets inherently follow trends that need to persist for significant price movements to unfold, Impulse IQ eliminates the need for rigid settings or manual intervention.
Instead, it dynamically develops, adapts, and executes trend-based trading strategies, enabling a more responsive approach to capturing meaningful market opportunities.
Impulse IQ is designed to work straight out of the box. In fact, its simplicity requires just one user setting, making it incredibly straightforward to manage.
Strategy type is the only setting that controls Impulse IQ’s functionality.
Traders don’t have to spend hours adjusting settings and trying to find what works best - Impulse IQ handles this on its own.
Key Features of Impulse IQ
Self-Learning Breakout Detection
Employs IQ Technology to identify breakouts.
AI-Generated Trading Signals
Provides breakout trading signals derived from self-learning algorithms.
Comprehensive Trading System
Offers clear entry and exit labels.
AI-Determined Trailing Profit Target and Stop Loss
Position exit levels are clearly defined and calculated by the AI once the trade is entered.
Performance Tracking
Records and presents trading performance data, easily accessible for user analysis.
Long and Short Trading Capabilities
Supports both long and short positions to trade various market conditions.
IQ Meter
The IQ Meter details where price is trading relative to a higher timeframe trend and lower timeframe trend. Fibonacci levels are interlaced along the meter, offering unique insights on trend retracement opportunities.
Self Learning, Multi Timeframe IQ Zig Zags
The Zig Zag IQ is a self-learning, multi-timeframe indicator that adapts to market volatility, providing a clearer representation of market movements than traditional zig zag indicators.
Dual Strategy Execution
Impulse IQ integrates two distinct strategy types: Breakout and Cheap (details explained later).
How It Works
Before diving deeper into Impulse IQ, it's essential to understand the core terminology:
Zig Zag IQ : A self-learning trend and breakout identification mechanism that serves as the foundation for Impulse IQ. Although it belongs to the “Zig Zag” class of technical indicators, it's powered by IQ Technology.
Impulse IQ : A self-learning trading strategy that executes trades based on Zig Zag IQ. Zig Zag IQ identifies market trends, while Impulse IQ adapts, learns, and executes trades based on these trend characterizations.
Impulse IQ operates on a simple heuristic: go long during upside volatility and go short during downside volatility, essentially capturing price breakouts.
The definition of a “price breakout” is determined by IQ Technology, TradingIQ's exclusive AI algorithm. In Impulse IQ, the algorithm utilizes two IQ Zig Zags (self-learning, multi-timeframe zig zags) to analyze and learn from market trends.
It identifies breakout opportunities by recognizing violations of established price levels marked by the IQ Zig Zags. Impulse IQ then adapts and evolves to trade similar future violations in a recurring and dynamic manner.
Put simply, IQ Zig Zags continuously learn from both historical and real-time price updates to adjust themselves for an "optimal fit" to price data. The aim is to adapt so that the marked price tops and bottoms, when violated, reveal potential breakout opportunities.
The strategy layer of IQ Zig Zags, known as Impulse IQ, incorporates an additional level of self-learning with IQ Technology. It learns from breakout signals generated by the IQ Zig Zags, enabling it to dynamically identify and signal tradable breakouts. Moreover, Impulse IQ learns from historical price data to manage trade exits.
All positions start with an initial fixed stop loss and a trailing stop target. Once the trailing stop target is reached, the fixed stop loss converts into a trailing stop, allowing Impulse IQ to remain in the breakout/trend until the trailing stop is triggered.
What Classifies as a Breakout, Price Top, and Price Bottom?
For Impulse IQ:
Price tops are considered the highest price achieved before a price bottom forms.
Price bottoms are the lowest price reached before a price top forms.
For price tops, the highest price continues to be calculated until a significant downside price move occurs. Similarly, for price bottoms, the lowest price is calculated until a significant upside price move happens.
What distinguishes Zig Zag IQ from other zig zag indicators is its unique mechanism for determining a "significant counter-trend price move." Zig Zag IQ evaluates multiple fits to identify what best suits the current market conditions. Consequently, a "significant counter-trend price move" in one market might differ in magnitude from what’s considered "significant" in another, allowing it to adapt to varying market dynamics.
For example, a 1% price move in the opposite direction might be substantial in one market but not in another, and Zig Zag IQ figures this out internally.
The image above illustrates the IQ Zig Zags in action. The solid Zig Zag IQ lines represent the most recent price move being calculated, while the dotted, shaded lines display historical price moves previously analyzed by IQ Zig Zag.
Notice how the green zig zag aligns with a larger trend, while the purple zig zag follows a smaller trend. This mechanism is crucial for generating breakout signals in Impulse IQ: for a position to be entered, the breakout of the smaller trend must occur in the same direction as the larger trend.
The image above depicts the IQ Meters—an exclusive TradingIQ tool designed to help traders evaluate trend strength and retracement opportunities.
When the lower timeframe Zig Zag IQ and the higher timeframe Zig Zag IQ are out of sync (i.e., one is uptrending while the other is downtrending, with no active positions), the meters display a neutral color, as shown in the image.
The key to using these meters is to identify trend unison and pinpoint key trend retracement entry opportunities. Fibonacci retracement levels for the current trend are interlaced along each meter, and the current price is converted to a retracement ratio of the trend.
These meters can mathematically determine where price stands relative to the larger and smaller trends, aiding in identifying entry opportunities.
The top of each meter indicates the highest price achieved during the current price move.
The bottom of each meter indicates the lowest price achieved during the current price move.
When both the larger and smaller trends are in sync and uptrending, or when a long position is active, the IQ meters turn green, indicating uptrend strength.
When both trends are in sync and downtrending, or when a short position is active, the IQ meters turn red, indicating downtrend strength.
The image above shows the Point of Change for both the larger and smaller Zig Zag IQ trends. A distinctive feature of Zig Zag IQ is its ability to calculate these turning points in advance—unlike most traditional zig zag indicators that lack predetermined turning points and often lag behind price movements. In contrast, Zig Zag IQ offers a minimal-lag trend detection capability, providing a more responsive representation of market trends.
Simply put, once the market Zig Zag anchors are touched, the corresponding Zig Zag IQ will change direction.
Trade Signals
Impulse IQ can trade in one of two ways: Entering breakouts as soon as they happen (Breakout Strategy Type) or entering the pullback of a price breakout (Cheap Strategy Type).
Generally, the Breakout Strategy type will take a greater number of trades and enter a breakout quicker. The Cheap Strategy type will usually take less trades, but potentially enter at a better time/price point, prior to the next leg up of a break up, or the next leg down of a break down.
Entry signals are given when price breaks out to the upside or downside for the "Breakout" strategy type, or for the "Cheap" strategy type, when price retraces to the level it broke out from!
Breakout Strategy Example
The image above demonstrates a long position entered and exited using the Breakout strategy. The price breakout level is marked by the dotted, horizontal green line, representing a previously established price high identified by IQ Zig Zag. Once the price breaks and closes above this level, a long position is initiated.
After entering a long position, Impulse IQ immediately displays the initial fixed stop price. As the price moves favorably for the long position, the trailing stop conversion level is reached, and the indicator switches to a trailing stop, as shown in the image. Impulse IQ continues to "ride the trend" for as long as it persists, exiting only when the trailing stop is triggered.
Cheap Strategy Example
The image above shows a short entry executed using the Cheap strategy. The aim of the Cheap strategy is to enter on a pullback before the breakout occurs. While this results in fewer trades if price doesn’t pull back before the breakout, it typically allows for a better entry time and price point when a pullback does happen.
The image above illustrates the remainder of the trade until the trailing stop was hit.
Green Arrow = Long Entry
Red Arrow = Short Entry
Blue Arrow = Trade Exit
Impulse IQ calculates the initial stop price and trailing stop distance before any entry signals are triggered. This means users don’t need to constantly tweak these settings to improve performance—Impulse IQ handles this process internally.
Verifying Impulse IQ’s Effectiveness
Impulse IQ automatically tracks its performance and displays the profit factor for both its long and short strategies, visible in a table located in the top-right corner of your chart.
The image above shows the profit factor for both the long and short strategies used by Impulse IQ.
A profit factor greater than 1 indicates that the strategy was profitable when trading historical price data.
A profit factor less than 1 indicates that the strategy was unprofitable when trading historical price data.
A profit factor equal to 1 indicates that the strategy neither gained nor lost money on historical price data.
Using Impulse IQ
While Impulse IQ functions as a comprehensive trading system with its own entry and exit signals, it was designed for the manual trader to take its trading signals and analysis indications to greater heights - offering numerous applications beyond its built-in trading system.
The standout feature of Impulse IQ is its ability to characterize and capitalize on trends. Keeping a close eye on “Breakout” labels and making use of the IQ meter is the best way to use Impulse IQ.
The IQ Meters can be used to:
Find entry points during trend retracements
Assess trend alignment across higher and lower timeframes
Evaluate overall trend strength, indicating where the price lies on both IQ Meters.
Additionally, "Break Up" and "Break Down" labels can be identified for anticipating breakouts. Impulse IQ self-learns to capture breakouts optimally, making these labels dynamic signals for predicting a breakout.
The Zig Zag IQ indicators are instrumental in characterizing the market's current state. As a self-learning tool, Zig Zag IQ constantly adapts to improve the representation of current price action. The price tops and bottoms identified by Zig Zag IQ can be treated as support/resistance and breakout levels.
Of course, you can set alerts for all Impulse IQ entry and exit signals, effectively following along its systematic conquest of price movement.
Skrip berbayar

Stochastic Trendlines with Breakouts [Jamshid] - EnhancedStochastic Trendlines with Breakouts - Enhanced Version
This advanced Stochastic Trendlines with Breakouts script combines several powerful features to provide enhanced breakout detection based on the Stochastic Oscillator and additional confirmation signals. This script is designed to help traders identify key trend reversals, breakout points, and pivot levels with more accuracy by integrating advanced filters such as RSI confirmation, moving average trend filtering, volatility filtering, divergence detection, and multi-timeframe analysis.
Key Features:
Stochastic Oscillator-Based Breakouts:
Automatically detects breakouts based on the smoothed Stochastic Oscillator values (%K and %D), providing insights into overbought and oversold conditions.
Customizable overbought and oversold levels, with a mid-level (50) line for additional reference.
Trendlines on Pivot Points:
Automatically plots dynamic trendlines based on pivot highs and lows of the smoothed Stochastic %K, helping to visualize potential reversal points.
RSI Confirmation (Optional):
Filters breakout signals using the Relative Strength Index (RSI) to confirm breakouts only when the RSI is below 50 for downtrend breakouts and above 50 for uptrend breakouts.
Visual confirmation with a green "RSI Conf." label displayed on the chart when the RSI condition is met.
Moving Average Filter (Optional):
Confirms breakout signals in the direction of a user-defined Moving Average (MA) to trade in the overall market trend direction.
MA length is fully customizable.
Stochastic Divergence Filter (Optional):
Detects bullish or bearish divergence between the price and Stochastic Oscillator values, adding an extra layer of confirmation.
Multi-Timeframe Confirmation (Optional):
Confirms breakouts by checking the Stochastic %K and %D values from a higher timeframe. This helps in avoiding false signals by aligning with the broader market trend.
The higher timeframe can be customized to any timeframe (e.g., daily, weekly, etc.).
Volatility Filter (Optional):
Uses the ATR (Average True Range) to filter out breakouts during periods of low volatility, ensuring signals are only triggered when there is sufficient price movement.
ATR length and multiplier are fully customizable.
Custom Alerts:
Alerts are available for new trendline detections (both pivot high and pivot low) and for confirmed breakout signals. These alerts help traders stay informed in real-time without needing to monitor the chart continuously.
How to Use:
Customize the Stochastic Oscillator settings, such as %K smoothing and %D line parameters, to fit your trading strategy.
Enable or disable additional filtering features (RSI, MA, divergence, MTF, volatility) as needed.
Set up alerts for specific breakout conditions directly in TradingView to stay notified when breakout signals are triggered.
This script is designed for traders who are looking for precision breakout signals with added layers of confirmation to avoid false breakouts and enhance trading accuracy.

LiquiBreak — Semi-Automatic Breakout, Gap & Trend-Filter StrategLiquiBreak is a semi-automatic breakout + gap detection strategy that combines pivots, a volatility filter and an optional Supertrend direction check to generate entry signals. It can optionally place take-profit and stop-loss orders in points. Use it to highlight high-probability breakout/gap setups and to automate exits when you want — otherwise treat its signals as trade alerts that require your confirmation.
📌 LiquiBreak — Semi-Automatic Breakout, Gap & Trend Strategy
1. Overview
1. LiquiBreak is a semi-automatic breakout + gap strategy designed to catch high-quality moves with volatility confirmation.
2. Uses pivot-based support/resistance , gap detection , Supertrend filtering , and optional automatic TP/SL in points .
3. Works on all assets and timeframes, especially effective on XAUUSD, Indices, Crypto and FX pairs .
---
2. What This Script Detects
1. Breakouts above resistance and below support during strong volatility.
2. Bullish & bearish gap patterns confirmed with momentum sequences.
3. Dynamic volatility zones based on normalized ATR ranges.
4. Optional Supertrend trend direction for filtering bad signals.
5. Automatic TP/SL orders when enabled.
---
3. Recommended Indicators to Combine With
To increase accuracy and reduce false breakouts:
1. Supertrend (included) – best for trend direction.
2. EMA 9/21 or EMA 20/50 – confirms trend strength & pullbacks.
3. RSI or Stoch RSI – avoid overbought/oversold breakouts.
4. VWAP – institutional bias & fair value zones.
5. CPR / Pivot Points – confluence with breakout levels.
6. MACD – trend confirmation on higher timeframe.
7. Volume Profile (optional) – find breakout liquidity zones.
These indicators help filter low-quality signals without affecting the script’s core logic.
---
4. Key Features
1. Volatility-based pivot support & resistance .
2. Reliable breakout confirmation using real-time volatility strength.
3. Strong gap pattern detection with ATR threshold.
4. Optional Supertrend confirmation for safer entries.
5. Point-based Take Profit / Stop Loss .
6. Toggle on/off: Longs, Shorts, TP, SL .
7. Semi-automatic execution — not fully automated.
8. Clean, optimized structure for stability and speed.
---
5. Inputs / Settings
1. Pivot / Levels Period – defines structural S/R levels.
2. Volatility Filter (%) – prevents low-quality signals.
3. TP Points – automatic take-profit target.
4. SL Points – automatic stop-loss.
5. Enable TP / Enable SL – full exit control.
6. Allow Long / Allow Short – direction control.
7. Supertrend Filter – filter weak counter-trend trades.
---
6. How to Use the Strategy
1. Select timeframe & tune pivot/volatility settings.
2. Enable/disable automatic TP/SL based on your style.
3. Turn ON Supertrend for safer trend-based trades.
4. Confirm signals using EMA, RSI, VWAP, Volume or CPR.
5. Watch for high-volatility breakouts near key levels.
6. Use multiple timeframe analysis for stronger confirmation.
---
7. Important Warning (User Must Monitor Trades)
⚠ This script is NOT a fully automatic bot.
1. You MUST monitor the chart while using this strategy.
2. You MUST manually close trades if market conditions change.
3. Auto TP/SL helps, but during news events or fast markets, slippage may occur.
4. Treat this script as a signal + entry assistant , not a fire-and-forget system.
---
8. Best Practices
1. Works best on XAUUSD, NAS100, BTC, ETH, EURUSD .
2. Avoid major news unless experienced.
3. Increase volatility filter during choppy markets.
4. Use M15–H1 for clean breakouts; M5 for scalping.
5. For beginners: keep TP/SL enabled for safety.
6. Backtest first → then paper trade → then live trade.
---
9. Disclaimer
1. For educational and research purposes only .
2. Not financial advice.
3. User is fully responsible for their trades and risk.
4. Past performance does not guarantee future results.

ALN Sessions Box Breakout — Auto- DSTDevoleper: Sheikh Rakib
What it does
This indicator draws session range boxes for Asia (Dhaka), London, and New York using each market’s own local time (DST-aware). After a session closes, it watches for the first close above the session high or below the session low and then marks that breakout once per session with clear chart markers and optional alerts.
Key features
Auto-DST, per-city timezones
London session uses Europe/London
New York session uses America/New_York
Asia session uses Asia/Dhaka
Your chart timezone doesn’t matter—the sessions track real local hours.
Clean range boxes with adjustable opacity and optional outlines.
Session labels that auto-center at the end of each session.
One-shot breakout signals per session:
Triangle up when price closes above the session high.
Triangle down when price closes below the session low.
Built-in alerts for: session starts and each breakout direction.
Inputs
London / New York / Asia (Dhaka)
Show Session: toggle each session on/off
Time Range: default London 08:00–17:00 (local), New York 08:00–17:00 (local), Asia 06:00–15:00 (Dhaka)
Colour: box color for each session
Settings
Show Session Labels
Show Range Outline
Opacity Preset: Dark / Medium / Light
(UTC Offset input is kept for display, not used in session detection.)
Visuals & alerts
Boxes extend from session open to close, continually updating the high/low.
When the session ends, the final high/low are locked in, the label is centered, and the indicator begins monitoring for a breakout.
Alerts
Session start: Asia/London/New York
Breakouts: “High Breakout” (close > high) and “Low Breakout” (close < low) for each session
Create alerts from the TradingView alert dialog and choose the desired alertcondition.
Logic notes (how signals fire)
While a session is open, its box grows to contain all highs/lows.
On the first bar after close, the script starts listening for a breakout:
Close > session high → one up signal (fires once)
Close < session low → one down signal (fires once)
When the next same session begins, internal flags reset and a new box starts—so signals are inherently scoped to the period between that session’s close and its next open.
Tips
Use on intraday timeframes (e.g., 1m–30m) for clearer box structure.
If you only want specific markets, toggle others off for a cleaner chart.
For systematic entries, combine with your trend/volatility filters and use the breakout alerts as triggers or confirmations—this script doesn’t place trades.
Disclaimer: Market timing and risk management are your responsibility. Past session behavior does not guarantee future performance.

Intelligent Currency Breakout ChannelIndicator: Intelligent Currency Breakout Channel
This document provides a detailed explanation of the "Intelligent Currency Breakout Channel" indicator for TradingView.
1. Overview
The Intelligent Currency Breakout Channel is an advanced technical analysis tool designed to identify periods of price consolidation and signal potential breakouts. It automatically draws channels around ranging price action and utilizes sophisticated volume analysis to provide deeper insights into market sentiment. The indicator also includes a built-in logarithmic regression screener to help traders align their breakout signals with the broader market trend.
2. Key Features
Automatic Channel Detection: The indicator identifies periods of low volatility and automatically draws a containing channel (box) around the price action.
Breakout Signals: It generates clear visual alerts (▲ for bullish, ▼ for bearish) when the price closes decisively outside of a channel.
In-Depth Volume Analysis: Within each channel, the indicator plots volume as candlestick-like bars, offering three distinct modes: Total Volume, Buy/Sell Comparison, and Volume Delta. This helps traders gauge the strength and conviction behind price movements.
Real-time Sentiment Gauge: When a channel is active, a dynamic color-graded gauge appears on the right side of the chart. It visualizes the current volume delta momentum relative to its recent range, offering an at-a-glance sentiment reading.
Integrated Trend Screener: A secondary analysis tool based on logarithmic regression is included to determine the underlying trend direction (Up, Down, or Neutral), which can be used to filter breakout signals.
Fully Customizable: Users can extensively customize all parameters, from calculation lengths and breakout sensitivity to the visual appearance of every component.
3. How to Use
Channel Formation: Watch for the indicator to draw a new channel. This signifies that the market is in a consolidation or ranging phase. The formation of a channel itself can be an alertable event.
Volume Interpretation: Observe the volume bars inside the channel. An increase in volume as the price approaches the channel's upper or lower boundary can foreshadow a potential breakout. Use the Volume Display Mode to analyze if buying pressure (Comparison, Delta) or selling pressure is building.
Breakout Confirmation: A bullish breakout signal (▲) appears when the price closes above the channel's upper boundary. A bearish breakout signal (▼) appears when the price closes below the lower boundary. For higher-quality signals, enable the Strong Closes Only option.
Trend Confirmation (Screener): Use the screener's plot and background color to confirm the broader trend. For instance, you might choose to only take bullish breakout signals when the screener indicates an uptrend (green background) and bearish signals when it indicates a downtrend (red background).
Sentiment Gauge: The pointer on the gauge indicates current momentum. A pointer in the upper (green) section suggests bullish pressure, while a pointer in the lower (red) section suggests bearish pressure. This can provide additional confluence for a trade decision.
4. Settings and Inputs
Main Settings
Overlap Channels: If enabled, allows multiple channels to be drawn on the chart simultaneously, even if they overlap. When disabled, a new channel will only form if it doesn't intersect with an existing one.
Strong Closes Only: If enabled, a breakout is only triggered if the midpoint of the candle's body (average of open and close) is outside the channel. This helps filter out false signals caused by long wicks. If disabled, any close outside the channel triggers a breakout.
Normalization Length: The lookback period (in bars) used for price normalization. A higher value creates a more stable normalization but may be slower to react to recent price changes.
Box Detection Length: The lookback period used to detect the channel formation pattern. A lower value will result in more frequent channels but may be more sensitive to noise. A higher value will result in fewer, but potentially more significant, channels.
Volume Analysis
Show Volume Analysis: Toggles the visibility of the candlestick-like volume bars inside the channel.
Volume Display Mode:
Volume: Displays total volume as symmetrical bars around the channel's midline.
Comparison: Shows buying volume (green) above the midline and selling volume (red) below it.
Delta: Shows the net difference between buying and selling volume. Positive delta is shown above the midline, and negative delta is shown below.
Volume Delta Timeframe Source: The timeframe from which to source volume data for calculations. Using a lower timeframe can provide a more granular view of volume dynamics.
Volume Scaling: A multiplier that adjusts the vertical size of the volume bars relative to the channel's height.
Appearance
Volume Text Size: Sets the size of the volume data text displayed in the corners of the channel. Options: Tiny, Small, Medium, Large.
Bullish Color: The primary color for all bullish visual elements, including breakout signals and positive volume bars.
Bearish Color: The primary color for all bearish visual elements, including breakout signals and negative volume bars.
Screener Settings
Lookback Period: The number of bars used for the logarithmic regression calculation to determine the trend.
Screener Type:
Log Regression Channel: The signal is based on the slope of the entire regression channel over the lookback period. An upward sloping channel is bullish (1), and a downward sloping one is bearish (-1).
Logarithmic Regression: The signal is based on the most recent value of the regression line compared to its value 3 bars ago. This provides a more responsive measure of the immediate trend.
5. Alerts
You can set up the following alerts through the TradingView alerts panel:
New Channel Formed: Triggers when a new price consolidation channel is detected and drawn on the chart.
Bullish Breakout: Triggers when the price breaks out and closes above the upper boundary of a channel.
Bearish Breakout: Triggers when the price breaks out and closes below the lower boundary of a channel.
Is In Channel: Triggers on every bar that the price is currently trading inside an active channel.
Signal UP: Triggers when the Screener's signal turns bullish (1).
Signal DOWN: Triggers when the Screener's signal turns bearish (-1).

Instant Breakout Strategy with RSI & VWAPInstant Breakout Strategy with RSI & VWAP
This TradingView strategy (Pine Script v6) trades breakouts using pivot points, with optional filters for volume, momentum, RSI, and VWAP. It’s optimized for the 1-second timeframe.
Overview
The strategy identifies breakouts when price crosses above resistance (pivot highs) or below support (pivot lows). It can use basic pivot breakouts or add filters for stronger signals. Take-profit and stop-loss levels are set using ATR, and signals are shown on the chart.
Inputs
Left/Right Pivot Bars: Bars to detect pivots (default: 3). Lower values increase sensitivity.
Volume Surge Multiplier: Volume threshold vs. 20-period average (default: 1.5).
Momentum Threshold: Minimum % price change from bar open (default: 1%).
Take-Profit ATR Multiplier: ATR multiplier for take-profit (default: 9.0).
Stop-Loss ATR Multiplier: ATR multiplier for stop-loss (default: 1.0).
Use Filters: Enable/disable volume, momentum, RSI, and VWAP filters (default: off).
How It Works
1. Pivot Detection
Finds pivot highs (resistance) and lows (support) using ta.pivothigh and ta.pivotlow.
Tracks the latest pivot levels.
2. Volume Surge
Compares current volume to a 20-period volume average.
A surge occurs if volume exceeds the average times the multiplier.
3. Momentum
Measures price change from the bar’s open.
Bullish: Price rises >1% from open.
Bearish: Price falls >1% from open.
4. RSI and VWAP
RSI: 3-period RSI. Above 50 is bullish; below 50 is bearish.
VWAP: Price above VWAP is bullish; below is bearish.
5. ATR
14-period ATR sets take-profit (close ± atr * 9.0) and stop-loss (close ± atr * 1.0).
Trading Rules
Breakout Conditions
Bullish Breakout:
Price crosses above the latest pivot high.
With filters: Volume surge, bullish momentum, RSI > 50, price > VWAP.
Without filters: Only the crossover is needed.
Bearish Breakout:
Price crosses below the latest pivot low.
With filters: Volume surge, bearish momentum, RSI < 50, price < VWAP.
Without filters: Only the crossunder is needed.
Entries and Exits
Long: Enter on bullish breakout. Set take-profit and stop-loss. Close any short position.
Short: Enter on bearish breakout. Set take-profit and stop-loss. Close any long position.
Visuals
Signals: Green triangles (bullish) below bars, red triangles (bearish) above bars.
Pivot Levels: Green line (resistance), red line (support).
Indicators: RSI (blue, separate pane), VWAP (purple, on chart).
How to Use
Apply to a 1-second chart in TradingView for best results.
Adjust inputs (e.g., pivot bars, multipliers). Enable filters for stricter signals.
Watch for buy/sell triangles and monitor RSI/VWAP.
Use ATR-based take-profit/stop-loss for risk management.
Notes
Best on 1-second timeframe due to fast RSI and responsiveness.
Disable filters for more signals (less confirmation).
Backtest before live trading to check performance.
This strategy uses pivots, volume, momentum, RSI, and VWAP for clear breakout trades on the 1-second timeframe.

Alpha - Combined BreakoutThis Pine Script indicator, "Alpha - Combined Breakout," is a combination between Smart Money Breakout Signals and UT Bot Alert, The UT Bot Alert indicator was initially developer by Yo_adriiiiaan
The idea of original code belongs HPotter.
This Indicator helps you identify potential trading opportunities by combining two distinct strategies: Smart Money Breakout and a modified UT Bot (likely a variation of the Ultimate Trend Bot). It provides visual signals, draws lines for potential take profit (TP) and stop loss (SL) levels, and includes a dashboard to track performance metrics.
Tutorial:
Understanding and Using the "Alpha - Combined Breakout" Indicator
This indicator is designed for traders looking for confirmation of market direction and potential entry/exit points by blending structural analysis with a trend-following oscillator.
How it Works (General Concept)
The indicator combines two main components:
Smart Money Breakout: This part identifies significant breaks in market structure, which "smart money" traders often use to gauge shifts in supply and demand. It looks for higher highs/lows or lower highs/lows and flags when these structural points are broken.
UT Bot: This is a trend-following component that generates buy and sell signals based on price action relative to an Average True Range (ATR) based trailing stop.
You can choose to use these signals independently or combined to generate trading alerts and visual cues on your chart. The dashboard provides a quick overview of how well the signals are performing based on your chosen settings and display mode.
Parameters and What They Do
Let's break down each input parameter:
1. Smart Money Inputs
These settings control how the indicator identifies market structure and breakouts.
swingSize (Market Structure Time-Horizon):
What it does: This integer value defines the number of candles used to identify significant "swing" (pivot) points—highs and lows.
Effect: A larger swingSize creates a smoother market structure, focusing on longer-term trends. This means signals might appear less frequently and with some delay but could be more reliable for higher timeframes or broader market movements. A smaller swingSize will pick up more minor market structure changes, leading to more frequent but potentially noisier signals, suitable for lower timeframes or scalping.
Analogy: Think of it like a zoom level on your market structure map. Higher values zoom out, showing only major mountain ranges. Lower values zoom in, showing every hill and bump.
bosConfType (BOS Confirmation Type):
What it does: This string input determines how a Break of Structure (BOS) is confirmed. You have two options:
'Candle Close': A breakout is confirmed only if a candle's closing price surpasses the previous swing high (for bullish) or swing low (for bearish).
'Wicks': A breakout is confirmed if any part of the candle (including its wick) surpasses the previous swing high or low.
Effect: 'Candle Close' provides stronger, more conservative confirmation, as it implies sustained price movement beyond the structure. 'Wicks' provides earlier, more aggressive signals, as it captures momentary breaches of the structure.
Analogy: Imagine a wall. 'Candle Close' means the whole person must get over the wall. 'Wicks' means even a finger touching over the top counts as a breach.
choch (Show CHoCH):
What it does: A boolean (true/false) input to enable or disable the display of "Change of Character" (CHoCH) labels. CHoCH indicates the first structural break against the current dominant trend.
Effect: When true, it helps identify early signs of a potential trend reversal, as it marks where the market's "character" (its tendency to make higher highs/lows or lower lows/highs) first changes.
BULL (Bullish Color) & BEAR (Bearish Color):
What they do: These color inputs allow you to customize the visual appearance of bullish and bearish signals and lines drawn by the Smart Money component.
Effect: Purely cosmetic, helps with visual identification on the chart.
sm_tp_sl_multiplier (SM TP/SL Multiplier (ATR)):
What it does: A float value that acts as a multiplier for the Average True Range (ATR) to calculate the Take Profit (TP) and Stop Loss (SL) levels specifically when you're in "Smart Money Only" mode. It uses the ATR calculated by the UT Bot's nLoss_ut as its base.
Effect: A higher multiplier creates wider TP/SL levels, potentially leading to fewer trades but larger wins/losses. A lower multiplier creates tighter TP/SL levels, potentially leading to more frequent but smaller wins/losses.
2. UT Bot Alerts Inputs
These parameters control the behavior and sensitivity of the UT Bot component.
a_ut (UT Key Value (Sensitivity)):
What it does: This integer value adjusts the sensitivity of the UT Bot.
Effect: A higher value makes the UT Bot less sensitive to price fluctuations, resulting in fewer and potentially more reliable signals. A lower value makes it more sensitive, generating more signals, which can include more false signals.
Analogy: Like a noise filter. Higher values filter out more noise, keeping only strong signals.
c_ut (UT ATR Period):
What it does: This integer sets the look-back period for the Average True Range (ATR) calculation used by the UT Bot. ATR measures market volatility.
Effect: This period directly influences the calculation of the nLoss_ut (which is a_ut * xATR_ut), thus defining the distance of the trailing stop loss and take profit levels. A longer period makes the ATR smoother and less reactive to sudden price spikes. A shorter period makes it more responsive.
h_ut (UT Signals from Heikin Ashi Candles):
What it does: A boolean (true/false) input to determine if the UT Bot calculations should use standard candlestick data or Heikin Ashi candlestick data.
Effect: Heikin Ashi candles smooth out price action, often making trends clearer and reducing noise. Using them for UT Bot signals can lead to smoother, potentially delayed signals that stay with a trend longer. Standard candles are more reactive to raw price changes.
3. Line Drawing Control Buttons
These crucial boolean inputs determine which type of signals will trigger the drawing of TP/SL/Entry lines and flags on your chart. They act as a priority system.
drawLinesUtOnly (Draw Lines: UT Only):
What it does: If checked (true), lines and flags will only be drawn when the UT Bot generates a buy/sell signal.
Effect: Isolates UT Bot signals for visual analysis.
drawLinesSmartMoneyOnly (Draw Lines: Smart Money Only):
What it does: If checked (true), lines and flags will only be drawn when the Smart Money Breakout logic generates a bullish/bearish breakout.
Effect: Overrides drawLinesUtOnly if both are checked. Isolates Smart Money signals.
drawLinesCombined (Draw Lines: UT & Smart Money (Combined)):
What it does: If checked (true), lines and flags will only be drawn when both a UT Bot signal AND a Smart Money Breakout signal occur on the same bar.
Effect: Overrides both drawLinesUtOnly and drawLinesSmartMoneyOnly if checked. Provides the strictest entry criteria for line drawing, looking for strong confluence.
Dashboard Metrics Explained
The dashboard provides performance statistics based on the lines drawing control button selected. For example, if "Draw Lines: UT Only" is active, the dashboard will show stats only for UT Bot signals.
Total Signals: The total number of buy or sell signals generated by the selected drawing mode.
TP1 Win Rate: The percentage of signals where the price reached Take Profit 1 (TP1) before hitting the Stop Loss.
TP2 Win Rate: The percentage of signals where the price reached Take Profit 2 (TP2) before hitting the Stop Loss.
TP3 Win Rate: The percentage of signals where the price reached Take Profit 3 (TP3) before hitting the Stop Loss. (Note: TP1, TP2, TP3 are in order of distance from entry, with TP3 being furthest.)
SL before any TP rate: This crucial metric shows the number of times the Stop Loss was hit / the percentage of total signals where the stop loss was triggered before any of the three Take Profit levels were reached. This gives you a clear picture of how often a trade resulted in a loss without ever moving into profit target territory.
Short Tutorial: How to Use the Indicator
Add to Chart: Open your TradingView chart, go to "Indicators," search for "Alpha - Combined Breakout," and add it to your chart.
Access Settings: Once added, click the gear icon next to the indicator name on your chart to open its settings.
Choose Your Signal Mode:
For UT Bot only: Uncheck "Draw Lines: Smart Money Only" and "Draw Lines: UT & Smart Money (Combined)". Ensure "Draw Lines: UT Only" is checked.
For Smart Money only: Uncheck "Draw Lines: UT Only" and "Draw Lines: UT & Smart Money (Combined)". Ensure "Draw Lines: Smart Money Only" is checked.
For Combined Signals: Check "Draw Lines: UT & Smart Money (Combined)". This will override the other two.
Adjust Parameters:
Start with default settings. Observe how the signals appear on your chosen asset and timeframe.
Refine Smart Money: If you see too many "noisy" market structure breaks, increase swingSize. If you want earlier breakouts, try "Wicks" for bosConfType.
Refine UT Bot: Adjust a_ut (Sensitivity) to get more or fewer UT Bot signals. Change c_ut (ATR Period) if you want larger or smaller TP/SL distances. Experiment with h_ut to see if Heikin Ashi smoothing suits your trading style.
Adjust TP/SL Multiplier: If using "Smart Money Only" mode, fine-tune sm_tp_sl_multiplier to set appropriate risk/reward levels.
Interpret Signals & Lines:
Buy/Sell Flags: These indicate the presence of a signal based on your selected drawing mode.
Entry Line (Blue Solid): This is where the signal was generated (usually the close price of the signal candle).
SL Line (Red/Green Solid): Your calculated stop loss level.
TP Lines (Dashed): Your three calculated take profit levels (TP1, TP2, TP3, where TP3 is the furthest target).
Smart Money Lines (BOS/CHoCH): These lines indicate horizontal levels where market structure breaks occurred. CHoCH labels might appear at the first structural break against the prior trend.
Monitor Dashboard: Pay attention to the dashboard in the top right corner. This dynamically updates to show the win rates for each TP and, crucially, the "SL before any TP rate." Use these statistics to evaluate the effectiveness of the indicator's signals under your current settings and chosen mode.
*
Set Alerts (Optional): You can set up alerts for any of the specific signals (UT Bot Long/Short, Smart Money Bullish/Bearish, or the "Line Draw" combined signals) to notify you when they occur, even if you're not actively watching the chart.
By following this tutorial, you'll be able to effectively use and customize the "Alpha - Combined Breakout" indicator to suit your trading strategy.

Multi Timeframe Breakout/Retest (Gap, FVG, B&R)📊 Breakout & Retest Multi-Timeframe Indicator - Support and Resistance Indicator 📊
In short, this indicator scans 4 timeframes of your choice to check if a proper breakout of your support and resistance lines you input has happened. It color-coats your support and resistance levels based on the type of breakout, labels the levels, and shows which timeframes have had a proper breakout in an interactive table. This tool is primarily used to determine when a breakout—whether Fair Value Gap (FVG), gap, or regular—has occurred, allowing you to confidently play the retest.
🔍 Types of Breakouts:
This indicator highlights three types of breakouts:
Regular Breakouts: Defined when a candle breaks above or below your level, then closes, and the next candle’s wick does not touch that level.
Gap Breakouts: A gap breakout occurs when we gap above or below the level—often happening on daily candle opens and closes.
FVG Breakouts: An FVG breakout happens when a breakout above or below your level forms a Fair Value Gap, with your level inside the gap. These breakouts tend to have stronger retests
📋 Interactive Table
The table helps you visualize which levels are experiencing a breakout and on which timeframes. It color-codes each level based on breakout activity:
🔴 Red: No active breakouts
🟢 Green: Active regular breakout
🔵 Blue: Active FVG breakout
🟡 Yellow: Active gap breakout
🎨 Color Coating & Minimum Timeframe Breakouts
To make sure you're playing a true breakout, you want confirmation on at least 3 of your chosen timeframes. This indicator has an adjustable "active minimum breakout" setting, which can be customized between 1 and 4 timeframes. I personally find that when a breakout occurs on at least 3 timeframes, the retest tends to have a higher success rate. But you can adjust this setting based on your strategy.
🔧 Future Updates (Follow for Updates):
🚨 Alerts: Set alerts for breakouts and retests.
⚙️ Improved Error Handling: For a smoother experience.

MJForex Breakout Detector X SessionsThis Pine Script code is a Breakout Detector with Trading Session highlights for use on a financial chart. Here's a detailed breakdown of its functionality:
1. Breakout Detection
The main purpose of this script is to detect breakouts based on specific price levels (like highs and lows) within a given lookback period. It identifies different types of breakouts in real time, specifically:
Higher High (HH): The highest price in the lookback period is exceeded, suggesting bullish momentum.
Higher Low (HL): A low that is higher than the previous low, which might indicate a potential upward trend continuation.
Lower High (LH): The price makes a lower high than the previous high, indicating a possible downward reversal.
Lower Low (LL): A low that is lower than the previous low, indicating bearish momentum.
Breakout Logic:
A buy signal is generated when there is a breakout above a Higher High or a Higher Low, signaling a potential bullish trend.
A sell signal is generated when there is a breakout below a Lower High or a Lower Low, signaling a potential bearish trend.
These signals are plotted on the chart using shapes (green triangles for buy signals and red triangles for sell signals).
2. Candle Body vs. Wick Consideration
The indicator allows you to choose whether the breakout is detected based on the candle body (the open and close prices) or the wick (the high and low prices).
This is controlled by a user input (use_body), so you can switch between these modes depending on your preference.
3. Trading Session Highlights
The script also visually highlights different trading sessions on the chart. Three sessions can be configured:
First Session (e.g., Asia/Tokyo)
Second Session (e.g., Europe/London)
Third Session (e.g., America/New York)
Each session is colored differently on the chart's background (blue, yellow, and green), helping you easily visualize which trading session is currently active.
4. Real-Time Alerts
The script generates real-time alerts when a breakout occurs.
Alerts are sent based on the current price action without waiting for the candle to close, which helps traders respond quickly to potential breakout signals and be aware of the particular zone or area.
Alerts:
A Buy alert is triggered when there's a Higher High (HH) or Higher Low (HL) breakout.
A Sell alert is triggered when there's a Lower High (LH) or Lower Low (LL) breakout.
These alerts can be used to notify traders when certain breakout conditions are met, allowing them to take action immediately.
5. Customizability
The script allows for several customizable inputs:
Lookback Period: The number of bars used to calculate the highest high and lowest low (default is 5).
Breakout Detection Toggle: You can choose whether to show the breakout signals on the chart.
Session Visibility: You can turn on/off the visual highlights for the trading sessions.
Body/Wick Toggle: You can select whether to consider the candle body or the wick when detecting breakouts.
In Summary:
Breakout Detection: Detects and highlights Higher High, Higher Low, Lower High, and Lower Low breakouts on the chart, generating buy/sell signals.
Candle Body/Wick Option: You can choose to detect breakouts based on the body or wick of the candle.
Real-Time Alerts: Sends alerts as soon as a breakout occurs, without waiting for the candle to close.
Trading Session Highlights: Highlights different global trading sessions for easy visual reference on the chart.
This indicator is particularly useful for traders who want to identify key breakouts and visually track trading sessions across different markets.
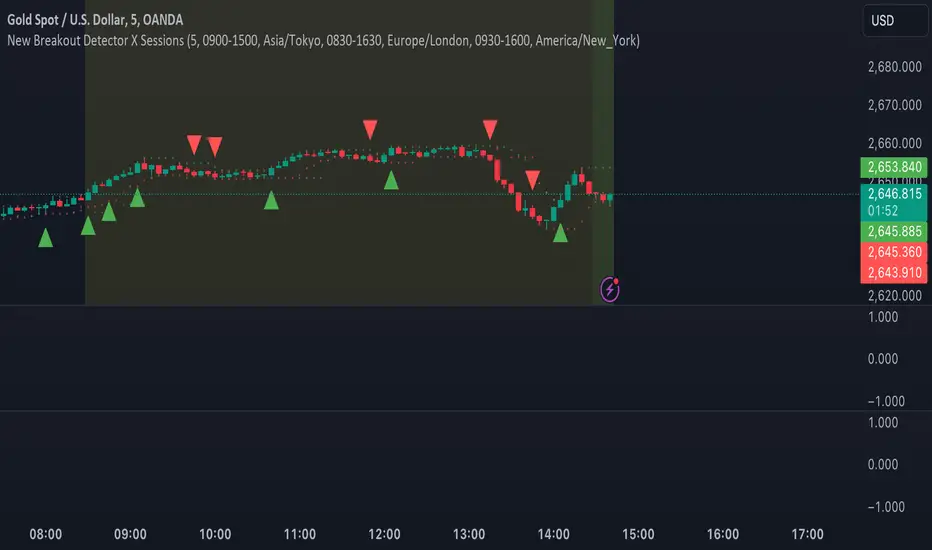
[Opening Range pre-Market Breakout Screener] with Alerts (TSO)=
with Alerts (TSO)
===========================================================================
===========================================================================
This Opening Range/pre-Market breakout screener lets you monitor up to 10 symbols/instruments simultaneously (9 plus the one currently displayed on the chart). It provides alerts when the price breaks out of the pre-market range, offering two options: 1) Immediate alerts as the breakout happens with the live bar, and 2) Alerts after the bar closes. The screener also labels breakouts on the chart and offers live status updates in the stats table. The Opening Range/pre-Market area is fully customizable, with a default setting optimized for US stock market pre-market hours (07:00 am-09:30 am ET). Additionally, you can set the Active Trading Session Schedule to define specific intraday periods when breakouts and alerts will be displayed.
What sets this indicator apart from other ORB indicators is its integrated screener for multiple symbols and an IMMEDIATE alert/status feature that notifies you the moment the price breaks through the pre-market range. Moreover, it can be used worldwide as it includes an active trading session schedule for every trading region globally!
===========================================================================
Explanation of all the Features/Inputs/Settings
---------------------------------------------------------------------------
>>> This is where the desired symbols can be turned on/checked to be screened for ORB breakout - the selected/checked symbols at creation of a 'Any alert() function call' alert will alert on any of the selected/checked symbols.
>>> Active Trading Session Hours, this is where Active Trading Session Hours can be setup during which breakouts will be shown on chart/table and alerts will trigger. Every trading region is included, by default it's set to a regular US trading session: 09:30am0-4:00pm ET.
>>> ORB Breakout Config is where the desired breakout approaches can be shown/alert turn on. Closed Bar Breakout: means that a breakout is considered as occurred only when a candle bar is fully closed. Live Breakouts: a breakout occurs immediately at price breakout thru pre-Market range, while candle bar is still open.
>>> Final section is simply the stats table location.
===========================================================================
Adding Alerts in TradngView
---------------------------------------------------------------------------
1) Consolidation alert(s) for the selected/checked symbols
- Select/check/find the desired symbols/instruments (when selecting symbols, make sure - they are from correct BROKER/SOURCE as pricing may differ between different brokers, causing confusion (under 1 broker/source, the symbol will be consolidated, under another it will not...))
-Right-click anywhere on any TradingView chart
-Click on Add alert
-Condition: Select this indicator by it’s name
-Immediately below, change it to "alert() function calls only"
-Expiration: Open-ended (that may require higher tier TradingView account, otherwise the alert will need to be occasionally re-triggered)
-Alert name: Anything
-Hit “Create”
-Note: If you change ANY Settings within the indicator – you must DELETE the current alert and create a new one per steps above, otherwise it will continue triggering alerts per old Settings!
* Once alert triggers, don't get confused, as it will show "Alert on SYMBOL", the SYMBOL will be where you created the major alert for all the symbols within the screener list! Within the alert, on the bottom, it will say: "SPY - LONG Breakout - Live" - this is where the correct symbol is for which the alert for consolidation was triggered!
===========================================================================
If you have any questions or issues with the indicator, please message me directly via TradingView.
---------------------------------------------------------------------------
Good Luck! (NOTE: Trading is very risky, past performance is not necessarily indicative of future results, so please trade responsibly!)

Single Swing Strategy (SSS)Introduction
The Single Swing Strategy (SSS) is a trading strategy designed for assets that trend. It utilises a single technical indicator to identify potential buying opportunities in upward-trending markets. The strategy focuses on moments when the price of an asset breaks out to a new high, suggesting a strong upward momentum.
Components
1. Exponential Moving Averages (EMAs): SSS uses two EMAs to evaluate the overall asset trend. SSS describes an uptrend as identified, when the fast EMA crosses above the slow EMA and vice versa for a downtrend.
2. Breakout: The strategy validates the trend identified by the EMAs through breakouts in the price action of the asset over a specified lookback period. No indicator is required for this step.
3. Average Directional Index (ADX): The ADX is used to measure the strength of a trend. It does not indicate the trend's direction but rather its strength, whether it's an uptrend or downtrend. A high ADX value (typically above 25) suggests a strong trend, either up or down while a low ADX value (typically below 20) indicates a weak or non-trending market. The ADX itself is a moving average of the expanding range between the +DI and -DI.
4. Positive Directional Indicator (DI+): DI+ helps identify the presence and strength of uptrends. It is calculated based on the upward price movement between current and previous highs. A rising DI+ alongside a rising ADX suggests a strengthening uptrend. When DI+ crosses above DI-, it's often interpreted as a bullish signal.
5. Negative Directional Indicator (DI-): DI- is used to detect the presence and strength of downtrends.It is derived from the downward price movement between current and previous lows. An increasing DI- along with a rising ADX indicates a strengthening downtrend while a crossover of DI- above DI+ is typically seen as a bearish signal.
How it works
1. Regime filter with ADX, DI+, and DI-: The first step in taking a trade is to determine the direction of the trend using the +DI. If in an uptrend, the strategy checks if the ADX is above 25 to confirm a strong uptrend. -DI is not used since the strategy is long only. If in an uptrend and the trend is strong, trades can be opened.
2. Trend Identification with EMAs: Initially, the strategy uses two Exponential Moving Averages (fast and slow) to determine the asset trend. A fast EMA crossing above the slow EMA signifies an uptrend, and vice versa for a downtrend. This is the Entry signal to open a long position.
3. Trend Confirmation with Breakout: The strategy confirms the EMA-indicated trend through price breakouts over a specified lookback period. An EMA crossover without a price action breakout does not lead to an entry signal
4. Trade Management: After entering a trade, the strategy uses predefined levels for taking profit and setting stop losses. Trades are closed either when the price reaches the take-profit level or falls to the stop-loss level. Hence, risk management is built in.
Results
The backtest results can be found below. Initial capital of 10000 was used, this is a convenient amount for most retail traders, commission of $3 per order, position size of 3% of initial capital and slippage of 3 ticks. These are all representative of real world retail trading conditions.
Originality
The Single Swing Strategy (SSS)'s originality is in its blending of classical technical analysis; Trend Analysis through EMAs and Price Action through Breakout, into an innovative trading logic.
1. The Essence of Trend and Breakout in SSS
(i) Trend Recognition: At the heart of SSS is the Exponential Moving Averages (EMAs). While the use of EMAs is common, SSS employs them for trend analysis so an entry decision can be made. The strategy's core algorithm assesses the inception of an upward trend by observing a specific crossing pattern of the EMAs, a moment where the asset's momentum shifts, offering a strategic advantage.
(ii) Breakout Significance: The strategy's reliance on price breakouts isn't just about identifying a new high; it's about understanding market psychology. A breakout beyond a previous high signals not only momentum but also a collective market sentiment that favors upward movement. SSS attempts to capture this momentum, translating it into a tangible trading opportunity.
(iii)Strength of trend: The ADX and +DI double checks the trend is in the right direction and checks to see if the trend is strong enough hence, it prevents trading when the trend is not supportive.
2. Simplicity as a Cornerstone
(i) Clarity and Efficiency: In the realm of algorithmic trading, complexity isn't always synonymous with effectiveness. SSS' simplicity ensures its logic is transparent and its execution, efficient. This simplicity is a strategic choice, designed to reduce overfitting to past data and improve adaptability to real-market conditions.
(ii) Ease of Use and Decision Making: The straightforward nature of SSS may empower traders to make informed decisions without being overwhelmed by convoluted indicators. This is particularly useful because of the embedding of risk management using defined exit points after entry through a Take Profit and Stop Loss. This hardcodes a 3:1 risk reward ratio into every trade.
3. Positive Expectancy
(i) Performance Metrics: The SSS strategy shows its edge in its backtesting results. A 62% win rate, a profit factor of 1.7, profit ratio of 1.05 and an average trade gain of 4.7% are not just numbers; they show the mathematical edge over the backtest period, especially considering the high commissions and slippage factored into its design.
Trading
The SSS strategy has been backtested on the 1D timeframe of BTCUSD but users are encouraged to try it on other assets such as SPXL (5min), AAPL (5min) and others but the appropriate timeframe and trading costs may vary.
NOTE
Like any trading strategy, SSS does not guarantee profits. It's a tool to assist in decision-making, not a foolproof solution. Trading involves risks, particularly in volatile markets. Users should trade responsibly, considering their risk tolerance and financial situation. While SSS automates some aspects of trading, it requires continuous monitoring and does not replace the need for sound judgement and decision-making by the trader.

CofeeShopCrypto CoffeeBreak RSI**This Indicator DOES NOT REPAINT**
For me the RSI who's been a very powerful tool but one of the things that's been missing from it time and time again is the ability to show true dynamic support and resistance that is generated by the movements of the RSI.
This version of the Relative Strength Index is designed to visualize and mark Support and Resistance conditions on the Relative Strength Index (RSI) itself, and leaving behind those known dynamic support and resistance (S/R) zones.
It also has the ability during live marks to show you whether the majority of momentum is to the bullish or bearish side and if there is a conflict between the current momentum and the support or resistance zone that you are inside of. In short it will create the zones during live market.
This means you don't have to wait to only look at previous values you can also make an assessment during live breakouts on current support and resistance levels as well as using previous support and resistance levels as markers for any limits in movement.
Inputs Tab:
Show Dynamic Zone Creator - Gives you a live action SR Generator on your chart at your current bars which extends a bit into the future for a better visual sense of activity.
The color of this area can be set manually or you can let the script color this area automatically.
This Generator helps to plot Support and Resistance Zones on your chart.
If no zone is triggered then it will move on.
If a zone is triggered, it will change to the appropriate color and leave the zone behind as the new candles form.
Show Dynamic Zone Mid Level - This is just a midline of the Zone Creator to get an earlier visualization of what's happening inside the zone when it is very large.
I use this midline as a breakpoint when price and RSI values come back to this level and both break it. If only ONE breaks the level, I do not take it as a confirmation.
Extend RSI support and resistance boxes into the future - this is strictly up to the user which value you set. It will simply extend the zones that were left behind into the future as many bars as you choose. Depending on the chart or asset that you trade and how much volatility there is at the time you should be able to determine a good length for these boxes.
How many bars reflect the dynamic S/R zone - raising this value can overlap more zones using more bars going backwards. This can intensify the color of the current zone being created. The lowest value you should use is 2. But the higher you make this value you will also be able to see previous zones created with more intensity. Raising this value above the RSI value can give you a very nice previous depletion of color on previous zones where you'll be able to watch them fade away and it will intensify the current ones being created.
Only show this many previous support and resistance zones - this is a way to limit the number of zones that are being left behind on your chart which could possibly slow down the activity of calculations and how your chart moves with more indicators on it. Technically you can show 400 to 500 previous zones on your chart but you don't really need to see that many in the past so set this to something that is relative to how far in history you need to reference SR levels.
------------- Lets talk about how to take trades and see false breakouts. -------------
Support Created, Not broken, False Breakout
In the image below you can see how the Dynamic Zone Generator left behind a Support Level however the RSI was unable to break above it.
This creates a price swing on the chart.
The RSI later comes back to this level, however while price breaks this level, the RSI does not.
This confirms that it is a false breakout.
------------------------------------------------------------------------------------------
Now lets take a look at what a confirmed breakout is for a short along with a Continuation of short move. This is quickly followed by a divergence.
In the image below you can see how the RSI was in its ranging area and broke below that range. In this case it would be be below -10. During this time it never created a support level or resistance level underneath it implicating that it has continuous movement.
You can see later that when it broke back inside of the range did not go long instead there was a red resistance area created below the RSI. The RSI then again broke below -10 and it broke through this resistance area below it indicating another quick short entry. This is the setup for a quick continuation. Be careful of these setups as they are usually followed quickly by a divergence.
----------------------------------------------------------------------------------
The Dynamic Zone Creator takes its time to calculate. It cant predict the future so you'll have to just let it do its thing. Once the candles close and they confirm, you'll have the color, and zone size you need.
The Dynamic Zone Creator works against your currently OPEN candles.
It will give you a high and a low area of a zone which you can use in later points of the oscillator to determine if you have valid breakouts and or bounces of price and momentum.
When set to automatic coloring, its zone background and midline will automatically change their colors to match the momentum of the RSI and price.
If there is no support or resistance found, the Zone Creator will simply move onto the next candles in play.
If there IS support or resistance found, the Zone Creator will leave behind a phantom zone or Support or Resistance.
Keep in mind these zones left behind will turn into opposing Support or Resistance depending on if price and momentum break these areas simultaneously.
----------------------------Reason for closed source----------------------------
This indicator will be updated in the future to also produce trendlines, signals, and incorporate different methods of validate pivots and volume by calculations I have created of my own.
To avoid publishing this script more than once and give you all a direct access, without having to find a secondary or tertiary publication with the addons code is protected and will be updated here.
I have put several days into this particular script and will continue over the next few weeks to add in complimentary coding as this version of the script is really just stage one.
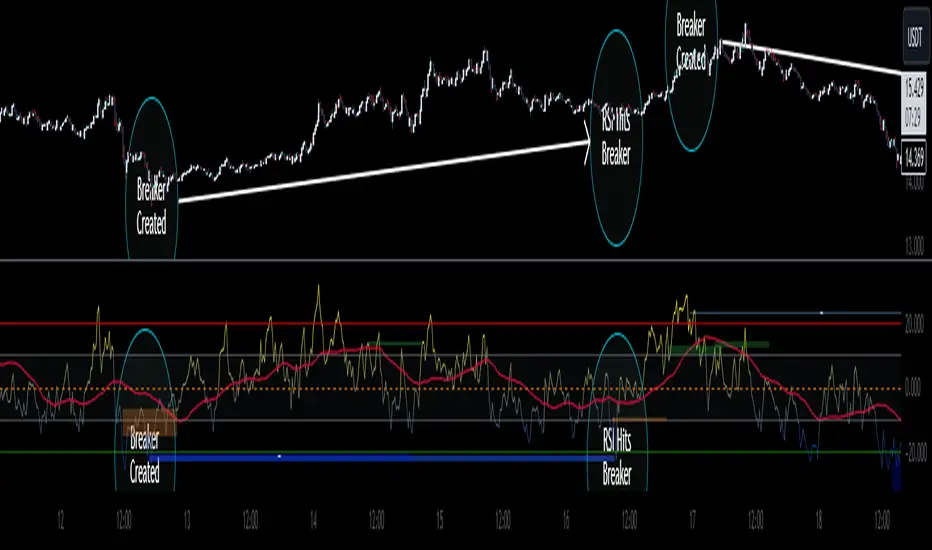
Hyper Squeeze Sniper (Dual Side: Long + Short)Hyper Squeeze Sniper (Dual Side Strategy)
This script is a comprehensive Volatility Breakout System designed to identify and trade explosive price moves following periods of consolidation. It combines the classical "Squeeze" theory with Linear Regression Momentum, Volume Analysis, and an ATR-based Trailing Stop to filter false signals and manage risk effectively.
The script operates on a logic of "Compression -> Explosion -> Trend Following" suitable for both Long and Short positions.
🛠 Detailed Methodology (How it works)
1. The Squeeze Detection (Consolidation) The core concept relies on the relationship between Bollinger Bands (BB) and Keltner Channels (KC).
Condition: When the Bollinger Bands (Standard Deviation) contract and fall inside the Keltner Channels (ATR based), it indicates a period of extremely low volatility (The Squeeze).
Visual: The background turns Gray to indicate "Do Not Trade / Wait Mode".
2. Momentum Confirmation (Linear Regression) Instead of using standard lagging indicators, this script utilizes Linear Regression of the price deviation to determine the direction of the breakout.
If the Linear Regression Slope > 0, the bias is Bullish.
If the Linear Regression Slope < 0, the bias is Bearish.
3. Volume Validation To avoid fake breakouts, a Volume Spike filter is applied. A signal is only valid if the current volume exceeds its moving average by a defined multiplier (Default x1.2).
4. Risk Management: ATR Trailing Stop Once a trade is entered, the script calculates a dynamic Trailing Stop based on the Average True Range (ATR).
- Long: The stop line trails below the price and never moves down.
- Short: The stop line trails above the price and never moves up.
- Exit: The position is closed immediately when the price breaches this volatility-based safety line.
How to Use
1. Wait: Look for the Gray Background. This is the accumulation phase.
2. Entry:
LONG: Wait for a Green Triangle ▲ (Price breaks Upper BB + Vol Spike + Bullish Momentum).
SHORT: Wait for a Red Triangle ▼ (Price breaks Lower BB + Vol Spike + Bearish Momentum).
3. Exit: Close the position when the "X" mark appears or when candles cross the trailing safety line.
Settings
- BB Length/Mult: Adjust the sensitivity of the squeeze detection.
- Vol Spike Factor: Increase this to filter out low-volume breakouts.
- ATR Period/Mult: Adjust the trailing stop distance (Higher = Wider stop for swing trading).

Total Info Indicator by MikePenzin
Install & Add to Chart
• Copy the script into Pine Editor → click Add to Chart .
• Open the ⚙️ Settings → Inputs to customize.
What It Does
• Displays key info in a floating table — trend, volume, ATR, RSI, stop loss, and more.
• Detects breakouts , smart SELL signals , and opening strength .
• Uses emojis and colours to make trends easy to read: 🟢 good, 🟡 neutral, 🔴 risky.
For Swing Traders
• Works best on Daily or 4H charts.
• Watch for 🟢 Uptrend + ⚡BUY / 🔥BUY breakout signals.
• Use ATR-based Stop Loss (shown in table).
• Avoid new entries a few days before earnings.
Suggested Setup
• 20/50/150 MA Lines: ON
• 200 MA Line: optional
• ATR Multiplier: 1.3
• Breakout Detection: ON (Volume + RSI + Trend filters)
• Smart SELLs: ON (RSI 70, EMA 20)
• Pivots: ON for quick swing levels
How to Read
• MA Row: 🟢 = price above MA (bullish).
• ATR/Stop Loss: Suggests where to place protective stop.
• Volume Info: Today’s vs 20-day average, plus pace.
• RSI & CCI: Shows momentum and overbought/oversold levels.
• Breakouts: ⚡BUY (early), 🔥BUY (confirmed).
• Smart SELLs: RSI🔴 / DIV🟣 / EMA🔵 mean potential exit zones.
Example Use
1️⃣ Find stocks with Uptrend 🟢 , rising volume, and ⚡BUY signal.
2️⃣ Enter near breakout; set Stop = shown level.
3️⃣ Take profits or trail when Smart SELLs appear or RSI peaks.
Tips
• Choose table corner under “Table Visualization.”
• Reduce clutter on small timeframes (turn off Pivots/200 MA).
• Use “Volume speed” to spot surging interest before breakouts.
• Compatible with most equities and ETFs.
Disclaimer
This script is for education & analysis only .
Not financial advice — always manage your own risk.

Resistance Breakout LevelsResistance Breakout Levels
An advanced TradingView indicator that detects significant resistance pivots and marks confirmed breakouts.
Description:
This Pine Script automatically identifies swing-high pivot points as potential resistance levels. It confirms a breakout only after a configurable number of consecutive closes above the pivot, reducing noise and avoiding false signals. Once validated, it draws a horizontal breakout line at the pivot price and adds a label with the breakout value. Traders can choose to display all breakout lines or only the single highest breakout within a specified lookback period. Additionally, a dynamic current price line spans the chart for quick reference.
Features:
• Pivot High Detection for Resistance Levels
• N-Consecutive Close Breakout Confirmation
• Toggle Between All Breakouts or Highest Breakout with Lookback Window
• Full-Width Live Current Price Line
• Customizable Line Colors, Widths, and Extension Direction
• Price Labels Directly on Breakout Lines
User Inputs:
• Pivot Bars (Left/Right): Number of bars used to detect pivot highs
• Consecutive Closes Above: Closes required above pivot to confirm breakout
• Show All Breakouts: Option to plot every confirmed breakout line
• Highest Lookback Bars: Lookback window for retaining only the highest breakout
• Breakout Line Color & Width: Customize breakout line appearance
• Price Line Color & Width: Customize live current price line appearance
