[fpemehd] Strategy TemplateHello Guys! Nice to meet you all!
This is my fourth script!
This is the Strategy Template for traders who wants to make their own strategy.
I made this based on the open source strategies by jason5480, kevinmck100, myncrypto. Thank you All!
### StopLoss
1. Can Choose Stop Loss Type: Percent, ATR, Previous Low / High.
2. Can Chosse inputs of each Stop Loss Type.
### Take Profit
1. Can set Risk Reward Ratio for Take Profit.
- To simplify backtest, I erased all other options except RR Ratio.
- You can add Take Profit Logic by adding options in the code.
2. Can set Take Profit Quantity.
### Risk Manangement
1. Can choose whether to use Risk Manangement Logic.
- This controls the Quantity of the Entry.
- e.g. If you want to take 3% risk per trade and stop loss price is 6% below the long entry price,
then 50% of your equity will be used for trade.
2. Can choose How much risk you would take per trade.
### Plot
1. Added Labels to check the data of entry / exit positions.
2. Changed and Added color different from the original one. (green: #02732A, red: #D92332, yellow: #F2E313)
Cari skrip untuk "backtest"

TradeIQ Darvas Box BacktestThis script has been made to backtest the strategy explained in this video link:
www.youtube.com
Publicly available scripts explained in the video were copy pasted and therefore merged into one single script. Open and short entries were made according to the rules of the video.

v1 Automatic Trading Bot | BacktestHello Friends.
We have been working on this script for a long time. Briefly, our scenario works as follows.
This test data includes results as of January 1, 2022 using a balance of $1000 and 10%.
WORKİNG LOGİC :
Relative Strength Index
Directional Movement Index
Relative Momentum Index
Indicators are Blended.
1 conditions are met in the overbought and oversold zone.
If the Directional Movement Index Signal is in the same direction, If all signals are in the same decision, it will be position.
We can set the take profit and stop loss levels on the algorithm as % over the entry price.
HOW TO ADJUST :
Formula a and formula b values are adjusted by increments or decrements of 1 each. these adjustments should be changed according to the time frame and chart layout.
You do not need to intervene in overbought and oversold zones. The Best Values were thus deemed appropriate.
If you still want to intervene, you need to know; When you change the overbought and oversold values, the entry time and risk will increase.
Together with the backtest script we are able to adjust the algorithm to all timeframes.
For example, while these settings are ideal for 5 minutes, it is necessary to change the strenght and formul values for a 15-minute period. This provides a user-specific adjustable strategy.
There are 6 different triggers in total on the alarm version.
Enter a long position.
Long position take profit
Long position stop loss
Enter a Short position.
Short position take profit
Short position stop loss
Currently, one platform is also connected to the binance exchange via an API .
The maximum leverage is set to 5 and a maximum of 5 trades are ordered to enter.
I will post the alarm version soon.
Good Luck Everyone !

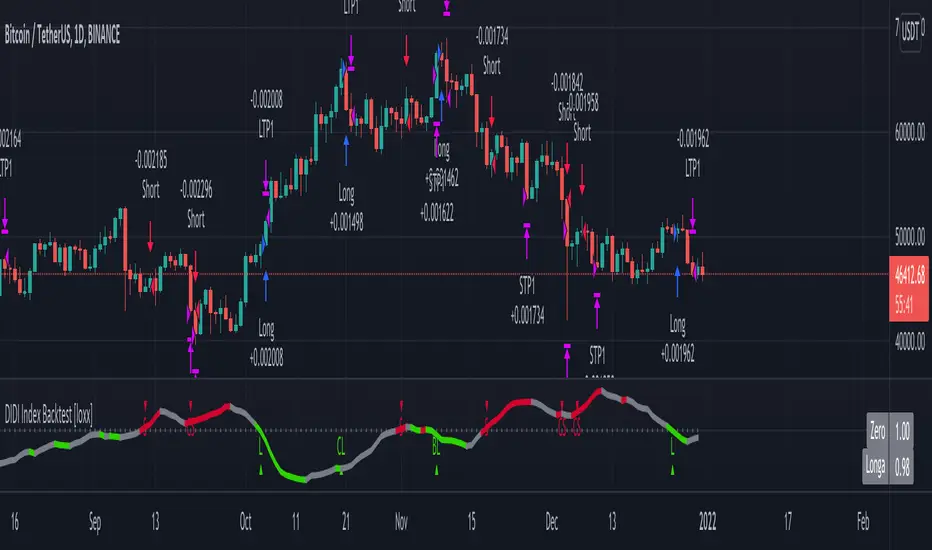
DIDI Index Backtest [loxx]DIDI Index Oscillator with Zero-line cross signals, continuations, and Baseline filtering
Indicator developed by Brazilian and analyst Odir Aguiar (Didi), consists of "Moving Averages", known for the famous needles Didi, which allows the visualization of reversal points.
Backtest for the following indicator:
Features
-Includes the following moving averages
ALMA
EMA
DONCHIAN
EAEF
EDSMA
EECEMA
EMA
EPMA
FRAMA
HMA
INSTANT
JMA
KAMA
Kijun v2
LSMA
MAMA
McGinley
MF
RMA
SMA
SSMA
T3
TEMA
TRIMA
VWMA
WM
ZLEMA
-Baseline filtering internal to indicator
-Has logic to account for Post Signal Baseline Crossover (PSBC) rules
-Has both short and long regular and continuation signals
-ATR-based stop loss and take profits
-1-3 take profit settings
-Moving stop loss after take profits
VictoriaThis indicator visualises different oscillators processed through Inverse Fisher Transform
What is included:
Inverse Fisher Transform on different oscillators
You can combine multiple oscillators into one
The combination of sources can be calculated in different ways
Set different buy and sell signal thresholds
View selected thresholds in the chart
Use TradingView Technicals Buy and Sell signals to dynamically change threshold values
Convert signal to alerts
Multiple filters to allow or block signals
Backtest compatible
Alerts compatible
Two different chart modes:
You can view multiple oscillators in the same chart
You can view trade signals/alerts on the chart from the thresholds you have selected
Description:
With this indicator you're able to visually review the signal strength of one or multiple oscillators processed with Inverse Fisher Transform (IFT), combine them and choose the method of calculation when they are combined. This produces a signal which strongly fluctuates between -1 and +1 instead of the more common 0-100 most oscillators uses. The intention is to make the decision making clearer and easier when you decide when to enter or exit a trade. This aims to help you remove the feelings from your trading.
Inverse Fisher Transform was first presented by John Ehlers in Stocks & Commodities V. 22:5 where he proposes to process RSI with the formula for hyperbolic tangent, tanh(x). This transforms the oscillator into a smoother and more compressed version with quicker oscillations.
Within a bull or bear period of the traded asset the signal have different strengths. To harness this to our advantage we use the combined strength of the TradingView Technical indicator which gives us a Buy, Strong Buy, Sell or a Strong Sell on the selected timeframe and asset. This makes it possible to delay the buy in bearish conditions to only trigger when it is really oversold and also allow the signal be more relaxed and exit the trade sooner. While on the other hand if the condition is bullish the buy signal is relaxed and the sell requires a stronger signal. All of this is possible to change in the indicator to fine tune the settings for the specific asset and timeframe selected. We also have the possibility of blocking the buy signals with different filters.

Dual MACD StrategyThis strategy Multi Time Frame Macd Indicator
We take the first long position when we have a buy signal in Weekly Macd (Macd line crosses above Signal line). This open a trading window, showed with green background color
We close the first position when either Weekly or Daily Macd give us a sell signal ((Macd line crosses below Signal line))
Enable Profit and Stop in strategy settings with different percentage to backtest the strategy. Also if it is better to use a Traditional Stop Loss or a Trailing Stop Loss based on a percentage from low prices
Change macd resolution in settings for other time frames to test the strategy
This Strategy was tested on Crypto Market with good results in assets as BTC, ETH, BNB, ADA, LTC, XLM, BCH, among others

[TVExtBot]Volatility Breakout Plus Strategy(BackTest)It is based on the legendary trader Larry R. Williams' volatility breakout strategy.
The volatility breakout strategy is a short-term trading strategy that realizes rapid profits on a daily basis, following the upward trend of a strong upward trend that exceeds a certain level on a daily basis.
The Volatility Breakout Plus strategy is a strategy modified to a long-term trend by supplementing the existing Volatility Breakout strategy.
변동성 돌파 전략이란 전설적인 트레이더 래리 윌리엄스(Larry R. Williams)의 변동성 돌파 전략을 기본으로 개발한 전략입니다.
변동성 돌파 전략은 일일 단위로 일정 수준 이상의 범위를 뛰어넘는 강한 상승세를 돌파 신호로 상승하는 추세를 따라가며 일 단위로 빠르게 수익을 실현하는 단기매매 전략입니다.
이번 출시하는 변동성 돌파 플러스 전략은 기존 변동성 돌파 전략을 보완하여 장기 추세로 수정한 전략입니다.
※특징으로는 선물보다는 현물차트에 더 효과적입니다.
기본적인 설정은 기존 변동성 돌파 전략과 동일하고 장기 추세에서의 리스크를 줄이기 위해 익절과 손절 기능을 추가하였습니다.
변동성 돌파 플러스 전략 백테스트 버전
Default Options(기본설정)
Slippage (슬리피지) : 3
Leverage (레버리지) : 1
BackTest Period (백테스트 기간) : 2018/ 01 / 01 ~ 2021/03/14
BeforeDay Open-Close Volatility (%) (전날 시가종가 변동률) : 6%
StopLoss (%) (손절) : 6%
TakeProfit (%) (익절) : 30%
Commission (거래수수료) : 0.06%

[TVExtBot]Volatility Breakout Plus Strategy(BackTest)It is based on the legendary trader Larry R. Williams' volatility breakout strategy.
The volatility breakout strategy is a short-term trading strategy that realizes rapid profits on a daily basis, following the upward trend of a strong upward trend that exceeds a certain level on a daily basis.
The Volatility Breakout Plus strategy is a strategy modified to a long-term trend by supplementing the existing Volatility Breakout strategy.
변동성 돌파 전략이란 전설적인 트레이더 래리 윌리엄스(Larry R. Williams)의 변동성 돌파 전략을 기본으로 개발한 전략입니다.
변동성 돌파 전략은 일일 단위로 일정 수준 이상의 범위를 뛰어넘는 강한 상승세를 돌파 신호로 상승하는 추세를 따라가며 일 단위로 빠르게 수익을 실현하는 단기매매 전략입니다.
이번 출시하는 변동성 돌파 플러스 전략은 기존 변동성 돌파 전략을 보완하여 장기 추세로 수정한 전략입니다.
※특징으로는 선물보다는 현물차트에 더 효과적입니다.
기본적인 설정은 기존 변동성 돌파 전략과 동일하고 장기 추세에서의 리스크를 줄이기 위해 익절과 손절 기능을 추가하였습니다.
Default Options(기본설정)
Slippage (슬리피지) : 3
Leverage (레버리지) : 1
BackTest Period (백테스트 기간) : 2018/01/01 ~ 2021/03/14
BeforeDay Open-Close Volatility (%) (전날 시가종가 변동률) : 6%
StopLoss (%) (손절) : 6%
TakeProfit (%) (익절) : 30%
Commission (거래수수료) : 0.06%

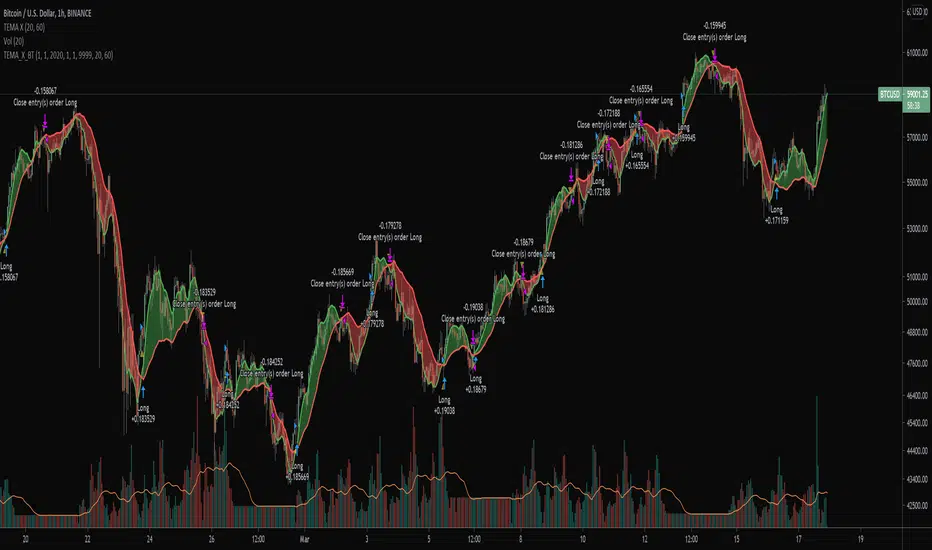
TEMA Cross BacktestA simple strategy backtest using two Triple Exponential Moving Averages (TEMA) crossing up and down. The default is a 20 TEMA crossing above 60 TEMA generates a long signal. Short signals are turned off by default, but included in the code at the last 2 lines (remove the '//').
Parts of script borrowed from other public scripts.
Combo Backtest 123 Reversal & MASS Index This is combo strategies for get a cumulative signal.
First strategy
This System was created from the Book "How I Tripled My Money In The
Futures Market" by Ulf Jensen, Page 183. This is reverse type of strategies.
The strategy buys at market, if close price is higher than the previous close
during 2 days and the meaning of 9-days Stochastic Slow Oscillator is lower than 50.
The strategy sells at market, if close price is lower than the previous close price
during 2 days and the meaning of 9-days Stochastic Fast Oscillator is higher than 50.
Second strategy
The Mass Index was designed to identify trend reversals by measuring
the narrowing and widening of the range between the high and low prices.
As this range widens, the Mass Index increases; as the range narrows
the Mass Index decreases.
The Mass Index was developed by Donald Dorsey.
WARNING:
- For purpose educate only
- This script to change bars colors.

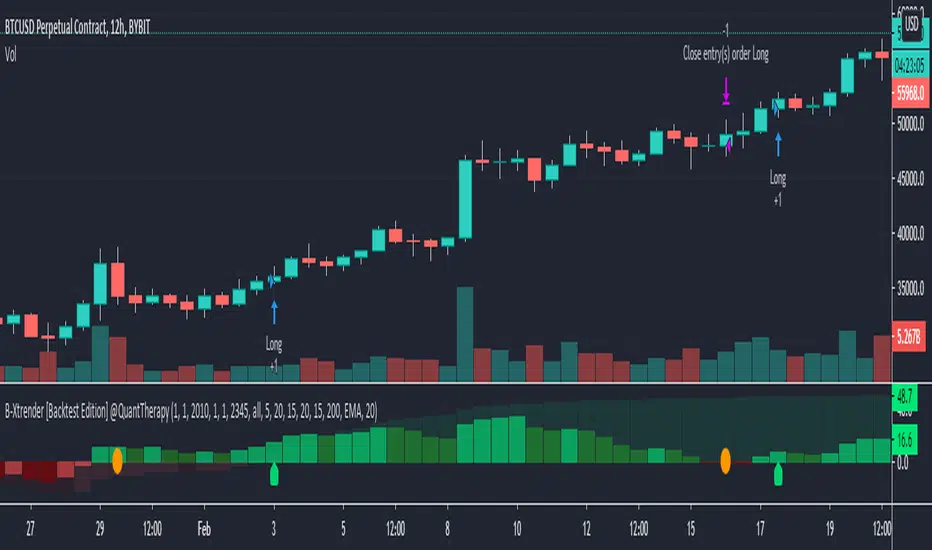
B-Xtrender [Backtest Edition] @QuantTherapyToday I have published a Backtest edition of one of my scripts.
For anyone looking into the indicators please have in the source below where the logic behind the indicator is nicely explained also the source of the inspiration of me coding it in tradingview.
ifta.org
Strategy
Entry when both bars are in alignment both green = long / both red = short
Exit when one is against your direction of trade
TSL will also kick in and exit when the percentage is breached
Moving Average is there to filter entries. Will allow entry only when active when the price is above (long-only) or below ( short-only )
Hope you are having a great day !
Combo Backtest 123 Reversal & MACD Crossover with Trail and Stop
This is a modification of @HPotter "Combo Backtest 123 Reversal & MACD Crossover" script.
I've added a trail stop, basic leverage simulation and stop loss.
Below is HPotter's explanation of the script principals.
First strategy
This System was created from the Book "How I Tripled My Money In The
Futures Market" by Ulf Jensen, Page 183. This is reverse type of strategies.
The strategy buys at market, if close price is higher than the previous close
during 2 days and the meaning of 9-days Stochastic Slow Oscillator is lower than 50.
The strategy sells at market, if close price is lower than the previous close price
during 2 days and the meaning of 9-days Stochastic Fast Oscillator is higher than 50.
Second strategy
MACD – Moving Average Convergence Divergence. The MACD is calculated
by subtracting a 26-day moving average of a security's price from a
12-day moving average of its price. The result is an indicator that
oscillates above and below zero. When the MACD is above zero, it means
the 12-day moving average is higher than the 26-day moving average.
This is bullish as it shows that current expectations (i.e., the 12-day
moving average) are more bullish than previous expectations (i.e., the
26-day average). This implies a bullish , or upward, shift in the supply/demand
lines. When the MACD falls below zero, it means that the 12-day moving average
is less than the 26-day moving average, implying a bearish shift in the
supply/demand lines.
A 9-day moving average of the MACD (not of the security's price) is usually
plotted on top of the MACD indicator. This line is referred to as the "signal"
line. The signal line anticipates the convergence of the two moving averages
(i.e., the movement of the MACD toward the zero line).
Let's consider the rational behind this technique. The MACD is the difference
between two moving averages of price. When the shorter-term moving average rises
above the longer-term moving average (i.e., the MACD rises above zero), it means
that investor expectations are becoming more bullish (i.e., there has been an
upward shift in the supply/demand lines). By plotting a 9-day moving average of
the MACD , we can see the changing of expectations (i.e., the shifting of the
supply/demand lines) as they occur.
WARNING:
- For purpose educate only
- This script to change bars colors.

Combo Backtest 123 Reversal & Line Regression Intercept This is combo strategies for get a cumulative signal.
First strategy
This System was created from the Book "How I Tripled My Money In The
Futures Market" by Ulf Jensen, Page 183. This is reverse type of strategies.
The strategy buys at market, if close price is higher than the previous close
during 2 days and the meaning of 9-days Stochastic Slow Oscillator is lower than 50.
The strategy sells at market, if close price is lower than the previous close price
during 2 days and the meaning of 9-days Stochastic Fast Oscillator is higher than 50.
Second strategy
Linear Regression Intercept is one of the indicators calculated by using the
Linear Regression technique. Linear regression indicates the value of the Y
(generally the price) when the value of X (the time series) is 0. Linear
Regression Intercept is used along with the Linear Regression Slope to create
the Linear Regression Line. The Linear Regression Intercept along with the Slope
creates the Regression line.
WARNING:
- For purpose educate only
- This script to change bars colors.

Combo Backtest 123 Reversal & Laguerre-based RSI This is combo strategies for get a cumulative signal.
First strategy
This System was created from the Book "How I Tripled My Money In The
Futures Market" by Ulf Jensen, Page 183. This is reverse type of strategies.
The strategy buys at market, if close price is higher than the previous close
during 2 days and the meaning of 9-days Stochastic Slow Oscillator is lower than 50.
The strategy sells at market, if close price is lower than the previous close price
during 2 days and the meaning of 9-days Stochastic Fast Oscillator is higher than 50.
Second strategy
This is RSI indicator which is more sesitive to price changes.
It is based upon a modern math tool - Laguerre transform filter.
With help of Laguerre filter one becomes able to create superior
indicators using very short data lengths as well. The use of shorter
data lengths means you can make the indicators more responsive to
changes in the price.
WARNING:
- For purpose educate only
- This script to change bars colors.

Quansium Series A BacktestThis comes with preconfigured setups or strategies. Simply choose one from our list based on the timeframe it was made for. Leverage can be changed; to keep trading safe, a maximum of 2 is allowed. In our findings, this was able to trade crypto (specifically BTC ), MES (Micro E-mini S&P 500 Index Futures ), and stocks. It is important to know that setups A, B, C, and D use variable position sizing, and dynamic stop loss/trailing stop/take profit, these parameters are provided through the alerts. The rest of the strategies were created with a simpler approach in mind, just plainly entry/exits signals.
Quansium as a framework:
Price reformat: we take the price source (Open, Close, High, Low) and remove any noise that affects the accuracy of our signals.
Time awareness: we take several time periods of the data on the chart such as start, end, and whole. We use this to add more depth to our signals.
Position size: our backtest tries to recreate as much as the real world trades as possible so our position is determined by the current equity. We also use the volatility of the market to increase or decrease our exposure or risk.
Risk awareness: stop loss, take profit, trailing stop are the risk exits we use to provide our users some peace of mind. These parameters are totally dynamic and follow the same behavior of the market.
Signals filtering: to make almost non-existent any errors and increase the quality of our trades, our indicators go through multiple phases, this avoid double entries or early exits, and help maintain a record of what has transpired and what’s currently taking place.
Indicators: whenever we can we use custom code or our own functions instead of the defaults ones provided. This gives us total control of what we’re trying to achieve. In many cases we tend to combine several indicators’ logic into one creating a more personalized take on it.
Easiness: since we started our main goal has been to provide the easiest and fastest way to alerts’ creation. It has taken us years to reach this level where now we already provide a list of preset strategies so the user doesn’t have to spend much time tinkering with scripts and more on other matters, because we know life is more than just trading.
Raw signals: we provide the option to turn off as much of our advanced features such as stop loss, take profit, trailing stop, dynamic sizing, etc, etc for a simple approach. Trade signals still go through the signals filtering method mentioned above,
Timeframe pairing: we take trading very seriously, by no way we’ll want the user to lose money (although such thing is expected because past results aren’t an indicative of futures ones), through years of experience we have found what are usually common mistakes the user makes, this feature allows us to only activate the strategy if the right timeframe is chosen.
Trend filters: through the years we have improved the arts of the trend. We like to keep things simple but yet powerful. We observe the macro and micro trend of the security. This helps confirm we are entering at the desirable timing. We also incorporate volume and volatility into decision making, we simply programmed it to trade when these are increasing and higher than the average values observed in both the short and long term. Finally we take into account the strength of the pair to make our final choice of whether to enter or wait, and if anything flashes contrary movement then we cancel the upcoming signal and stop monitoring until the next one comes along.
Full automated risk: stop loss, take profit, and trailing stops usually are set in percentages, and optimized even more using the current market behavior to become more adaptive. But always remains some sort of fixation, so the user must choose a value somewhere. This is where our framework shines the most, as previously mentioned before when we take time into our calculations, we use several periods to observe performance and get values that keep our risk exits natural and closest to the flow of the market itself.
Setups:
A: Centered oscillator with the difference of several moving averages with more sensitive settings. Momentum focused.
B: Centered oscillator using simple moving averages. Trend-Following focused.
C: Centered oscillator using smoothed data with the help of faster moving averages. Trend-Following focused.
D: Centered oscillator with the difference of several moving averages with less sensitive settings. Trend-Following focused.
E: Centered oscillator with the difference of moving averages where the standard deviation is applied first. It uses less sensitive settings. Trend-Following focused.
F: Finds the relationship between multiple readings of the price’s relative strength to better pin-point downs and ups. Trend-Following focused.
G: Centered oscillator with the difference of moving averages where the standard deviation is applied first. It uses more sensitive settings. Momentum focused.
H: Multiple centered oscillators using various moving averages. Trend-Following focused.
I: Centered oscillator using simple moving averages. Momentum focused.
Note: The framework is composed of almost 1000 lines of code as compared to each indicator that makes up the setup which is around 10. The power from Quansium doesn't come from the strategies themselves but rather the overall system that turns simple signals into complex and advanced trades.
Strategy Tester:
Initial Capital: chosen value is $20,000, as an approximate to Bitcoin’s ATH (All-Time High). In previous iterations we noticed some trades won’t go through if the capital was less than the ATH.
Order Size: 100% of equity (although the script controls this, and this is of no regards to the results).
Pyramiding: 1, system doesn’t place multiple entries in a row, only one at a time.
Commission: This simulates order execution with custom trading fees. Commissions are turned off by default because this script works in various markets and each operates differently. In order to reach results that are close to real world conditions, it is imperative the user fills this based upon their broker or exchange data.
When we started, we were focused on finding the best indicator, or creating it ourselves. After years we came to realize that the secret is not in which indicator you use but the framework behind it. All strategies have bad, good, best, worst performance periods. The key of a good system is to help keep you safe when it’s down and maximize your potential when it’s up. We hope this material at the very minimum inspires you to keep going and not lose faith, because it is not the smartest who win but those who persevere.

Phenom 5.3.1This has been a private script until now. I will be sharing it in order to get some feedback until it is ready to be made "invite only"
WHAT IT IS:
This is a scalping method (mostly) that works on nearly all markets and timeframes. THIS IS A BACKTEST SCRIPT! PLAN ACCORDINGLY!
HOW IT WORKS:
This script uses common indicators (5) in non-standard ways. When combined together, they can give fairly accurate results (40-65%) with acceptable Profit Factor ratings (1.7-3+).
This uses CCI, Moving Average, Stochastic, PSAR, and Bollinger Bands.
With these we have 4 base strategies usable.
Each indicator can be disabled (one at a time).
Each indicator has a SL method (stackable).
Each indicator has a TP method (stackable).
BEST RESULTS:
I have received best results as a scalper on 5min or 1HR timeframes. Mostly used on Index CFD's and CRYPTO markets.
NOT RESPONSIBLE FOR MISUSE OR LOST FUNDS! D.Y.O.R

Combo Backtest 123 Reversal & Volume SMA This is combo strategies for get a cumulative signal.
First strategy
This System was created from the Book "How I Tripled My Money In The
Futures Market" by Ulf Jensen, Page 183. This is reverse type of strategies.
The strategy buys at market, if close price is higher than the previous close
during 2 days and the meaning of 9-days Stochastic Slow Oscillator is lower than 50.
The strategy sells at market, if close price is lower than the previous close price
during 2 days and the meaning of 9-days Stochastic Fast Oscillator is higher than 50.
Second strategy
Volume and SMA
WARNING:
- For purpose educate only
- This script to change bars colors.

Combo Backtest 123 Reversal & Gann Swing Oscillator This is combo strategies for get a cumulative signal.
First strategy
This System was created from the Book "How I Tripled My Money In The
Futures Market" by Ulf Jensen, Page 183. This is reverse type of strategies.
The strategy buys at market, if close price is higher than the previous close
during 2 days and the meaning of 9-days Stochastic Slow Oscillator is lower than 50.
The strategy sells at market, if close price is lower than the previous close price
during 2 days and the meaning of 9-days Stochastic Fast Oscillator is higher than 50.
Second strategy
The Gann Swing Oscillator has been adapted from Robert Krausz's book,
"A W.D. Gann Treasure Discovered". The Gann Swing Oscillator helps
define market swings.
WARNING:
- For purpose educate only
- This script to change bars colors.

Combo Backtest 123 Reversal & FX Sniper: T3-CCI This is combo strategies for get a cumulative signal.
First strategy
This System was created from the Book "How I Tripled My Money In The
Futures Market" by Ulf Jensen, Page 183. This is reverse type of strategies.
The strategy buys at market, if close price is higher than the previous close
during 2 days and the meaning of 9-days Stochastic Slow Oscillator is lower than 50.
The strategy sells at market, if close price is lower than the previous close price
during 2 days and the meaning of 9-days Stochastic Fast Oscillator is higher than 50.
Second strategy
This simple indicator gives you a lot of useful information - when to enter, when to exit
and how to reduce risks by entering a trade on a double confirmed signal.
You can use in the xPrice any series: Open, High, Low, Close, HL2, HLC3, OHLC4 and ect...
WARNING:
- For purpose educate only
- This script to change bars colors.

Combo Backtest 123 Reversal & Volatility Finite Volume ElementsThis is combo strategies for get a cumulative signal.
First strategy
This System was created from the Book "How I Tripled My Money In The
Futures Market" by Ulf Jensen, Page 183. This is reverse type of strategies.
The strategy buys at market, if close price is higher than the previous close
during 2 days and the meaning of 9-days Stochastic Slow Oscillator is lower than 50.
The strategy sells at market, if close price is lower than the previous close price
during 2 days and the meaning of 9-days Stochastic Fast Oscillator is higher than 50.
Second strategy
This is another version of FVE indicator that we have posted earlier
in this forum.
This version has an important enhancement to the previous one that`s
especially useful with intraday minute charts.
Due to the volatility had not been taken into account to avoid the extra
complication in the formula, the previous formula has some drawbacks:
The main drawback is that the constant cutoff coefficient will overestimate
price changes in minute charts and underestimate corresponding changes in
weekly or monthly charts.
And now the indicator uses adaptive cutoff coefficient which will adjust to
all time frames automatically.
WARNING:
- For purpose educate only
- This script to change bars colors.

Combo Backtest 123 Reversal & FSK (Fast and Slow Kurtosis) This is combo strategies for get a cumulative signal.
First strategy
This System was created from the Book "How I Tripled My Money In The
Futures Market" by Ulf Jensen, Page 183. This is reverse type of strategies.
The strategy buys at market, if close price is higher than the previous close
during 2 days and the meaning of 9-days Stochastic Slow Oscillator is lower than 50.
The strategy sells at market, if close price is lower than the previous close price
during 2 days and the meaning of 9-days Stochastic Fast Oscillator is higher than 50.
Second strategy
This indicator plots the Fast & Slow Kurtosis. The Kurtosis is a market
sentiment indicator. The Kurtosis is constructed from three different parts.
The Kurtosis, the Fast Kurtosis(FK), and the Fast/Slow Kurtosis(FSK).
WARNING:
- For purpose educate only
- This script to change bars colors.

Combo Backtest 123 Reversal & Fractal Chaos Oscillator This is combo strategies for get a cumulative signal.
First strategy
This System was created from the Book "How I Tripled My Money In The
Futures Market" by Ulf Jensen, Page 183. This is reverse type of strategies.
The strategy buys at market, if close price is higher than the previous close
during 2 days and the meaning of 9-days Stochastic Slow Oscillator is lower than 50.
The strategy sells at market, if close price is lower than the previous close price
during 2 days and the meaning of 9-days Stochastic Fast Oscillator is higher than 50.
Second strategy
The value of Fractal Chaos Oscillator is calculated as the difference between
the most subtle movements of the market. In general, its value moves between
-1.000 and 1.000. The higher the value of the Fractal Chaos Oscillator, the
more one can say that it follows a certain trend – an increase in prices trend,
or a decrease in prices trend.
Being an indicator expressed in a numeric value, traders say that this is an
indicator that puts a value on the trendiness of the markets. When the FCO reaches
a high value, they initiate the “buy” operation, contrarily when the FCO reaches a
low value, they signal the “sell” action. This is an excellent indicator to use in
intra-day trading.
WARNING:
- For purpose educate only
- This script to change bars colors.

Simple SMA Strategy Backtest Part 5Simple SMA strategy
In this stream, we will create an intraday trade cap.
WARNING:
- For purpose educate only
- This script to change bars colors
Stream:
www.tradingview.com
