Liquidity Zones Alerts"Liquidity Zones Alerts" is a powerful smart-money-based indicator designed to detect key liquidity grabs and provide high-probability reversal signals using a combination of market structure, volume, volatility, and candlestick confirmation.
🧠 How It Works
The core logic of this indicator is built around the Smart Money Concepts:
🔺 Liquidity Sweeps: Detects when price takes out previous daily or weekly highs/lows, suggesting stop hunts or engineered liquidity moves by institutional players.
📈 Volume Filter: Ensures signals only appear during above-average volume, filtering out noise and low-interest moves.
⚡ Volatility Filter: Flags high-range candles relative to the average, catching flash crashes/spikes that often precede strong reversals.
🔄 Engulfing Candle Confirmation: Confirms entry with a bullish or bearish engulfing pattern after liquidity is taken — increasing signal reliability.
🧭 Premium/Discount Zone Logic: Trades are filtered to ensure longs are only taken in discount zones, and shorts in premium zones, using a 20-period market range for context.
📌 Features
✅ Daily & Weekly liquidity zones toggle
✅ Visual signals with clean 🔻(short) & 🔺(long) arrows
✅ Auto-detection of flash crashes
✅ Alerts on both long and short setups
✅ Optional previous high/low level plotting for context
✅ Background highlighting of valid signal candles
✅ Multi-timeframe friendly and compatible with any asset
🛠️ Use Case
Whether you're a scalper or a swing trader, this tool helps you spot institutional entry zones before the move happens. It works especially well when combined with your existing bias or supply/demand zones.
💬 “Price doesn't move randomly — it hunts liquidity. This indicator shows you where and when it happens.”
Cari skrip untuk "alert"

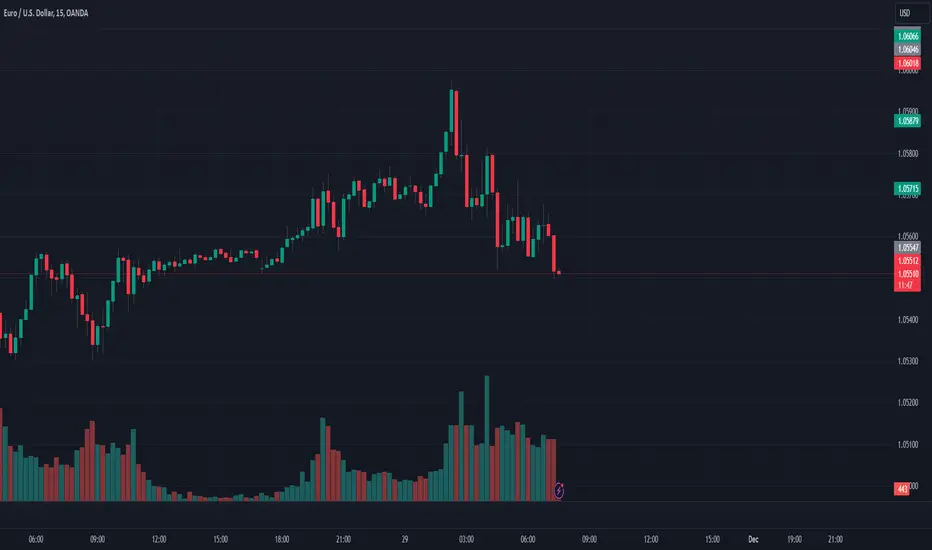
Opening Price Deviations with AlertsOverview
The Timeframe Opening Price Deviations indicator helps traders visualize how price deviates from a key reference point—the opening price of a selected timeframe (Daily, Weekly, or Monthly). It calculates upper and lower deviation levels based on a percentage step and plots these levels on the chart. This can help traders identify potential areas of support and resistance.
----------------------------------------------------------------------------------------------------------------------
How It Works
Opening Price Reference:
The script retrieves the opening price of the selected timeframe (Daily, Weekly, or Monthly).
Deviation Levels Calculation:
Five upper and lower deviation levels are calculated based on a percentage step input by the user.
Each level is determined by multiplying the opening price by (1 ± step size).
Visualization
The indicator plots the calculated levels as horizontal lines above and below the opening price.
Labels appear only on the latest bar, displaying the exact price level along with its percentage deviation from the opening price.
User has the option to turn on/off or change the bar colours. If price is within the 1st deviation lines that's considered neutral coloured orange as default. If price is above/below the first deviation levels the bar colours will be green or red.
---------------------------------------------------------------------------------------------------------------------
Potential Use Cases
Support & Resistance Zones 🟢🔴
The deviation levels can act as potential areas where price may reverse or consolidate based on historical price behaviour.
Breakout & Reversion Strategies 📈📉
If price breaks above an upper deviation level, it could indicate momentum continuation.
If price rejects from a level, it might suggest a mean reversion opportunity.
Trend Strength Analysis 🔍
The distance between the price and deviation levels can help traders assess whether a trend is strong (moving away from the opening price) or weak (hovering near the opening price).
Intraday vs. Multi-Timeframe Perspective 🕒
By selecting different timeframes (Daily, Weekly, Monthly), traders can align intraday price movements with higher timeframe reference points for added confluence.
---------------------------------------------------------------------------------------------------------------------
Customization Options
Timeframe Selection: Choose between Daily, Weekly, or Monthly opening prices.
Deviation Step (%): Adjust the step size to control the spacing between deviation levels.
Colour Bars: User Is able to change the colour of the bars.
---------------------------------------------------------------------------------------------------------------------
Alerts
This Indicator also has alerts for when price crosses above/below a deviation line. It will tell you the ticker, price and time
---------------------------------------------------------------------------------------------------------------------
Final Notes
This indicator is purely for technical analysis and should not be used as a standalone trading system. It works best when combined with price action, volume analysis, or other indicators of you're choosing to refine trade decisions.
Happy Trading! 🚀📊
---------------------------------------------------------------------------------------------------------------------
This explanation is clear, informative, and compliant with TradingView’s House Rules.

New Bar AlertThis is probably the simplest indicator on Tradingview, it generates an alert on every new bar.
Useful for strategies where you only need chart attention at the new bar, see if you have a setup.
Helps not having to stare at the charts, the alert will tell you when it's time to take a look.
Works on all timeframes but in order to keep your sanity, best used on higher timeframes, 5mins and up.
BooBee Digital - Enhanced Buy & Sell Alerts Suite
BooBee Digital - Enhanced Buy & Sell Alerts Suite
Introduction:
The “BooBee Digital - Enhanced Buy & Sell Alerts Suite” is a comprehensive trading tool designed to provide traders with precise buy and sell signals by integrating the Average True Range (ATR) trailing stop technique and the Volume Weighted Average Price (VWAP) indicator. This script is tailored to help traders make informed decisions by considering both market volatility and trading volume.
How It Works:
1. ATR Calculation:
• Purpose: Measures market volatility to set dynamic stop levels.
• Details: The Average True Range (ATR) is calculated over a user-defined period. The ATR value reflects the average range of price movements over the specified period, which is crucial for assessing market volatility.
2. ATR Trailing Stop:
• Purpose: Identifies potential trend reversals by setting trailing stops based on market volatility.
• Details: The ATR trailing stop is dynamically adjusted using the ATR value and a user-defined sensitivity factor. This trailing stop level helps identify trend reversals by moving in accordance with price fluctuations.
3. VWAP Calculation:
• Purpose: Provides a volume-weighted average price to benchmark fair value.
• Details: The VWAP is calculated by taking the sum of the product of price and volume, divided by the total volume. This indicator gives traders a reference point for the average price at which the asset has traded throughout the day, considering trading volume.
4. EMA Crossover:
• Purpose: Adds a confirmation layer for buy and sell signals.
• Details: A 1-period Exponential Moving Average (EMA) is used to identify short-term price movements. Buy and sell signals are generated based on the crossover of the EMA and the ATR trailing stop, adding an extra layer of confirmation for trade entries and exits.
Signal Generation:
Buy Signal:
• Generated when the price is above the ATR trailing stop and there is a bullish crossover of the EMA and ATR trailing stop.
• Indicator: Green label below the bar with “Buy” text.
Sell Signal:
• Generated when the price is below the ATR trailing stop and there is a bearish crossover of the EMA and ATR trailing stop.
• Indicator: Red label above the bar with “Sell” text.
VWAP Line:
• The VWAP line is plotted on the chart to help traders identify significant price levels based on trading volume.
• Indicator: Blue line representing the VWAP.
How to Use:
• Chart Type: The script is designed for use on standard chart types such as Candlestick and OHLC. It does not support non-standard chart types like Heikin Ashi, Renko, Kagi, Point & Figure, and Range, as they may produce unrealistic results.
• Clean Chart: Ensure your chart is clean and free of other indicators to avoid confusion. The signals and colors plotted by the script should be easily identifiable.
• Trade Confirmation: Use the buy and sell signals generated by the script in conjunction with other analysis methods to confirm trades.
Key Concepts:
• ATR Trailing Stop: This technique sets dynamic stop levels based on market volatility, helping to identify trend reversals.
• VWAP: This indicator provides a benchmark for the average price considering trading volume, helping traders identify fair value.
• EMA Crossover: This adds a layer of confirmation for buy and sell signals, improving the accuracy of trade entries and exits.

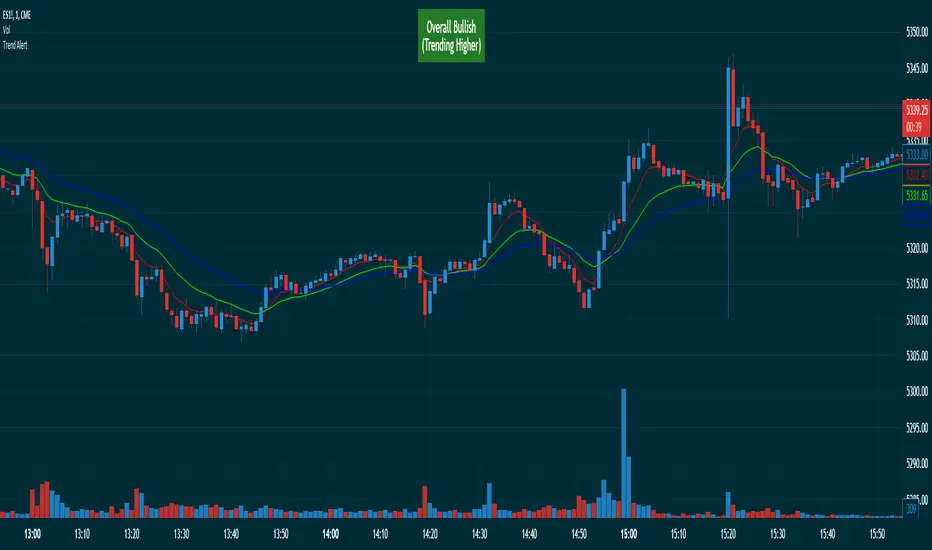
Triple EMA Trend AlertThis EMA trend indicator works by determining if a short-term EMA is above an intermediate-term EMA that is in turn above a long-term EMA (in a bullish trend) or if the reverse is true in a bearish trend. An alert box is displayed on the chart to give a trend trader a quick at-a-glance reference to see which way the overall trend is moving by turning green when the trend is overall bullish, red when overall bearish, and gray when indecisive and not clearly trending (a good time for the trend trader to consider setting back and just observing as they wait for a new trend to develop). Text is displayed in the box showing the current overall trend direction. Sometimes, using this criterion, a trend can still be considered overall bullish while the EMAs are actually bearish prior an EMA crossover that results in a trend readout change to indecisive or in the opposite direction. For this reason, the indicator will also display in parenthesis if the EMAs are trending lower or higher by comparing all live-bar EMA values to that of the previous bar’s values to determine if they are collectively trending lower or higher at that time in order to give an early warning of a potential trend reversal before the EMA crossovers change the overall bullish or bearish readout of the indicator. Both the alert box and EMA line chart overlays can be turned on and off independently, if desired.
Zazzamira 50-25-25 Trend System Alerts OnlyPublishing my trading system script. It consist of several conditions to happen in order to open a trade. Work best on ES/MES 5 minute timeframe.
I like to use it with this settings:
- UTC -6 (don't tick Exchange Timezone)
and rest as default
To enter a trade, the following conditions must be met: Entry 1: the opening range (8:30AM - 9:15AM UTC-6) must be defined and the price must close above or below the opening range on the 5-minute timeframe. This entry condition defines the trade direction (above = long / below = short). Once the opening range is defined, the Trend-Based Fib Extension is applied from the range high to the range low (and vice versa). Fib levels are required for Exit conditions. Entry 2: the 8 - 27 - 67 - 97 EMAs must be defined. If the EMAs value order is 8 > 27 > 67 > 97, long-only trades are allowed. If the EMAs value order is 8 < 27 < 67 < 97, short-only trades are allowed. This entry condition filters fake breakouts of Entry 1. Entry 3: no trades are allowed after 12:59 UTC-6 (2PM EST). Entry 4: if Entry 1, Entry 2, and Entry 3 conditions are valid and the price hasn't reached the 23.6% Fib line, an entry order can be set at the range high/long with 4 contracts. To exit a trade, the following conditions must be met: Exit 1 (Stop loss): set a trailing stop based on 2.1x ATR (14) from entry. Exit 2: take 50% profits at the 23.6% Fib and leave trailing stop untouched. Exit 3: if Exit 2 triggers, take 50% (25% of total entry) off at 61.8% Fib, leaving Exit 2 trailing stop values valid. Exit 4: exit the full position at the FIB 100% value. Exit 5: all trades must be closed at 3pm UTC-6 (4PM EST). So basically Take Profit are 50%-25%-25% of position.
Code has been written by © Hiubris_Indicators who has been an amazing coder and gave me the possibility to make this script public so a really big shoutout to him.
This indicator only works for alerts, please check version without alerts to backtest or tweaks. This indicator is meant to be used to automate the system via webhooks

PlurexSignalIntegrationLibrary "PlurexSignalIntegration"
Provides tools for integrating Strategies and Alerts into plurex.io signals.
plurexMarket() Build a Plurex market from a base and quote asset symbol.
Returns: A market string that can be used in Plurex Signal messages.
tickerToPlurexMarket() Builds simple Plurex market string from the syminfo
Returns: A market string that can be used in Plurex Signal messages.
simpleMessage(secret, action, marketOverride) Builds simple Plurex Signal Messages
Parameters:
secret : The secret for your Signal on plurex
action : The action of the message. One of .
marketOverride : Optional, defaults to the syminfo for the ticker. Use the `plurexMarket` function to build your own.
Returns: A json string message that can be used in alerts to send messages to Plurex.
executeStrategy(secret, openLong, openShort, closeLongs, closeShorts, marketOverride) Executes strategy actions with Plurex Signal messages
Parameters:
secret : The secret for your Signal on plurex
openLong : Strategy should open long if true, aggregated with other boolean values
openShort : Strategy should open short if true, aggregated with other boolean values
closeLongs : Strategy should close longs if true, aggregated with other boolean values
closeShorts : Strategy should close shorts if true, aggregated with other boolean values
marketOverride : Optional, defaults to the syminfo for the ticker. Use the `plurexMarket` function to build your own.

QFL single TF with alertsBacktesting compatible QFL pine script w/alerts
This version of QFL was made based on this one:
From author:
www.tradingview.com
I made the following additions according to my requirements:
- I need to use pine script 4
- I needed to avoid repainting issues so I'm not calling directly security, I'm using the wrapper function.
- There might be still repainting issues when you use "max base age" which uses the function "barssince" so be careful, you can disable it by setting its value to zero.
- Alerts so I can use it for automated trading and bots
- In order to make this signal compatible with the backtest script there's an option provided in the settings. If you enable this option this indicator will plot 1 whenever there's a BUY signal. This will allow the backtest to pick the "QFL Buy" from external indicator so it can perform the backtest.
I recommend some of these settings to start playing with the chart in 15 min / QFL in 1, 2 or 4 hours.
The higher the TF the more conservative.
QFL with 3.5% is pretty popular but you can try higher QFL percentage settings for a more conservative approach.

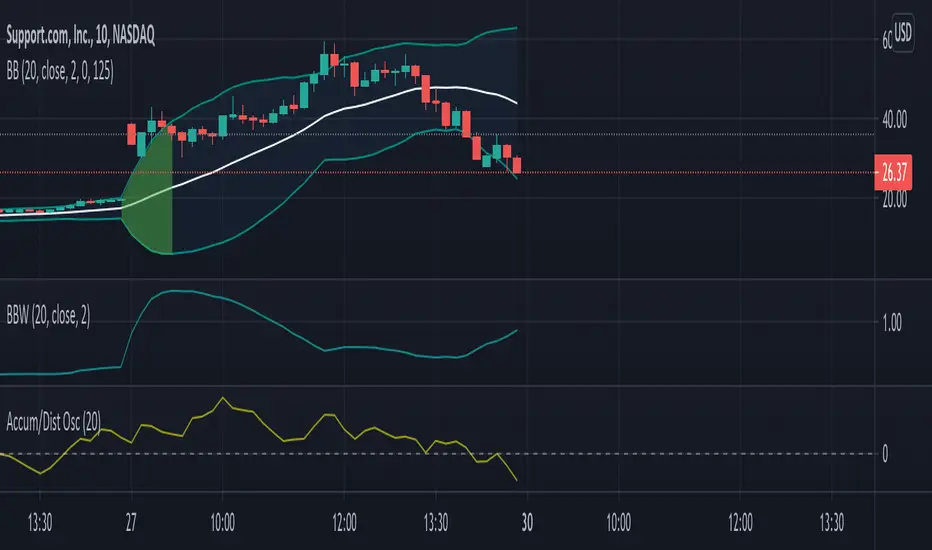
Bollinger Bands w/ Squeeze AlertBollinger's "simple" explanation for a Squeeze is the lowest volatility in the last 6 months. This indicator uses a default look-back period of 125 bars to determine the lowest BandWidth. When current BandWidth drops below the lowest BandWidth of the look-back period, the background of the bands turns red. Default look-back of 125 bars is ~6 months on daily charts.
The source, length, and standard deviation for the Bollinger Bands can all be adjusted. The look-back period for the Squeeze indicator can be adjusted as well.
The image shows my Bollinger Bands w/ Squeeze Alert indicator next to someone else's Bollinger Bandwidth w/ Squeeze Alert indicator to demonstrate how it appears on the chart.
EMA+RSI Pump & Drop Swing Sniper (SL+TP) - StrategyThis is the strategy version of the 'EMA-RSI-Pump-Drop-Swing-Sniper-With-Alerts':
Some additions with this strategy:
~Added Stop loss & Take profit control. In Settings > Inputs if the Stop Loss is at .051 that means it's 5.1% and the Take Profit at .096 is 9.6%. If you wish to remove the TP and SL just change the value to 1.00 and it would be the same as it being 100% TP and SL which is likely to never be hit.
~Added Backtesting by changing the month/date/year in Settings > Inputs
~Added a 2nd EMA line to assist with the long entry signals. I only use this for long entry & exits, though you could use the long exits as Short entries too. I just personally don't do short trading on Bitcoin.
This is using an EMA and RSI with slightly modified settings to give good entry and exit points while looking at Bitcoin. I use this on a 1-hour and 4-hour chart and with other indicators to find good positions to enter a trade or exit if things are turning red.
It's important to know this strategy was made as a request by another user that was using the indicator version. I don't use this as a trading strategy by itself, I use the visuals it gives as a confirmation with other indicators to find the best possible entry and exit positions.
If you click on the EMA line it will color the bars of the chart based on if they are above or below the EMA - This is just visually helpful for me to see the active trend.
Make sure you hover over or click on the EMA line to see the colors of the candles change - it's not visible by default or without doing this.

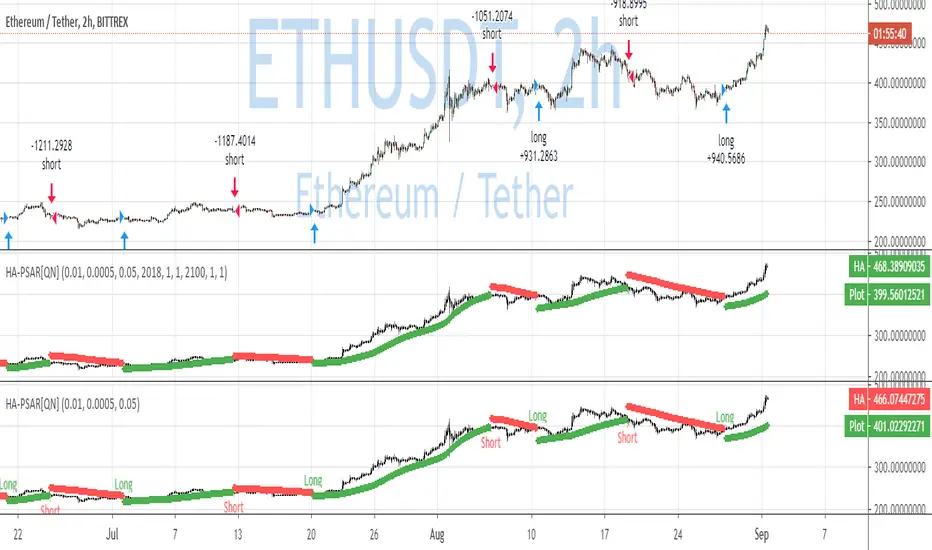
QuantNomad - Heikin-Ashi PSAR AlertsUsing this script you can create alerts for my Heikin-Ashi PSAR Strategy:
When creating alerts use "Once Per Bar Close" in parameters.
####################
Disclaimer
Please remember that past performance may not be indicative of future results.
Due to various factors, including changing market conditions, the strategy may no longer perform as good as in historical backtesting.
This post and the script don’t provide any financial advice.
Ichimoku Clouds Strong Bullish/Bearish signals and alertsIchimoku Clouds Strong Bullish/Bearish signals with allerts
The Ichimoku cloud was developed by Goichi Hosoda, a Japanese journalist, and published in the late 1960s. It provides more data points than the standard candlestick chart. While it seems complicated at first glance, those familiar with how to read the charts often find it easy to understand with well-defined trading signals.
We provide you easy-to-use script which helps to decrypt meaning of lines in the indicator. The script takes Ichimoku clouds indicator formulas to calculate Tenkan, Kijun, SenkouA, SenkouB values and examines them in order to produce buy ( Bullish ) and sell ( Bearish ) signals which are displayed at the chart
The most appropriate time frame is 30m
Custom alerts are added to send you a notice with a webhook when bullish or bearish signal arrives.
You can easily add weak and neutral signals alerts by removing "//" in a specified place
Feel free to copy and use this script for your ideas and trading. You can modify the script by adding Parabolic SAR in order to increase accuracy of positions closure

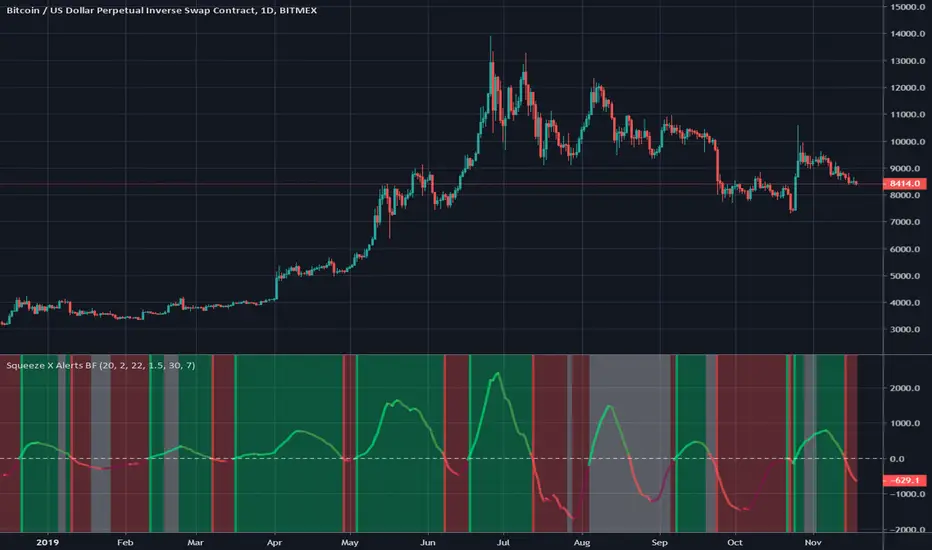
Squeeze X Alerts BFThis is an alerts script for my Squeeze X strategy .
The default settings are the same. The alerts are based on the long and short signals that occur upon a cross of the momentum line to the positive or negative respectively.
Green background is bullish, red is bearish. Bright green lines indicate a long signal, bright red a short signal.
White background means no trade since we are in a period of choppy/sideways price action.
It can be useful to use momentum as a divergence indicator against price as an aside.
QQE Cross v6.0 by JustUncleL w-Long-Short Alerts by sscoginThis script provides long and short alerts along with take profit alerts for either long or short positions. Based on the MA color changes set up originally in the script by JustUncleL.

CONSENSIO 3 MA ALERTThis Alert Indicator is based on the Consensio Trading System, Created by an Amazing Man; The Late Tyler Jenks.
The Consensio Investing and trading System was Designed to find and Scale Entry & Exit points within an Asset, with Preserving Capital, and with getting "90% of the Cookie" ... as Tyler would say.
For a Basic Introduction to Consensio, Please Visit the Hyperwave Youtube Channel, and View the Archived Video's. www.youtube.com
For a more in depth understanding of Consensio, consider Purchasing the Introduction and Advanced Consensio Webinars. lucidinvestmentstrategies.com
Thank you Tyler, for generously sharing your Extensive knowledge with Investing and Trading, and for Creating an Amazing Community of People from around the Globe, who Continue to bring your Knowledge and Life's Work forward, for Future Generations to Learn.
...This Script, once loaded, can be Edited and re saved within the Script Editor, to Change the Alert Signal Wording.

QuantNomad - Pivot Points AlertsVery simple scripts that will allow you to receive alerts for new Pivot Lows/Highs Points.
A solid arrow points to actual point low/high point, transparent - to the bar, you'll receive alerts for (Shifter by rightBars).
And remember:
Past performance does not guarantee future results.

Dragon Bot - Default ScriptDragon Script is a framework to make it as easy as possible to test your own strategies and set alerts for external execution bots.
The script has many features build in, like:
1) A ping/pong mechanism between longs and shorts
2) A stop-loss
3) Trailing Stops with several ways to calculate them.
4) 2 different ways to flip from long to short.
The script is divided into several parts.
The first part of the script is used to set all the variables. You should normally never change the first part except for the comments at the top.
The second part of the script is the part where you initialise all your indicators. Several indicators can be found on Tradingview and on other sites. Please keep in mind that all the variable names used in the indicator should be unique. (all the … = … parts)
The third part of the script, is the most important part of the script. Here you can create the entry and exit points.
Let’s look at the OPENLONG function to explain this part: The first variables are all the possible entries; These are longentry1 till longentry5. You can add many more if you like.
The variables are all initialised as being false. This way the script can set a value to true if an entry happens.
The if function is the actual logic: You could say “if this is true” then (the line below the if function) longentry1 := (becomes) true.
In this case we have said: “if this is true” then (the line below the if function) longentry1 := (becomes) true when the current close is larger than the close that is 1 back.
The last part is the makelong_funct. This part says that if any of the entries are true, the whole function is true.
The last part of the script is the actual execution. Here the alerts are plotted and the back test strategies are opened and closed.
We hope you guys like it and all feedback is welcome!


Steroid CCI w/ Overbought & Oversold Alert//@version=2
//By Tantamount
//Channel Commodity Index (CCI) with overbought and oversold alert features! Highly configurable indicator that includes a Topography map feature, used to detect & show minute threshold crosses.
//CCI is a momentum based technical trading tool used to help determine when an asset is reaching an overbought or oversold condition and is an great alternative to RSI.
//This CCI tool comes loaded with features and is easily configurable back to standard CCI or with your own preferences.
Customize to your liking:
Simple alert signals
The full enchilada, with Topo map view!
Stand alone CCI oscillator

Inside Bar Alert I need help!!! I created the alert but it triggering during the formation not once it has printed. Does anyone know who to make it trigger the alert once the inside bar is complete and make it plot an arrow when the inside bar has formed?

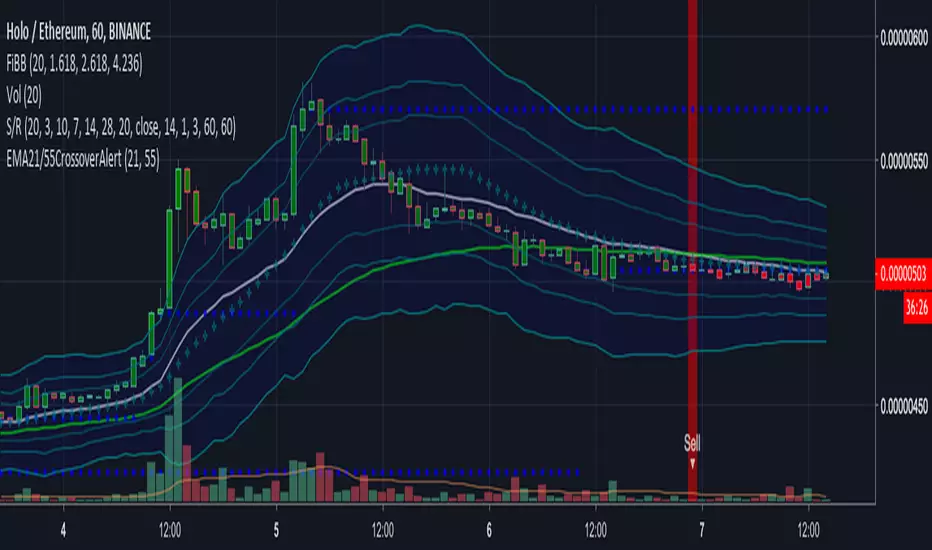
EMA21/55 Crossover AlertThis will alert on EMA crossovers. Alert for 21 crossover and crossunder. Work in progress.
Tenkan Kijun Cross Alert Modified to alert on EqualsI wanted it to alert on equals not only on crossover

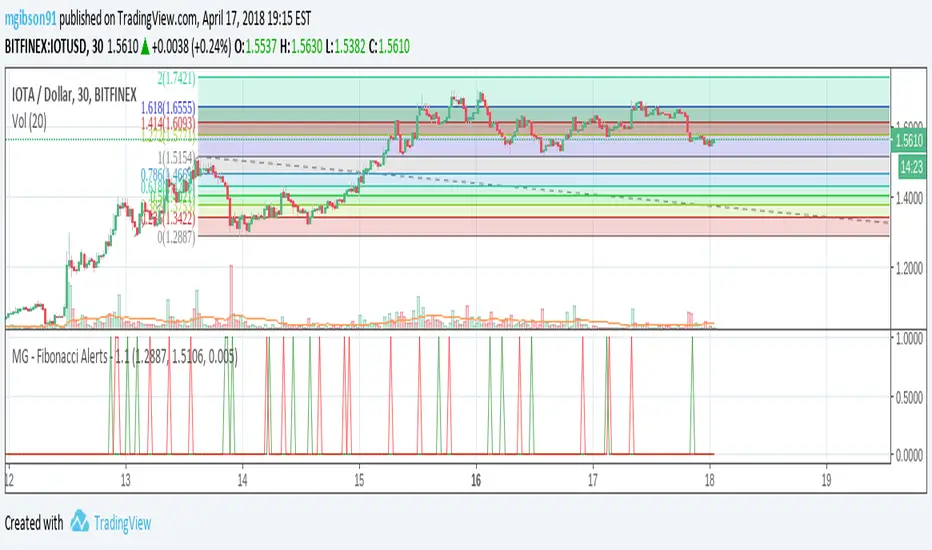
MG - Fibonacci Alerts - 1.1Updated version of
Allows users to receive alerts when price reach a new Fibonacci level.
By default, the Fibonacci levels extend upwards. This can be changed to extend downwards by unchecking 'Extend Upwards' option.
Usage:
- Perform a Fib extension analysis and determine a high value, low value and direction of extension
- Add indicator and specify these values
- Optionally, to view the levels used by the indicator on the main chart, copy the indicator source and:
- Set overlayed = true
- Set highPrice and lowPrice to your determined values (optional, but will save re-entering them later)
- Add to chart
- This will show you the exact levels used by the indicator
- Set overlayed = false
- Remove and re-add the indicator