Smart RSI Divergence PRO | Auto Lines + Alerts📌 Purpose
This indicator automatically detects Regular and Hidden RSI Divergences between price action and the RSI oscillator.
It plots divergence lines directly on the chart, labels signals, and includes alerts for automated monitoring.
🧠 How It Works
1. RSI Calculation
RSI is calculated using the selected Source (default: Close) and RSI Length (default: 14).
2. Divergence Detection via Fractals
Swing points on both price and RSI are detected using fractal logic (5-bar patterns).
Regular Divergence:
Bearish: Price forms a higher high, RSI forms a lower high.
Bullish: Price forms a lower low, RSI forms a higher low.
Hidden Divergence:
Bearish: Price forms a lower high, RSI forms a higher high.
Bullish: Price forms a higher low, RSI forms a lower low.
3. Auto Drawing Lines
Lines are drawn automatically between divergence points:
Red = Regular Bearish
Green = Regular Bullish
Orange = Hidden Bearish
Blue = Hidden Bullish
Line width and transparency are adjustable.
4. Labels and Alerts
Labels mark divergence points with up/down arrows.
Alerts trigger for each divergence type.
📈 How to Use
Use Regular Divergences to anticipate trend reversals.
Use Hidden Divergences to confirm trend continuation.
Combine with support/resistance, trendlines, or volume for higher probability setups.
Recommended Timeframes: Works on all timeframes; more reliable on 1h, 4h, and Daily.
Markets: Forex, Crypto, Stocks.
⚙️ Inputs
Source (Close, HL2, etc.)
RSI Length
Toggle Regular / Hidden Divergence visibility
Toggle Lines / Labels
Line Width & Line Transparency
⚠️ Disclaimer
This script is for educational purposes only. It does not constitute financial advice.
Always test thoroughly before using in live trading.
Cari skrip untuk "alert"

EMA 8/21/50 + VWAP Crossover Alert IndicatorOverview of the Indicator
This is a custom Pine Script v5 indicator for TradingView titled "EMA 8/21/50 + VWAP Crossover Alert Indicator" (short title: "EMA+VWAP Cross Alert"). It's designed as an overlay indicator, meaning it plots directly on your price chart rather than in a separate pane. The primary purpose is to detect and alert on crossovers between the 8-period Exponential Moving Average (EMA) and the 21-period EMA, which can signal potential bullish or bearish momentum shifts. These are classic short-term trend reversal or continuation signals often used in trading strategies like momentum or swing trading.
To enhance analysis, it also includes:
A 50-period EMA for medium-term trend context (e.g., to confirm if the overall trend aligns with the crossover).
A Volume Weighted Average Price (VWAP) line, which provides a benchmark for the average price weighted by volume, useful for identifying intraday value areas or fair price levels.
The indicator works across all timeframes (e.g., Daily, 4H, 1H, 15M, 5M, 3M) because the calculations are based on the chart's current bars and adapt to volatility and data resolution. It's not a trading strategy (no entry/exit logic or backtesting), but an alert tool—signals are visual and can trigger notifications in TradingView. Always combine it with risk management, as crossovers can produce false signals in ranging or choppy markets.

A.K Dynamic EMA/SMA / MTF S&R Zones Toolkit with AlertsThe A.K Dynamic EMA/SMA / MTF Support & Resistance Zones Toolkit is a powerful all-in-one technical analysis tool designed for traders who want a clean yet comprehensive market view. Whether you're scalping lower timeframes or swing trading higher timeframes, this indicator gives you both the structure and signals to take action with confidence.
Key Features:
✅ Customizable EMA/SMA Suite
Display key Exponential and Simple Moving Averages including 5, 9, 20, 50, 100, and 200 EMAs, plus optional 50 SMA for trend filtering. Each line can be toggled individually and color-customized.
✅ Multi-Timeframe Support & Resistance Zones
Automatically detects dynamic S/R zones on key timeframes (5min, 15min, 30min, 1H, 4H, 1D) using swing highs/lows. Zones are color-coded by strength and whether they're broken or active, providing a clear visual roadmap for price reaction levels.
✅ Zone Strength & Break Detection
Distinguishes between strong and weak zones based on price proximity and reaction depth, with visual shading and automatic label updates when a level is broken.
✅ Price Action-Based Buy/Sell Signals
Generates BUY signals when bullish candles react to strong support (supply) zones, and SELL signals when bearish candles react to strong resistance (demand) zones. All logic is adjustable — including candle body vs wick detection, tolerance range, and strength thresholds.
✅ Alerts Engine
Built-in TradingView alerts for price touching support/resistance or triggering buy/sell signals. Perfect for automation or hands-free monitoring.
✅ Optional Candle & Trend Filters
Highlight bullish/bearish candles visually for additional confirmation.
Optional RSI display and 50-period SMA trend filter to guide directional bias.
🧠 Use Case Scenarios:
Identify dynamic supply & demand zones across multiple timeframes.
Confirm trend direction with EMAs and SMA filters.
React quickly to clean BUY/SELL signals based on actual price interaction with strong zones.
Customize it fully to suit scalping, day trading, or swing trading strategies.
📌 Recommended Settings:
Use default zone transparency (65%) and offset (250 bars) for optimal visual clarity.
Enable alerts to get notified when price enters key S/R levels or when a trade signal occurs.
Combine this tool with your entry/exit plan for better decision-making under pressure.
💡 Pro Tip: Add this indicator to a clean chart and let the zones + EMAs guide your directional bias. Use alerts to avoid screen-watching and improve discipline.
Created by:
Version: Pine Script v6
Platform: TradingView

MACD Bullish Cross Alert📘 Indicator Description – MACD Bullish Cross Alert
This indicator is designed to detect bullish momentum shifts using the classic MACD (Moving Average Convergence Divergence) crossover strategy.
Key Features:
Calculates the MACD Line and Signal Line using customizable inputs (default: 12, 26, 9).
Triggers an alert when the MACD Line (blue) crosses above the Signal Line (orange).
Helps identify early bullish trend reversals or momentum entry points.
Ideal for swing traders, position traders, and crypto investors using the weekly timeframe.
How to Use:
Add to any chart and set the timeframe to 1W (weekly).
Create an alert using the built-in MACD Bullish Crossover condition.
Combine with price action, volume, or RSI for higher conviction entries.
Use Cases:
Spotting early entry points after long downtrends.
Confirming a trend reversal in high timeframes.
Generating high-probability entries in trend-following systems.

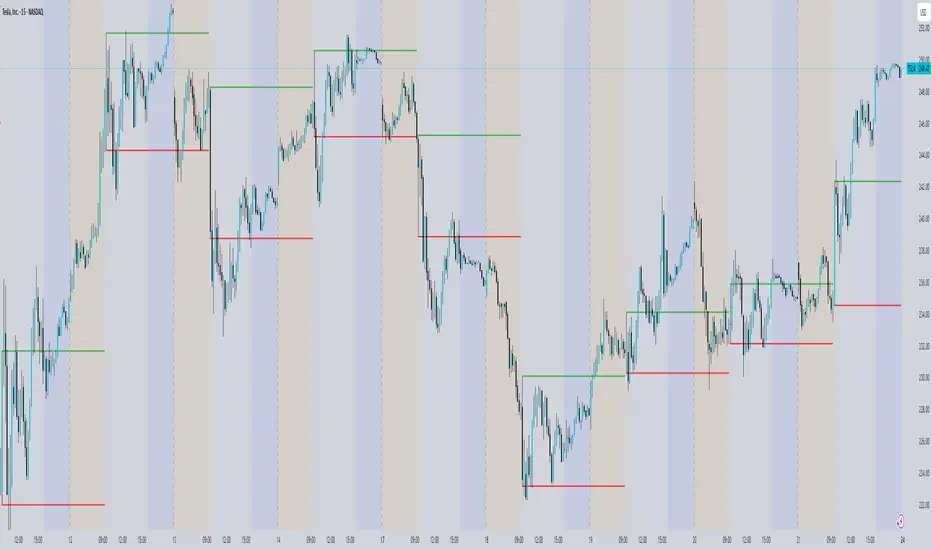
ORB with Alerts - Current Day OnlyORB with Alerts - Current Day Only
This script plots the Opening Range Breakout (ORB) levels and provides alerts when price breaks above or below the range. It is designed for intraday trading and resets daily.
How It Works:
The ORB time in settings should be set to 15 minutes.
The Session Time should be set to 09:30 - 09:45.
The script marks the high and low of the ORB period and tracks price action for breakouts.
Alerts trigger when price crosses above the ORB high or below the ORB low.
This tool helps traders identify breakout opportunities based on early price action, aiding in momentum-based strategies
RSI Failure Swing Pattern (with Alerts & Targets)RSI Failure Swing Pattern Indicator – Detailed Description
Overview
The RSI Failure Swing Pattern Indicator is a trend reversal detection tool based on the principles of failure swings in the Relative Strength Index (RSI). This indicator identifies key reversal signals by analyzing RSI swings and confirming trend shifts using predefined overbought and oversold conditions.
Failure swing patterns are one of the strongest RSI-based reversal signals, initially introduced by J. Welles Wilder. This indicator detects these patterns and provides clear buy/sell signals with labeled entry, stop-loss, and profit target levels. The tool is designed to work across all timeframes and assets.
How the Indicator Works
The RSI Failure Swing Pattern consists of two key structures:
1. Bullish Failure Swing (Buy Signal)
Occurs when RSI enters oversold territory (below 30), recovers, forms a higher low above the oversold level, and finally breaks above the intermediate swing high in RSI.
Step 1: RSI dips below 30 (oversold condition).
Step 2: RSI rebounds and forms a local peak.
Step 3: RSI retraces but does not go below the previous low (higher low confirmation).
Step 4: RSI breaks above the previous peak, confirming a bullish trend reversal.
Buy signal is triggered at the breakout above the RSI peak.
2. Bearish Failure Swing (Sell Signal)
Occurs when RSI enters overbought territory (above 70), declines, forms a lower high below the overbought level, and then breaks below the intermediate swing low in RSI.
Step 1: RSI rises above 70 (overbought condition).
Step 2: RSI declines and forms a local trough.
Step 3: RSI bounces but fails to exceed the previous high (lower high confirmation).
Step 4: RSI breaks below the previous trough, confirming a bearish trend reversal.
Sell signal is triggered at the breakdown below the RSI trough.
Features of the Indicator
Custom RSI Settings: Adjustable RSI length (default 14), overbought/oversold levels.
Buy & Sell Signals: Buy/sell signals are plotted directly on the price chart.
Entry, Stop-Loss, and Profit Targets:
Entry: Price at the breakout of the RSI failure swing pattern.
Stop-Loss: Lowest low (for buy) or highest high (for sell) of the previous two bars.
Profit Targets: Two levels calculated based on Risk-Reward ratios (1:1 and 1:2 by default, customizable).
Labeled Price Levels:
Entry Price Line (Blue): Marks the point of trade entry.
Stop-Loss Line (Red): Shows the calculated stop-loss level.
Target 1 Line (Orange): Profit target at 1:1 risk-reward ratio.
Target 2 Line (Green): Profit target at 1:2 risk-reward ratio.
Alerts for Trade Execution:
Buy/Sell signals trigger alerts for real-time notifications.
Alerts fire when price reaches stop-loss or profit targets.
Works on Any Timeframe & Asset: Suitable for stocks, forex, crypto, indices, and commodities.
Why Use This Indicator?
Highly Reliable Reversal Signals: Unlike simple RSI overbought/oversold strategies, failure swings filter out false breakouts and provide strong confirmation of trend reversals.
Risk Management Built-In: Stop-loss and take-profit levels are automatically set based on historical price action and risk-reward considerations.
Easy-to-Use Visualization: Clearly marked entry, stop-loss, and profit target levels make it beginner-friendly while still being valuable for experienced traders.
How to Trade with the Indicator
Buy Trade Example (Bullish Failure Swing)
RSI drops below 30 and recovers.
RSI forms a higher low and then breaks above the previous peak.
Entry: Buy when RSI crosses above its previous peak.
Stop-Loss: Set below the lowest low of the previous two candles.
Profit Targets:
Target 1 (1:1 Risk-Reward Ratio)
Target 2 (1:2 Risk-Reward Ratio)
Sell Trade Example (Bearish Failure Swing)
RSI rises above 70 and then declines.
RSI forms a lower high and then breaks below the previous trough.
Entry: Sell when RSI crosses below its previous trough.
Stop-Loss: Set above the highest high of the previous two candles.
Profit Targets:
Target 1 (1:1 Risk-Reward Ratio)
Target 2 (1:2 Risk-Reward Ratio)
Final Thoughts
The RSI Failure Swing Pattern Indicator is a powerful tool for traders looking to identify high-probability trend reversals. By using the RSI failure swing concept along with built-in risk management tools, this indicator provides a structured approach to trading with clear entry and exit points. Whether you’re a day trader, swing trader, or long-term investor, this indicator helps in capturing momentum shifts while minimizing risk.
Would you like any modifications or additional features? 🚀

FuTech : MACD Crossovers Advanced Alert Lines=============================================================
Indicator : FuTech: MACD Crossovers Advanced Alert Lines
Overview:
The "FuTech: MACD Crossovers Advanced Alert Lines" indicator is designed to assist traders in identifying key technical patterns using the :-
1. MACD (Moving Average Convergence Divergence) and
2. Golden/Death Crossovers
By visualizing these indicators directly on the chart with advanced lines, it helps traders make more informed decisions on when to enter or exit trades.
=============================================================
Key Features of "FuTech: MACD Crossovers Advanced Alert Lines":
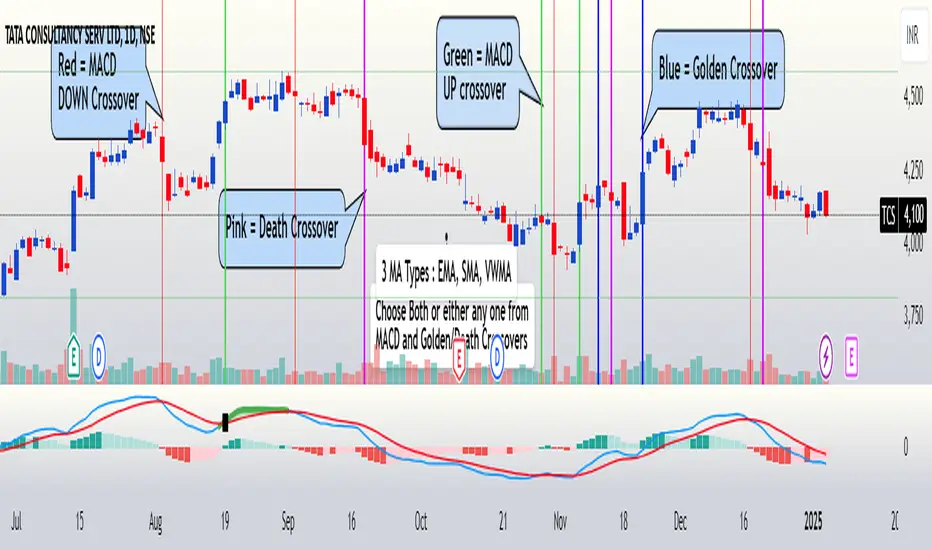
1. MACD Crossovers:
a) The MACD is one of the most widely used indicators for identifying momentum shifts and potential buy/sell signals. This indicator plots vertical lines on the chart whenever the MACD line crosses the signal line.
b) Upward Crossover (Bullish Signal) : When the MACD line crosses above the signal line, a green vertical line will appear, indicating a potential buying opportunity.
c) Downward Crossover (Bearish Signal) : When the MACD line crosses below the signal line, a red vertical line will appear, signaling a potential selling opportunity.
2. Golden Cross & Death Cross:
a) The Golden Cross occurs when the price moves above a long-term moving average (like the 50-day moving average), signaling a potential upward trend.
b) The Death Cross occurs when the price moves below a long-term moving average, signaling a potential downward trend.
c) These crossovers are displayed with customizable lines on the chart to easily spot when the market is shifting direction.
d) Golden Cross (Bullish Signal) : A blue vertical line appears when the price crosses above the selected long-term moving average.
e) Death Cross (Bearish Signal) : A purple vertical line appears when the price crosses below the selected long-term moving average.
=============================================================
Customization Options:
This indicator offers several customization options to suit your trading preferences:
1) MACD Settings:
a) Choose between different moving average types (EMA, SMA, or VWMA) for calculating the MACD.
b) Adjust the lengths of the fast, slow, and signal MACD periods.
c) Control the width and color of the vertical lines drawn on the chart for both up and down crossovers.
2) Golden Cross / Death Cross Settings:
a) Select the moving average type for the Golden Cross / Death Cross (EMA, SMA, or VWMA).
b) Define the lookback period for calculating the Golden Cross / Death Cross.
c) Customize the appearance of the Golden and Death Cross lines, including their width and color.
You can use both as well as either of the MACD lines or Golden Crossover / Death Crossover Lines respectively as per your trading strategies
=============================================================
How "FuTech: MACD Crossovers Advanced Alert Lines" indicator Works:
a) The indicator monitors the price and calculates the MACD and Golden/Death Crosses.
b) When the MACD line crosses above or below the signal line, or when the price crosses above or below the long-term moving average, it plots a vertical line on the chart.
c) These lines help traders quickly spot potential turning points in the market, providing clear signals to act upon.
=============================================================
Use Case:
a) Swing Traders: The indicator is useful for spotting momentum shifts and trend reversals, helping you time entries and exits for short- to medium-term trades.
b) Long-Term Traders: The Golden and Death Cross signals help identify major trend changes, giving insights into potential market shifts.
=============================================================
Why Use This "FuTech: MACD Crossovers Advanced Alert Lines" Indicator ?
a) Clear Visuals : The vertical lines provide clear and easy-to-spot signals for MACD crossovers and Golden/Death Crosses.
b) Customizable : Adjust settings for your personal trading strategy, whether you're focusing on short-term momentum or long-term trend shifts.
c) Supports Decision Making : With its advanced line plotting and customizable features, this indicator helps you make quicker and more informed trading decisions.
=============================================================
How to Use:
a) MACD Crossovers: Look for green lines to signal potential buying opportunities (when the MACD line crosses above the signal line) and red lines for selling opportunities (when the MACD line crosses below the signal line).
b) Golden Cross / Death Cross: Use the blue lines to confirm when a positive trend may begin (Golden Cross) and purple lines to warn when a negative trend may start (Death Cross).
=============================================================
Conclusion:
"FuTech: MACD Crossovers Advanced Alert Lines" indicator combines two powerful technical analysis tools, the MACD and Golden/Death Crosses, to provide clear, actionable signals on your chart.
By customizing the appearance of these signals and combining them with your trading strategy, you can enhance your decision-making process and improve your trading outcomes.
=============================================================
Thank you !
Jai Swaminarayan Dasna Das !
He Hari ! Bas Ek Tu Raji Tha !
=============================================================
Z Value AlertZ Value Alert analyzes daily price movements by evaluating fluctuations relative to historical volatility. It calculates the daily percentage change in the closing price, the average of this change over 252 days, and the standard deviation. Using these values, a Z-Score is calculated, indicating how much the current price change deviates from the historical range of fluctuations.
The user can set a threshold in standard deviations (Z-Score). When the absolute Z-Score exceeds this threshold, a significant movement is detected, indicating increased volatility. The Z-Score is visualized as a histogram, and an alert can be triggered when a significant movement occurs.
The number of trading days used to calculate historical volatility is adjustable, allowing the Sigma Move Alert to be tailored to various trading strategies and analysis periods.
Additionally, a dropdown option for the calculation method is available in the input menu, allowing the user to select between:
Normal: Calculates the percentage change in closing prices without using the logarithm.
Logarithmic: Uses the natural logarithm of daily returns. This method is particularly suitable for longer timeframes and scientific analyses, as logarithmic returns are additive.
These comprehensive features allow for precise customization of the Sigma Move Alert to individual needs and specific market conditions.

MA Touch Alert SystemThis is a alert system This Pine Script creates an alert system in TradingView to notify you whenever the price touches a specified moving average. With adjustable settings, you can set your preferred moving average period, such as 50 or 200. The script calculates this moving average and triggers an alert if the price crosses it from above or below, enabling you to stay informed about important trend reversals. A visual on-chart label marks these points, and the alert condition ensures you receive notifications through TradingView. Perfect for traders looking to automate key level monitoring, this script supports trend-following and reversal strategies.

Order Block Overlapping Drawing [TradingFinder]🔵 Introduction
Technical analysis is a fundamental tool in financial markets, helping traders identify key areas on price charts to make informed trading decisions. The ICT (Inner Circle Trader) style, developed by Michael Huddleston, is one of the most advanced methods in this field.
It enables traders to precisely identify and exploit critical zones such as Order Blocks, Breaker Blocks, Fair Value Gaps (FVGs), and Inversion Fair Value Gaps (IFVGs).
To streamline and simplify the use of these key areas, a library has been developed in Pine Script, the scripting language for the TradingView platform. This library allows you to automatically detect overlapping zones between Order Blocks and other similar areas, and visually display them on your chart.
This tool is particularly useful for creating indicators like Balanced Price Range (BPR) and ICT Unicorn Model.
🔵 How to Use
This section explains how to use the Pine Script library. This library assists you in easily identifying and analyzing overlapping areas between Order Blocks and other zones, such as Breaker Blocks and Fair Value Gaps.
To add "Order Block Overlapping Drawing", you must first add the following code to your script.
import TFlab/OrderBlockOverlappingDrawing/1
🟣 Inputs
The library includes the "OBOverlappingDrawing" function, which you can use to detect and display overlapping zones. This function identifies and draws overlapping zones based on the Order Block type, trigger conditions, previous and current prices, and other relevant parameters.
🟣 Parameters
OBOverlappingDrawing(OBType , TriggerConditionOrigin, distalPrice_Pre, proximalPrice_Pre , distalPrice_Curr, proximalPrice_Curr, Index_Curr , OBValidGlobal, OBValidDis, MitigationLvL, ShowAll, Show, ColorZone) =>
OBType (string)
TriggerConditionOrigin (bool)
distalPrice_Pre (float)
proximalPrice_Pre (float)
distalPrice_Curr (float)
proximalPrice_Curr (float)
Index_Curr (int)
OBValidGlobal (bool)
OBValidDis (int)
MitigationLvL (string)
ShowAll (bool)
Show (bool)
ColorZone (color)
In this example, various parameters are defined to detect overlapping zones and draw them on the chart. Based on these settings, the overlapping areas will be automatically drawn on the chart.
OBType : All order blocks are summarized into two types: "Supply" and "Demand." You should input your Current order block type in this parameter. Enter "Demand" for drawing demand zones and "Supply" for drawing supply zones.
TriggerConditionOrigin : Input the condition under which you want the Current order block to be drawn in this parameter.
distalPrice_Pre : Generally, if each zone is formed by two lines, the farthest line from the price is termed Pervious "Distal." This input receives the price of the "Distal" line.
proximalPrice_Pre : Generally, if each zone is formed by two lines, the nearest line to the price is termed Previous "Proximal" line.
distalPrice_Curr : Generally, if each zone is formed by two lines, the farthest line from the price is termed Current "Distal." This input receives the price of the "Distal" line.
proximalPrice_Curr : Generally, if each zone is formed by two lines, the nearest line to the price is termed Current "Proximal" line.
Index_Curr : This input receives the value of the "bar_index" at the beginning of the order block. You should store the "bar_index" value at the occurrence of the condition for the Current order block to be drawn and input it here.
OBValidGlobal : This parameter is a boolean in which you can enter the condition that you want to execute to stop drawing the block order. If you do not have a special condition, you should set it to True.
OBValidDis : Order blocks continue to be drawn until a new order block is drawn or the order block is "Mitigate." You can specify how many candles after their initiation order blocks should continue. If you want no limitation, enter the number 4998.
MitigationLvL : This parameter is a string. Its inputs are one of "Proximal", "Distal" or "50 % OB" modes, which you can enter according to your needs. The "50 % OB" line is the middle line between distal and proximal.
ShowAll : This is a boolean parameter, if it is "true" the entire order of blocks will be displayed, and if it is "false" only the last block order will be displayed.
Show : You may need to manage whether to display or hide order blocks. When this input is "On", order blocks are displayed, and when it's "Off", order blocks are not displayed.
ColorZone : You can input your preferred color for drawing order blocks.
🟣 Output
Mitigation Alerts : This library allows you to leverage Mitigation Alerts to detect specific conditions that could lead to trend reversals. These alerts help you react promptly in your trades, ensuring better management of market shifts.
🔵 Conclusion
The Pine Script library provided is a powerful tool for technical analysis, especially in the ICT style. It enables you to detect overlapping zones between Order Blocks and other significant areas like Breaker Blocks and Fair Value Gaps, improving your trading strategies. By utilizing this tool, you can perform more precise analysis and manage risks effectively in your trades.

X48 - Strategy | BreakOut & Consecutive (11in1) + Alert | V.1.2================== Read This First Before Use This Strategy ==============
*********** Please be aware that this strategy is not a guarantee of success and may lead to losses.
*********** Trading involves risk and you should always do your own research before making any decisions.
================= Thanks Source Script and Explain This Strategy ===================
► Description
Write a detailed and meaningful description that allows users to understand how your script is original, what it does, how it does it and how to use it
This Strategy Are Combine Strategy and Indicators Alert Function For Systematic Trading User.
Strategy List, Thanks For Original Source Script , From Tradingview Build-in Script From fmzquant Github
// Channel BreakOut Strategy : Calculate BreakOut Zone For Buy and Sell.
// Consecutive Bars UP/Down Strategy : The consecutive bars up/down strategy is a trading strategy used to identify potential buy and sell signals in the stock market. This strategy involves looking for a series of bars (or candles) that are either all increasing or all decreasing in price. If the bars are all increasing, it can be a signal to buy, and if the bars are all decreasing, it can be a signal to sell. This strategy can be used on any timeframe, from a daily chart to an intraday chart.
// 15m Range Length SD : Range Of High and Low Candle Price and Lookback For Calculate Buy and Sell.
Indicators Are Simple Source Script (Almost I'm Chating With CHAT-GPT and Convert pinescript V4 to V5 again for complete almost script and combine after)
// SwingHigh and SwingLow Plot For SL (StopLoss by Last Swing).
// Engulfing and 3 Candle Engulfing Plot.
// Stochastic RSI for Plot and Fill Background Paint and Plot TEXT For BULL and BEAR TREND.
// MA TYPE MODE are plot 2 line of MA Type (EMA, SMA, HMA, WMA, VWMA) for Crossover and Crossunder.
// Donchian Fans MODE are Plot Dot Line With Triangle Degree Bull Trend is Green Plot and Bear Trend is Red Plot.
// Ichimoku Cloud Are Plot Cloud A-B For Bull and Bear Trend.
// RSI OB and OS for TEXT PLOT 'OB' , 'OS' you will know after OB and OS, you can combo with other indicators that's make you know what's the similar trend look like?
// MACD for Plot Diamond when MACD > 0 and MACD < 0, you can combo with other indicators that's make you know what's the similar trend look like?
Alert Can Alert Sent When Buy and Sell or TP and SL, you can adjust text to alert sent by your self or use default setting.
========== Let'e Me Explain How To Use This Strategy =============
========== Properties Setting ==========
// Capital : Default : 1,000 USDT For Alot Of People Are Beginner Investor = It's Capital Your Cash For Investment
// Ordersize : Default Are Setting 5% / Order We Call Compounded
========== INPUT Setting ==========
// First Part Use Must Choose Checkbox For Use of Strategy and Choose TP/SL by Swing or % (can choose both)
// In Detail Of Setting Are Not Too Much, Please Read The Header Of Setting Before Change The Value
// For The Indicator In List You Want To Add Just Check ✅ From MODE Setting, It's Show On Your Chart
// You Can Custom TP/SL % You Want
========== ##### No trading strategy is guaranteed to be 100% successful. ###### =========
For Example In My Systematic Trading
Select 1/3 Strategy Setting TP/SL % Match With Timeframe TP Long Are Not Set It's Can 161.8 - 423.6% but Short Position Are Not Than 100% Just Fine From Your Aset
Choose Indicators For Make Sure Trend and Strategy are the same way like Strategy are Long Position but MACD and Sto background is bear. that's mean this time not open position.
Donchian Fans is Simple Support and Ressistant If You Don't Know How To Plot That's, This indicator plot a simple for you ><.
Make Sure With Engulfing and 3 Candle Engulfing If You Don't Know, What's The Engulfing, This Indicator are plot for you too ><.
For a Big Trend You can use Ichimoku Cloud For Check Trend, Candle Upper Than Cloud or Lower Than Cloud for Bull and Bear Trend.

Strategy for UT Bot Alerts indicator Using the UT Bot alerts indicator by @QuantNomad, this strategy was designed for showing an example of how this indicator could be used, also, it has the goal to help some people from a group that use to use this indicator for their trading. Under any circumstance I recommend to use it without testing it before in real time.
Backtesting context: 2020-02-05 to 2023-02-25 of BTCUSD 4H by Tvc. Commissions: 0.03% for each entry, 0.03% for each exit. Risk per trade: 2.5% of the total account
For this strategy, 3 indicators are used:
UT Bot Alerts indicator by Quantnomad
One Ema of 200 periods for indicate the trend
Atr stop loss from Gatherio
Trade conditions:
For longs:
Close price is higher than Atr from UT Bot
Ema from UT Bot cross over Atr from UT Bot.
This gives us our long signal. Stop loss will be determined by atr stop loss (white point), break even(blue point) by a risk/reward ratio of 0.75:1 and take profit of 3:1 where half position will be closed. This will be showed as buy (open long position)
The other half will be closed when close price is lower than Atr and Ema from UT Bot cross under Atr. This will be showed as cl buy (close long position)
For shorts:
Close price is lower than Atr from UT Bot
Ema from UT Bot cross over Atr from UT Bot.
This gives us our short signal. Stop loss will be determined by atr stop loss (white point), break even(blue point) by a risk/reward ratio of 0.75:1 and take profit of 3:1 where half position will be closed. This will be showed as sell (open short position)
The other half will be closed when close price is higher than Atr and Ema from UT Bot cross over Atr. This will be showed as cl sell (close short position)
Risk management
For calculate the amount of the position you will use just a small percent of your initial capital for the strategy and you will use the atr stop loss for this.
Example: You have 1000 usd and you just want to risk 2,5% of your account, there is a long signal at price of 20,000 usd. The stop loss price from atr stop loss is 19,000. You calculate the distance in percent between 20,000 and 19,000. In this case, that distance would be of 5,0%. Then, you calculate your position by this way: (initial or current capital * risk per trade of your account) / (stop loss distance).
Using these values on the formula: (1000*2,5%)/(5,0%) = 500usd. It means, you have to use 500 usd for risking 2.5% of your account.
We will use this risk management for apply compound interest.
In settings, with position amount calculator, you can enter the amount in usd of your account and the amount in percentage for risking per trade of the account. You will see this value in green color in the upper left corner that shows the amount in usd to use for risking the specific percentage of your account.
Script functions
Inside of settings, you will find some utilities for display atr stop loss, break evens, positions, signals, indicators, etc.
You will find the settings for risk management at the end of the script if you want to change something. But rebember, do not change values from indicators, the idea is to not over optimize the strategy.
If you want to change the initial capital for backtest the strategy, go to properties, and also enter the commisions of your exchange and slippage for more realistic results.
In risk managment you can find an option called "Use leverage ?", activate this if you want to backtest using leverage, which means that in case of not having enough money for risking the % determined by you of your account using your initial capital, you will use leverage for using the enough amount for risking that % of your acount in a buy position. Otherwise, the amount will be limited by your initial/current capital
---> Do not forget to deactivate Trades on chart option in style settings for a cleaner look of the chart <---
Some things to consider
USE UNDER YOUR OWN RISK. PAST RESULTS DO NOT REPRESENT THE FUTURE.
DEPENDING OF % ACCOUNT RISK PER TRADE, YOU COULD REQUIRE LEVERAGE FOR OPEN SOME POSITIONS, SO PLEASE, BE CAREFULL AND USE CORRECTLY THE RISK MANAGEMENT
Do not forget to change commissions and other parameters related with back testing results!
Strategies for trending markets use to have more looses than wins and it takes a long time to get profits, so do not forget to be patient and consistent !
---> The strategy can still be improved, you can change some parameters depending of the asset and timeframe like risk/reward for taking profits, for break even, also the main parameters of the UT Bot Alerts <----

Large Candle (With Alert, You have to ENABLE it on chart)You have to enable alert after adding this indicator to a chart.
Right click on chart -> Create Alert -> Select Condition: "Large Candle"; and choose "Any alert() function call"
Alert action such as email, popup, sms etc can be checked -> Create.
Disclaimer: trade on your own risk.
This script adds alert function to the "Large Candle - Tracking Institutional Buy and Sell" which can be found here:
Source code is now open to all

Volume Spikes & Growing Volume Signals With Alerts & ScannerVOLUME SPIKES & GROWING VOLUME SIGNALS WITH ALERTS & SCANNER
This indicator shows arrows when there is a volume spike. It also paints the background when volume is growing. There is also a volume scanner for 8 tickers that will change color in real time when your other favorite tickers see volume growth and spikes.
You can customize the length of DMI, the number of bars to calculate the current volume average from, the number of bars back to get the overall volume average from, the multiple that needs to be hit to give a signal, the position of the scanner table and which tickers are used in the scanner. There are detailed directions as tooltips in the indicator settings you can read to understand exactly what each input does.
All features are customizable as well as which tickers the screener uses.
***HOW TO USE***
Watch for volume to pick up before placing trades as this will help you stay out of the markets when price is choppy. Volume usually brings volatility so watch for the volume signals to show up on the chart. Typically when price has made a big move one direction or is consolidating and you see the volume indicator start giving signals, the market is ready to reverse or continue its current trend but move faster in that direction.
Volume Spikes
When there is a volume spike that is larger than the average of volume over the last 100+ bars(depending on your settings) multiplied by the volume amount multiplier(in your settings) then an arrow will show up on the chart. This arrow will be green if DMI is bullish and red if DMI is bearish.
Volume Growth
A Background color will appear when the average volume over the last 5 bars(depending on your settings) is higher than the average volume over the last 100+ bars(depending on your settings) and is greater than your multiple. It will also paint the background when the volume moving average has increased over the last 3 bars consecutively. The background colors will be red or green depending on buy & sell pressure(DMI). If the background color appears, then you know volume is growing and volatility is near.
Volume Scanner
The scanner can be customized to have all of your favorite tickers by changing the tickers used in the indicator settings at the bottom. When no volume growth or spikes are detected, the ticker will show as light blue. When volume spikes or growth is detected, the ticker will turn orange to notify you.
Alerts
You can set up alerts as well when there is volume growth, bullish volume spikes and bearish volume spikes on any chart or timeframe.
Indicator Settings
Settings will need to be adjusted across different tickers as some have large swings in volume and some stay pretty even, so make sure to set up different chart layouts with settings that work for each ticker and save them individually so you don’t have to reset these values every time you switch charts.
***MARKETS***
This indicator can be used as a signal on all markets, including stocks, crypto, futures and forex as long as Tradingview has volume and DMI data for that ticker.
***TIMEFRAMES***
This volume spike indicator can be used on all timeframes as long as there is enough data for Tradingview to use for calculations.
***TIPS***
Try using numerous indicators of ours on your chart so you can instantly see the bullish or bearish trend of multiple indicators in real time without having to analyze the data. Some of our favorites are our Auto Fibonacci, Volume Profile, Momentum, Auto Support And Resistance and Money Flow Index in combination with this Volume Growth indicator. They all have real time Bullish and Bearish labels as well so you can immediately understand each indicator's trend.

MACD Alert [All MA in one] [Smart Crypto Trade (SCT)]This code is a gift from "Smart Crypto Trade (SCT)" group
MACD indicator contains 3 EMA, I think one of the best usage of MACD is trend detection and divergences.
In our indicator, you can select the type of Moving averages that used in macd.
You can using "MACD" based on several types of moving averages including:
Exponential Moving Average ( EMA )
Volume-Weighted Moving Average ( VWMA )
Simple Moving Average ( SMA )
Weighted Moving Average ( WMA )
Exponentially Weighted Moving Average (RMA) that used in RSI
Smoothed Moving Average ( SMMA )
Arnaud Legoux Moving Average ( ALMA )
Double EMA ( DEMA )
Double SMA (DSMA)
Double WMA (DWMA)
Double RMA (DRMA)
Triple EMA ( TEMA )
Triple SMA (TSMA)
Triple WMA (TWMA)
Triple RMA (TRMA)
Linear regression curve Moving Average ( LSMA )
Variable Index Dynamic Average ( VIDYA )
Fractal Adaptive Moving Average ( FRAMA )
In other words we tried to collect all the most popular MAs in our MACD indicator.
In addition, you can use four types of alert or alarm conditions for detection LONG or SHORT positions and trends. For this, you must set an alert in alert tab and set the condition based on four defaults conditions.
Enjoy

RSI band with Signal alert//th/en
//th
สวัสดีครับท่านสมาชิก
ก่อนอื่นต้องขอเกริ่นก่อนเลยว่า Indicator ตัวนี้ถูกสร้างขึ้นมาบนพื้นฐานของ RSI จริง เพียงแต่ใช้ค่า EMA27 ในการสร้าง เนื่องจากผมยังไม่สามารถเขียน RSI band ที่โยงกับราคาได้ในส่วนนี้เองได้
แต่ทั้งนี้ขอให้ท่านใจเย็น ๆ และฟังผมสักหน่อย เนื่องจากก่อนหน้านี้ผมได้สังเกตเห็นว่า EMA27 นั้นมีค่าเท่ากับ RSI14 ที่ค่า 50 พอดี ดังนั้นผมจึงเลือกที่จะสร้างมันขึ้นมาด้วย EMA27 เพราะง่ายต่อการเขียน
วิธีการใช้งานมีดังต่อไปนี้
Indicator ตัวนี้ใช้งานเหมือน RSI14 วิธีการอ่านคือให้นับเส้น EMA27 เป็นค่า 50 ของ RSI14 ดังนั้นให้เราพิจารณาการซื้อขายดังต่อไปนี้ (โดยหลังจากนี้ผมจะเรียก EMA27 ที่สร้างขึ้นว่า RSI band)
พิจารณาเข้าซื้อ : เมื่อราคาทะลุ RSI band ขึ้นไปและย่อตัวทำ Higher Low เหนือเส้น RSI band
พิจารณาขายออก : เมื่อราคาทะลุ RSI band ลงมาและรีบาวน์ทำ Lower High ใต้เส้น RSI band
# ทั้งนี้ผมได้ทำสีแท่งเทียนไว้เพื่อให้ง่ายต่อการสังเกต โดยการนำไปใช้อาจนำสีของเส้นขอบแท่งเทียนออก แล้วในส่วนของไส้แท่งเทียนให้ใช้สีที่ไม่เจาะจงราคาบวกลบอย่างสี #434651
โดยเราสามารถดู Divergence โดยการเทียบความต่างระหว่างราคาและ RSI band ได้ดังนี้
ในแนวโน้มขาลง : ให้เปรียบเทียบความต่างระหว่างราคากับ RSI band ของ Lower Low ปัจจุบันกับ Low ก่อนหน้า โดยถ้าความต่างของ Low ลดลงเรื่อย ๆ จนราคาเข้าใกล้เส้น RSI band ให้พิจารณาเข้าซื้อ
ในแนวโน้มขาขึ้น : ให้เปรียบเทียบความต่างระหว่างราคากับ RSI band ของ Higher High ปัจจุบันกับ High ก่อนหน้า โดยถ้าความต่างของ High ดลงเรื่อย ๆ จนราคาเข้าใกล้เส้น RSI band ให้พิจารณาขายออก
ทั้งนี้ผมได้สร้าง Signal alert ไว้เพื่อให้ง่ายต่อการสังเกต โดยสร้างมาจากเงื่อนไขดังนี้ (ห้ามทำการซื้อขายตาม Signal alert เด็ดขาด เพราะเค้าแค่บอกจุดตามเงื่อนไขที่ตั้งไว้ บางทีอาจมีสัญญาณซื้อแล้วให้ซื้อต่อโดยไม่มีสัญญาณขายเลยก็ได้)
Buy : เมื่อ RSI14 ตัดขึ้นที่ค่า 50 พร้อมกับ RSI14 ตัดขึ้น Signal ที่ผมตั้งไว้ (ผมใช้ EMA7 ของ RSI14)
Prepare to Sell : เมื่อ RSI14 ตัดลง Signal ในขณะที่ RSI14 นั้น มีค่ามากกว่า 70
Sell/Short Top : เมื่อ RSI14 ตัดลงที่ค่า 70 พร้อมกับ RSI14 ตัดลง Signal (จะมีขึ้นแสดงว่า Peak ในกราฟ)
Buy : เมื่อ RSI14 ตัดลงที่ค่า 50 พร้อมกับ RSI14 ตัดลง Signal
Prepare to Buy : เมื่อ RSI14 ตัดขึ้น Signal ในขณะที่ RSI14 นั้น มีค่าน้อยกว่า 30
TP Short/Buy Bottom : เมื่อ RSI14 ตัดขึ้นที่ค่า 30 พร้อมกับ RSI14 ตัดขึ้น Signal (จะมีขึ้นแสดงว่า Deep ในกราฟ)
# สาเหตุที่ใส่ข้อความใน Signal alert เพียงแค่ตอน Sell/Short Top และ TP Short/Buy Bottom เพื่อลดโอกาสเกิดการแพนิคที่เกิดจากการสังเกตได้ โดยในสัญญาณตัวอื่นจะมีแค่เครื่องหมาย * เพียงอย่างเดียว
ขอให้โชคดีครับ
Firstssk
////////////////////////////////////////////////////////////////////////////////////////////////////////////////////////////////////////////////////////////////////////////////////
//en (Google Translate)
Hello, Trader
First of all, I have to say that this indicator is built on the basis of a real RSI, just using the EMA27 value to create it, since I still can't write an RSI band that is tied to the price in this section.
But please be patient and listen to me a bit. Since I previously noticed that EMA27 is exactly equal to RSI14 at 50, so I chose to build it with EMA27 because it's easier to write.
Here's how to use it:
This indicator works like RSI14. The reading method is to count the EMA27 line as the 50 value of RSI14, so let's consider the following trading. (After this I will call the created EMA27 RSI band)
Consider buying : When the price breaks the RSI band up and makes a Higher low above the RSI band.
Consider selling : When the price breaks the RSI band down and rebounds to make a Lower high below the RSI band.
# However, I have colored the candlesticks to make them easier to spot. By applying it may remove the color of the candlestick border. Then for the wick part, use a color that does not specify the price plus and minus color #434651
We can see the divergence by comparing the difference between the price and the RSI band as follows.
In a downtrend : Compare the difference between the price and the RSI band of the current Lower Low and the previous Low. If the divergence of the Low continues to decrease until the price approaches the RSI band, consider buying.
In an uptrend : Compare the price difference between the RSI band of the current Higher High and the previous high. If the divergence of the High continues to decrease until the price approaches the RSI band, consider selling.
I have created a Signal alert for easy observation. It was created from the following conditions: (Do not trade according to Signal alert strictly because they just tell the point according to the conditions set There may be a buy signal and then buy again without a sell signal.)
Buy : When RSI14 crosses above 50 with RSI14 crosses up the signal I set (I use EMA7 of RSI14).
Prepare to Sell : When RSI14 crosses signal while RSI14 is greater than 70.
Sell/Short Top : When RSI14 crosses down at 70 with RSI14 crosses down Signal (it will show "Peak" on the chart)
Buy : When RSI14 crosses down to 50 with RSI14 crosses down signal.
Prepare to Buy : When RSI14 crosses signal while RSI14 is less than 30.
TP Short/Buy Bottom : When RSI14 crosses above 30 with RSI14 crosses up signal (it will show "Deep" in the chart).
# The reason why I put the message in Signal alert only at Sell/Short Top and TP Short/Buy Bottom to reduce the chance of panic occurring from observation. In other signals, there will only be a * sign.
Good luck.
Firstssk

+ BB %B: MA selection, bar coloring, multi-timeframe, and alerts+ %B is, at its simplest, the classic Bollinger Bands %B indicator with a few added bells and whistles.
However, the right combination of bells and whistles will often improve and make a more adaptable indicator.
Classically, Bollinger Bands %B is an indicator that measures volatility, and the momentum and strength of a trend, and/or price movements.
It shows "overbought" and "oversold" spots on a chart, and is also useful for identifying divergences between price and trend (similar to RSI).
With + %B I've added the options to select one or two moving averages, candle coloring, and a host of others.
Let's start with the moving averages:
There are options for two: one faster and one slower. Or combine them how you will, or omit one or both of them entirely.
Here you will find options for SMA, EMA (as well as double and triple), Hull MA, Jurik MA, Least Squares MA, Triangular MA, Volatility Adjusted MA, and Weighted MA.
A moving average essentially helps to define trend by smoothing the noise of movements of the underlying asset, or, in this case, the output of the indicator.
All of these MAs available track this in a different way, and it's up to the trader to figure out which makes most sense to him/her.
MA's, in my opinion, improve the basic %B by providing a clearer picture of what the indicator is actually "seeing", and may be useful for providing entries and exits.
Next up is candle coloring:
I've added the option for this indicator to color candles on the chart based on where the %B is in relation to its upper and lower bounds, and median line.
If the %B is above the median but below the upper bound, candles will be green (showing bullish market structure). If %B is below the median but above the lower bound, candles will be red (denoting bearish market structure).
Overbought and oversold candles will also be colored on the chart, so that a quick glance will tell you whether price action is bullish/bearish or "oversold"/"overbought".
I've also added functionality that enables candles to be colored based on if the %B has crossed up or crossed down the primary moving average.
One example as a way to potentially use these features is if the candles are showing oversold coloration followed by the %B crossing up your moving average coloration. You might consider a long there (or exit a short position if you are short).
And the last couple of tweaks:
You may set the timeframe to whatever you wish, so maybe you're trading on the hourly, but you want to know where the %B is on the 4h chart. You can do that.
The background fill for the indicator is split into bullish and bearish halves. Obviously you may turn the background off, or make it all one color as well.
I've also added alerts, so you may set alerts for "overbought" and "oversold" conditions.
You may also set alerts for %B crossing over or under the primary moving average, or for crossing the median line.
All of these things may be turned on and off. You can pretty much customize this to your heart's delight. I see no reason why anyone would use the standard %B after playing with this.
I am no coder. I had this idea in my head, though, and I made it happen through referencing another indicator I was familiar with, and watching tutorials on YouTube.
Credits:
Firstly, thanks to www.tradingview.com for his brilliant, free tutorials on YouTube.
Secondly, thanks to www.tradingview.com for his beautiful SSL Hybrid indicator (and his clean code) from which I obtained the MAs.
Please enjoy this indicator, and I hope that it serves you well. :)

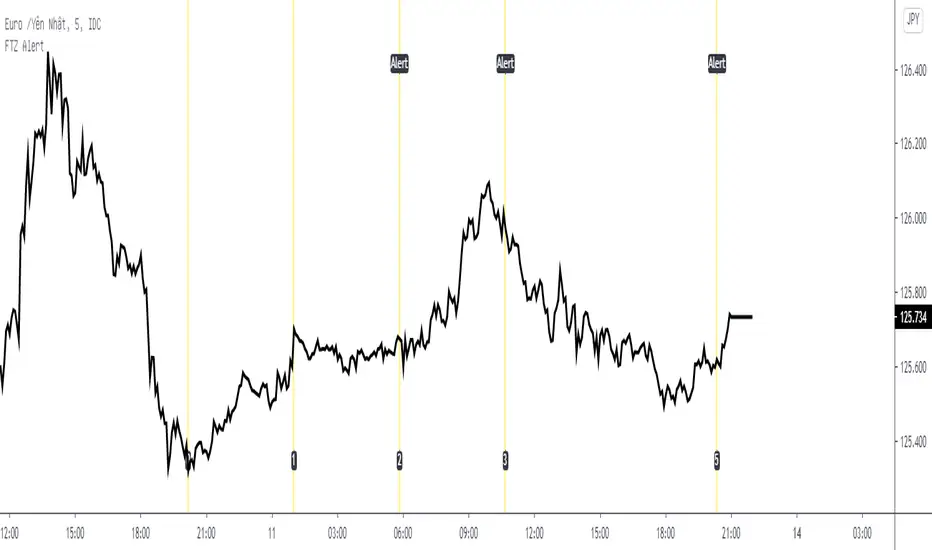
Fib Time Zone with Alert* Fib Time Zone with Alert will draw a series of vertical lines on chart. They are spaced at the Fibonacci intervals of 1, 2, 3, 5, 8, 13, 21, 34, 55 and 89. Trader defined the zero line and the 1 line, then Fib Time Zone with Alert auto draw the rest and display alert when price touch the line.
* Alert condition available in the Create Alert dialog box with title "Fib Time Zone Alert".
* Line 0 was defined by Date, Month, Year, Hour, Minute (use Exchange Timezone).
* Line 1 was defined by number of bars between Line 0 and Line 1.
* Line 2,3,5,8,13,21,34,55 and 89 auto draw.
Fixed Percent Stop Loss & Take Profit % - For Study Scripts===========
Fixed Percent Stop Loss & Take Profit % - { FOR STUDY SCRIPTS! }
===========
A neat example of how to set up Fixed Stops and Take Profit as a percent of the entry price - This is for setting Alerts within your own Study Script for when either your SL or TP get hit.
Yup, that's about it!
You can ignore the actual entry/exit orders - they're based on a simple MA cross and are therefore NOT relevant, NOT profitable and NOT recommended!
You should be using this code as a way of adding Stops and Takes to your own scripts - hope it helps!
Set your "Open Long/Short" Alerts to be triggered "Once per Bar Close" - Set your "SL/TP" Alerts to trigger "Once per Bar".
--
We wrote this with a bit of a rush on! ~ If you spot any mistakes/bugs just let us know and we'll get round to them asap!
-----------
Good Luck and Happy Trading!

inwCoin Specific Buy/Sell Price Alert for AutoviewJust simple script to act as conditional stop loss
Problem : Traditional Market Stop or Limit Stop, you have to set it with specific price and wait for the price to drop/pump to your stop then it will trigger. But sometime ( so many times ) the price will leave a very long wick up or down to hunt the stoploss that already set in the exchanges.. then it turn back to the opposite side after stop our position from existent!!
Thank to Autoview, with this simple script, you can setup your "stop level" without put "stop market" in the order.
Just stop when price close below or above specific level in the script, then you can just setup alert to fire the TP/Stop order to exchange via autoview after alert fire.
Example;
You need to stop loss / TP your position when price "close below 9500" in daily BTC chart
- Just set "sell price" to 9500
- and set "Cross down" option
When daily chart close below 9500, the script will trigger alert for you to catch and send to any exchange via Autoview.
Note;
1) When setting alert in tradingview, make sure to use..
- Crossing Down + 0.8 in alert trigger condition
- Set to "Once per bar" ( If you set "once per bar close", it will fire alert in next 2nd candle! )
2) You need to subscribe to autoview to use the bot. And it's not for everyone. Just do your own research before using! ( try to test with small amount of money first! )
Cheers!

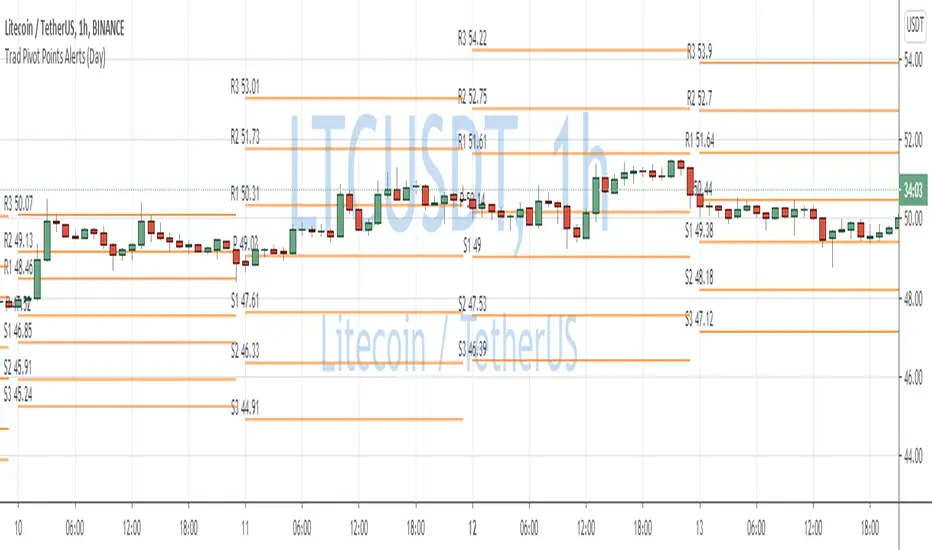
Traditional Pivot Points AlertsCreated a script for alerts on Traditional Pivot Points.
You will be able to create separate alerts for every level or create one for price crossing any level.
Because of some TradingView limitations, alerts won't be fired for the first bar of the session. Will try to solve that in the new versions.
In the script used new v4 plotting features, so will be able to plot levels and labels nicely. Unfortunately, there is a limit on the number of consecutive lines you can plot on the plot (around 50), so lines in the past will disappear.
You can enable/disable in params displaying level itself on the chart.
And remember:
Past performance does not guarantee future results.
Fibonacci Pivot Points AlertsCreated a script for alerts on Fibonacci Pivot Points.
You will be able to create separate alerts for every level or create one for price crossing any level.
Because of some TradingView limitations, alerts won't be fired for the first bar of the session. Will try to solve that in the new versions.
In the script used new v4 plotting features, so will be able to plot levels and labels nicely. Unfortunately, there is a limit on the number of consecutive lines you can plot on the plot (around 50), so lines in the past will disappear.
And remember:
Past performance does not guarantee future results.
Dragon-Bot - Default ScriptDragon-Script is a framework to make it as easy as possible to test your own strategies and set alerts for external execution bots. This is the alerts version of the script.
The script has many features build in, like:
1) A ping/pong mechanism between longs and shorts
2) A stop-loss
3) Trailing Stops with several ways to calculate them.
4) 2 different ways to flip from long to short.
The script is divided into several parts.
The first part of the script is used to set all the variables. You should normally never change the first part except for the comments at the top.
The second part of the script is the part where you initialise all your indicators. Several indicators can be found on Tradingview and on other sites. Please keep in mind that all the variable names used in the indicator should be unique. (all the … = … parts)
The third part of the script, is the most important part of the script. Here you can create the entry and exit points.
Let’s look at the OPENLONG function to explain this part: The first variables are all the possible entries; These are longentry1 till longentry5. You can add many more if you like.
The variables are all initialised as being false. This way the script can set a value to true if an entry happens.
The if function is the actual logic: You could say “if this is true” then (the line below the if function) longentry1 := (becomes) true.
In this case we have said: “if this is true” then (the line below the if function) longentry1 := (becomes) true when the current close is larger than the close that is 1 back.
The last part is the makelong_funct. This part says that if any of the entries are true, the whole function is true.
The last part of the script is the actual execution. Here the alerts are plotted and the back test strategies are opened and closed.
We hope you guys like it and all feedback is welcome!
