Daily Weekly Highs & LowsOverview
This indicator automatically plots the previous day’s and previous week’s Highs and Lows, giving you instant clarity on the most important market liquidity levels. These levels often act as magnets for price and serve as key decision zones for intraday and swing traders.
Whether you're looking for liquidity sweeps, breakout confirmations, or simple bias alignment — this tool gives you an immediate visual edge.
Features
Precise anchoring from HH/LL
Lines begin exactly at the previous High/Low with no delays or offsets, ensuring clean and accurate structure visualization.
Visual breakout detection
The indicator highlights where price has broken above or below the previous day/week levels, helping you instantly spot liquidity grabs and market intent.
How It Works
Automatically detects the previous day’s High/Low.
Automatically detects the previous week’s High/Low.
Plots clean horizontal levels starting from the original HH/LL point.
Monitors price in real time and marks the exact candle that breaks the level.
Optionally highlights sweeps or simple breaks, depending on your trading style.
How to Use
Use previous day High/Low for intraday bias, liquidity sweeps, and breakout plays.
Use previous week High/Low for swing bias and higher-timeframe liquidity targets.
Combine breaks with your entry model (FVG, BOS/CHOCH, displacement, etc.).
Watch for fakeouts (liquidity sweeps) followed by reversal signals on lower timeframes.
Monitor alert notifications to avoid staring at the chart all day.
Alerts
Receive notifications the moment price interacts with key levels:
Previous Day High Break
Previous Day Low Break
Previous Week High Break
Previous Week Low Break
(Alerts trigger exactly at the level break — no repainting.)
Cari skrip untuk "BOS"

[IronXCharts] Frank Strategy 1.0 – Aggressive Player Contact me frankk886@live.it for purchase
Frank Strategy 1.0 is a structured trading system designed to filter noise and highlight only high-probability setups.
It combines trend, momentum, market structure (CHOCH/BOS), liquidity zones and ATR-based risk management to deliver precise entry signal

VaCs, Trade Indic## 🎛 **MAIN PRICE CHART (Primary Panel)**
Overlay on the main candlestick chart:
* 200 EMA + 50 EMA trend ribbons
* Parabolic SAR
* Logarithmic Growth Curves (LGC / LGH)
* Stock-to-Flow (S2F) bands
* Linear, Log, and Polynomial Regression Channels
* Liquidity mapping:
* Buyside liquidity
* Sellside liquidity
* Fair Value Gaps (FVG)
* Order Blocks
* Imbalance Zones
* Smart Money Concepts (SMC):
* HH, HL, LH, LL structure
* BOS (Break of Structure)
* CHOCH (Change of Character)
* Whale Accumulation Layers:
* Wallet cohorts (1–10 / 10–100 / 100–1K / 1K–10K)
* Whale inflow/outflow
* Exchange net positions
* On-chain macro layers:
* NUPL
* MVRV
* SOPR
* Realized price bands
* Miner Position Indicator
* Hash Ribbons
* Market cycle markers:
* Halving cycles
* Accumulation, Markup, Distribution, Markdown phases
* Fundamental macro overlays:
* Fed interest rate events
* CPI releases
* ETF inflow/outflow markers
* Major global news catalysts
---
## 📊 **SUB-PANEL #1 — Momentum Oscillators**
Add a clearly separated lower panel containing:
* MACD (standard)
* RSI (14) **with divergence lines**
* Stochastic RSI
* MFI (Money Flow Index)
This panel must be independent and **not overlayed** on the main chart.
---
## 📊 **SUB-PANEL #2 — Volume & Flow Analytics**
A second independent lower panel showing:
* Volume Profile
* On-Balance Volume (OBV)
* **VWAP** (Volume Weighted Average Price)
* Must be clean, visible, and used for trend confirmation
* Use logic equivalent to TradingView Pine Script v6 **ta.vwap()**
* Represents a stable VWAP line across the full dataset
* Funding Rate
* Open Interest (OI)
* CVD (Cumulative Volume Delta)
---
## 📊 **SUB-PANEL #3 — On-Chain Analytics Panel**
Add a dedicated panel for:
* Exchange inflow/outflow
* Miner flow
* Realized profits vs realized losses
* Stablecoin Supply Ratio (SSR)
* Any high-frequency on-chain volatility signals
---
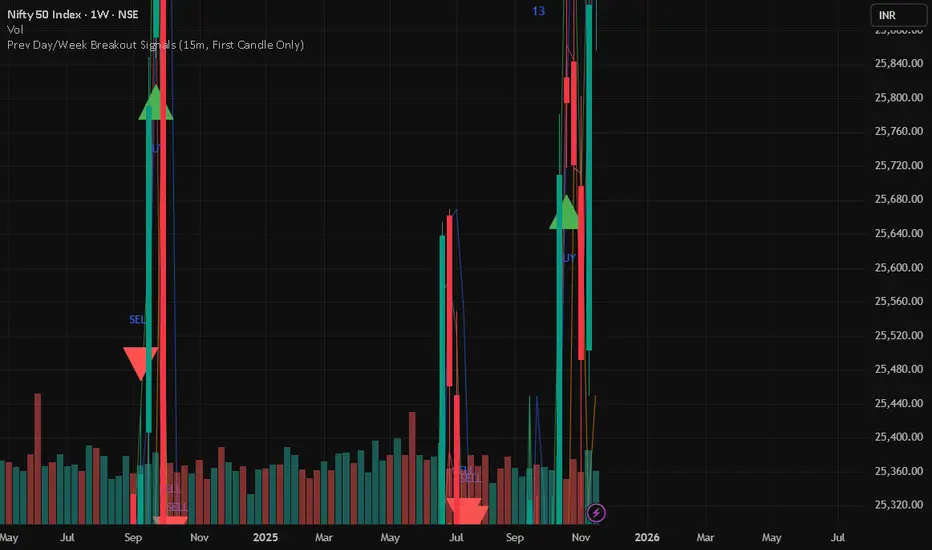
Prev Day/Week Breakout Signals (15m, 1st 15 min BO)- Dr VinayPrev Day/Week Breakout Signals (15m, First Candle Only)- For taking break out entries
Reward-Risk Visual Zones (RRZ)Reward–Risk Visual Zones (RRZ) – Structure-Driven Risk Mapping Engine
Most indicators tell you when to trade.
RRZ is designed to answer a different question:
“Is this setup worth the risk before I take the trade?”
RRZ is not a mashup of unrelated indicators.
It is a 3-stage risk engine that builds a complete trade “story” around each swing:
1. Market structure pivot → defines the trade idea
2. ATR volatility unit → defines the risk size
3. Projected reward → compares reward vs that risk and filters bad setups
The output is a visual trade map : entry, target, stop, and R:R, printed directly on chart at each qualified swing.
1. Market Structure Layer – Where trades are anchored
RRZ doesn’t fire signals from MA/RSI crossovers.
It begins with s wing structure :
• Uses ta.pivotlow() and ta.pivothigh() with user-controlled left/right sensitivity:
• Pivot Sensitivity (L) controls how wide a swing must be to qualify as a structural pivot.
• Pivot Confirmation (R) controls how fast/slow a pivot is confirmed (1 = almost real-time, larger values = safer but later).
• A confirmed swing low becomes the candidate anchor for a long R:R zone.
• A confirmed swing high becomes the candidate anchor for a short R:R zone.
Each pivot is stored with its exact price and bar index , so the rest of the logic is always anchored to a real swing instead of a random candle.
2. Volatility Layer – Turning ATR into a “risk unit”
Once a pivot is confirmed, RRZ measures local volatility using ATR:
• ATR length is configurable via ATR Length.
• ATR is not used as a trailing stop or overlay.
In RRZ it plays one specific role:
“One ATR = one unit of structural risk from this swing.”
From that:
Long scenario:
• Entry = pivot low
• Stop = Entry − 1 × ATR
Short scenario:
• Entry = pivot high
• Stop = Entry + 1 × ATR
This standardizes risk across different volatility regimes:
a 2R move in a quiet market and a 2R move in a volatile market are both “2 × ATR” from the structure.
3. Reward Projection Layer – Evaluating if the trade is worth it
RRZ then estimates how far price can realistically travel away from the pivot, given recent behaviour:
For longs (from swing low):
• Projects reward using the highest high in a rolling lookahead window (e.g., last 20 bars).
• Reward = HighestHigh – PivotLow
• Risk = ATR
• R:R = Reward / ATR
For shorts (from swing high):
• Projects reward using the lowest low in the window.
• Reward = PivotHigh – LowestLow
• Risk = ATR
• R:R = Reward / ATR
The user can set a minimum R:R filter via Min R:R Threshold.
• If R:R ≥ threshold → zone is tagged as “ GOOD R:R ” and highlighted in green (long) or red (short).
• If R:R < threshold → optionally still shown as “ LOW R:R ” in orange (so you can visually see “tempting but not worth it” trades).
This transforms a raw pivot + ATR into a quantified decision:
“From this swing, volatility says my stop is 1× ATR. Do I even have 2× ATR of room in my favour?”
4. Execution Map – How components work together on chart
Instead of just printing numbers, RRZ builds a full execution template for every qualifying swing:
• Entry line at the pivot price
• Target line at the reward projection price
• Stop line at pivot ± ATR
• A structured label including:
• LONG / SHORT direction
• “GOOD R:R” or “LOW R:R”
• Numerical R:R (e.g., 2.3 : 1)
• Entry, Target, Stop, current Close
A Cooldown Bars parameter prevents overlapping spam:
• After an R:R zone is created (long or short), the script waits X bars before considering another zone in the same direction.
• This keeps charts readable and focuses attention on the most recent high-quality swings.
RRZ also includes line style controls (solid/dashed/dotted) and separate colours for entry, target, and stop, so traders can quickly read the chart even without opening settings.
5. How to Use RRZ in a Trading Plan
RRZ is not a magic “buy/sell” button.
It is designed to sit on top of your existing strategy as a risk filter.
Typical workflows:
SMC / price-action traders:
• Use your own logic for BOS/CHoCH, order blocks, or liquidity sweeps.
• Use RRZ only where structure aligns and the zone shows GOOD R:R ≥ 2.0.
• Avoid setups where RRZ marks LOW R:R even if the pattern looks good.
System traders / swing traders:
• Use RRZ to standardize risk across assets and timeframes.
• Filter out trades where potential reward does not justify the stop, based on current ATR.
Beginners:
• Learn to stop taking trades where the target is too close and the stop is too wide.
• Visually understand how structural swings and volatility interact.
RRZ works across Forex, Crypto, Indices, and Stocks on intraday and higher timeframes.
Once a pivot is confirmed and a zone is plotted, its lines and labels do not repaint.
⸻
6. Why this invite-only script is more than a basic mashup
RRZ does use classic building blocks (pivots, ATR), but the value is in the way they are stitched into a single risk framework:
• It doesn’t run multiple separate indicators on chart.
Everything is computed inside one engine with a single purpose: structure-based R:R evaluation.
• ATR is not just “slapped on” as a stop line; it is treated as the core risk unit in the R:R calculation pipeline.
• Every zone is a coherent trade idea: from swing, to risk unit, to projected reward, to filtered label, to execution lines.
• The script is designed specifically to help traders do the one thing that almost no free indicator prioritizes:
“Say NO to low R:R trades automatically.”
This is what distinguishes RRZ from generic ATR-stop scripts or simple pivot overlays.
⸻
Important
• No performance promises.
• No marketing claims (“guaranteed”, “high win rate”, etc.).
• Purely a risk mapping & visualization tool.


Scanner 10 - Trend10m real-time multi-ticker scanner with Trend, Inside/BO, HeatScore, and key daily/premarket levels.

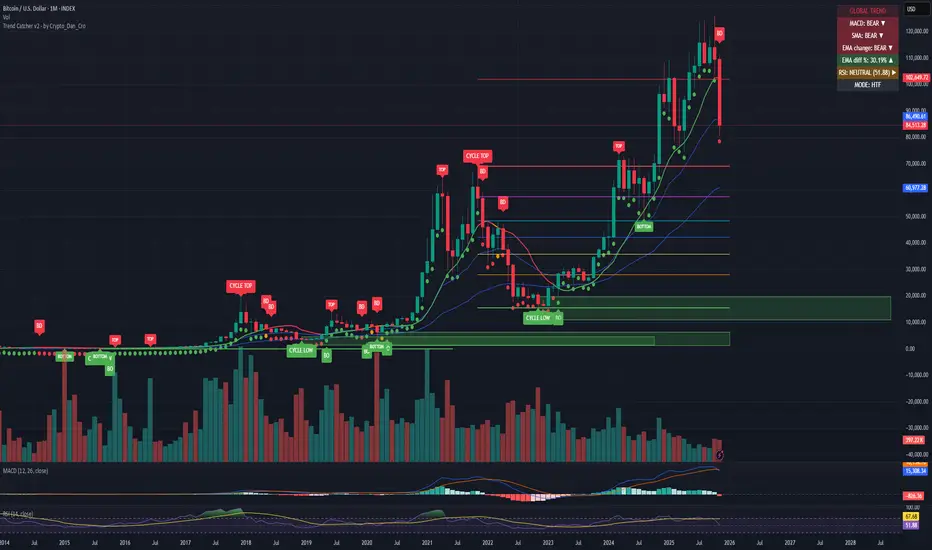
Trend Catcher - Alpha v2 - by Crypto_Dan_CroIf you want to get this indicator, contact me on
X handle: @crypto_dan_cro
What is Trend Catcher v2?
This is the only indicator you need ;)
This indicator is a proprietary market analysis system designed to identify high-probability trading zones by synchronizing multiple layers of market structure, momentum behaviour and cyclical dynamics.
It dynamically adapts to changing market conditions by evaluating:
- macro trend alignment
- structural price positioning
- momentum acceleration & deceleration
- volatility-based reaction zones
- cycle maturity levels
The system filters out low-quality setups and highlights only areas where multiple hidden conditions align, providing:
- trend continuation signals
- structural shift detection
- cycle-based expansion targets
- adaptive support & resistance mapping
Rather than reacting to price alone, the indicator anticipates areas where market psychology historically shifts, allowing traders to position themselves ahead of major moves.
Core philosophy:
This tool does not attempt to predict the market — it tracks the underlying pressure points where probability favours expansion or exhaustion.
It functions as:
- a trend alignment engine
- a cycle decoder
- a volatility interpreter
- a structure validation system
What it gives the user:
- Clear visual guidance without overloading the chart
- Objective market context independent of emotion
- Early trend recognition
- Cycle-aware price targeting
- Decision zones instead of random entries
Ideal for:
- traders who trade structure, not noise
- investors who respect market cycles
- strategists focused on probability over prediction
- disciplined entries & exits
In short:
It is a market interpretation framework built for traders who think two steps ahead.
Contains:
1. Higher Timeframe mode (Monthly / Weekly) on all timeframes
2. Current Chart Timeframe mode
3. Global Trend via BTC MACD
4. SMA
5. EMA
6. BO (Break Out), BD (Break Down) signals
7. TOP & BOTTOM Detection
8. Support & Resistance Zones
9. RSI confirmation
10. Smart Info Panel (Global trend, MACD, SMA, EMA, RSI statuses - Bull, Bear, Neutral)
11. Monthly timeframe (Fibbonaci Retracement levels)
12. Monthly timeframe (all Cycle tops, and Cycle bottoms)
Crypto markets are volatile, if you choose to use this indicator for trading, you are doing it on your own. Crypto_dan_cro is not responsible for any profits or losses created by using this Indicator.
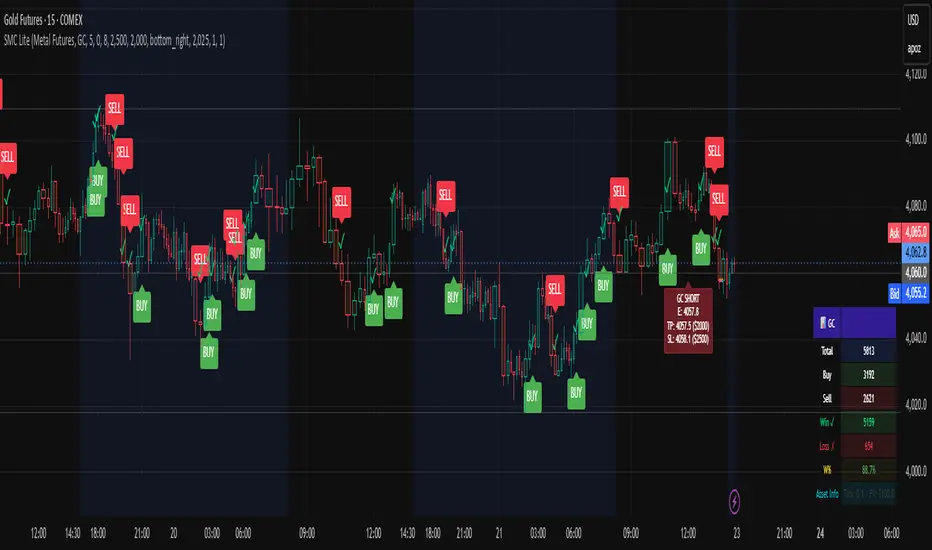
RAFA's SMC Killer LITEWhat is the SMC Killer?
The Smart Money Concepts (SMC) Killer is a trading indicator that identifies high-probability entry points using three proven strategies:
Break of Structure (BOS) - Trades when price breaks key support/resistance levels
Fair Value Gap (FVG) - Enters when price fills gaps in the market
Order Blocks (OB) - Entry from institutional order clusters (optional display)
This indicator automatically:
✅ Calculates correct entry, take-profit, and stop-loss levels for your asset
✅ Tracks win/loss statistics in real-time
✅ Works on 30+ different futures contracts
✅ Adapts tick size and point value automatically
Asset Selection
Supported Assets
The indicator supports all major futures contracts:
Equity Futures:
ES (E-mini S&P 500)
NQ (E-mini NASDAQ 100)
YM (Mini Dow Jones)
NKD (Nikkei 225)
EMD (E-mini Midcap 400)
RTY (Russell 2000)
Currency Futures:
6A (Australian Dollar)
6B (British Pound)
6C (Canadian Dollar)
6E (Euro FX)
6J (Japanese Yen)
6S (Swiss Franc)
6N (New Zealand Dollar)
Agricultural Futures:
HE (Lean Hogs)
LE (Live Cattle)
GF (Feeder Cattle)
ZC (Corn)
ZW (Wheat)
ZS (Soybeans)
ZM (Soybean Meal)
ZL (Soybean Oil)
Energy Futures:
CL (Crude Oil)
QM (Mini Crude Oil)
NG (Natural Gas)
QG (E-mini Natural Gas)
HO (Heating Oil)
RB (RBOB Gasoline)
Metal Futures:
GC (Gold)
SI (Silver)
HG (Copper)
PL (Platinum)
PA (Palladium)
QI (E-mini Silver)
QO (E-mini Gold)
Micro Futures:
MES (Micro E-mini S&P 500)
MYM (Micro E-mini Dow Jones)
MNQ (Micro E-mini NASDAQ)
M2K (Micro Russell 2000)
MGC (E-Micro Gold)
M6A (E-Micro AUD/USD)
M6E (E-Micro EUR/USD)
MCL (Micro Crude Oil)
How to Select Your Asset
Open the indicator settings (click ⚙️)
Go to ASSET SELECT section
Select Asset Category (e.g., "Metal Futures")
Enter Select Asset Symbol (e.g., "GC" for Gold)
Click OK
The indicator will automatically load the correct:
✅ Tick size
✅ Point value
✅ Risk/reward calculations
Settings Configuration
ASSET SELECT Group
Asset Category: Choose from 6 categories
Select Asset Symbol: Enter symbol (ES, GC, CL, etc.)
STRUCTURE Group
Show Swing Structure: Display swing highs/lows
Swing Length: Bars used for pivot detection (default: 5)
Build Sweep: Show sweep formations (default: ON)
What it does: Identifies the market trend and key turning points
Teal/Green bars = Uptrend
Orange/Red bars = Downtrend
FVG Group
Enable FVG Entry: Use Fair Value Gap strategy
FVG Threshold: Sensitivity filter (default: 0)
What it does: Detects gaps in price action that indicate imbalance
Lower threshold = More signals
Higher threshold = Fewer, high-quality signals
RISK Group
Show Bracket: Display entry/TP/SL lines
Units/Contracts: Number of contracts to trade (default: 6)
Stop Loss ($): Risk amount per trade (default: $250)
Target ($): Profit target per trade (default: $1,000)
Example: If you select ES with $250 stop loss:
The indicator calculates: 250 ÷ (6 contracts × $50 per point) = 0.83 points
Your stop loss line appears 0.83 points below entry
TABLE Group
Show Statistics: Display results table
Position: Table location (default: top_right)
Year: Start tracking from this year
Month: Start tracking from this month
Day: Start tracking from this day
Trading Signals
BUY Signal 🟢
When you see a green "BUY" label below a candle:
Price is breaking higher (Break of Structure)
OR price is filling a gap (Fair Value Gap)
The indicator plots three lines:
Green line = Entry price
Lime/bright green line = Take Profit level
Red line = Stop Loss level
Action: Consider entering a LONG position at market or entry price
SELL Signal 🔴
When you see a red "SELL" label above a candle:
Price is breaking lower (Break of Structure)
OR price is filling a gap (Fair Value Gap)
The indicator plots three lines:
Red line = Entry price
Magenta/pink line = Take Profit level
Orange line = Stop Loss level
Action: Consider entering a SHORT position at market or entry price
Signal Confirmation
✅ Wait for confirmation - Only trade signals on confirmed (closed) bars
✅ Check the trend - Look at candle colors (green uptrend, orange downtrend)
✅ Risk/reward ratio - TP should be at least 2x your SL risk
Risk Management
Position Sizing Example
Trading Gold (GC) with ES Settings:
Units: 6 contracts
Stop Loss: $250
Target: $1,000
Tick Size: 0.1 (automatic for GC)
Point Value: $100 per point (automatic for GC)
Risk per trade: $250
Reward per trade: $1,000
Risk/Reward Ratio: 1:4 (Excellent!)
Stop Loss Strategy
Always place your stop loss below/above the entry lines
The red/orange line shows exactly where to place SL
Never move your stop loss against the trade (unless scaling)
Use hard stops - set them immediately upon entry
Take Profit Strategy
Take profits at the lime/magenta line (TP level)
Consider taking partial profits at 50% of target
Let remaining 50% run to full target
Use trailing stops if price moves in your favor
Risk Per Trade
Formula: (Stop Loss $) ÷ (Units × Point Value)
Example for ES:
Stop Loss: $250
Units: 6
Point Value: $50
Risk per point: 250 ÷ (6 × 50) = 0.83 points
Reading the Chart
Visual Elements
Candle Colors:
🟩 Green/Teal = Uptrend (higher highs and higher lows)
🟥 Orange/Red = Downtrend (lower highs and lower lows)
Signal Labels:
BUY (Green) = Long entry opportunity
SELL (Red) = Short entry opportunity
Bracket Lines:
Entry Line (Solid) = Your entry price
TP Line (Bright color) = Take profit target
SL Line (Red/Orange) = Stop loss level
Success Markers:
✓ (Green checkmark) = Trade hit TP (WIN)
✗ (Red X) = Trade hit SL (LOSS)
Statistics Table
What Each Column Means
📊 ← Current asset being traded
├── Total: Total signals generated (buys + sells)
├── Buy: Number of buy signals
├── Sell: Number of sell signals
├── Win ✓: Trades that hit take profit
├── Loss ✗: Trades that hit stop loss
├── W%: Win rate percentage (wins ÷ total trades)
└── Asset Info: Tick size and point value
Example Reading
📊 ES
Total: 15
Buy: 8
Sell: 7
Win ✓: 10
Loss ✗: 5
W%: 66.7%
Asset Info: Tick: 0.25 | PV: $50
This means:
15 total signals since tracking started
10 wins, 5 losses
66.7% win rate (Professional level!)
Trading ES with 0.25 tick and $50 point value
Trading Examples
Example 1: Gold (GC) Long Trade
Setup:
Asset: Metal Futures → GC
Stop Loss: $150
Target: $600
Units: 2 contracts
What happens:
You see a BUY label on a green candle
Entry line at 2050.0
TP line at 2050.6 (0.6 points higher = $600 profit)
SL line at 2049.85 (0.15 points lower = $150 loss)
Risk/Reward: 1:4 ✅
Trade Result:
Price moves to 2050.6 → Label shows ✓ = WIN
Table updates: Wins increases by 1, Win% increases
Example 2: Crude Oil (CL) Short Trade
Setup:
Asset: Energy Futures → CL
Stop Loss: $500
Target: $2,000
Units: 1 contract
What happens:
You see a SELL label on a red candle
Entry line at 78.50
TP line at 77.50 (1.00 lower = $1,000 profit)
SL line at 79.00 (0.50 higher = $500 loss)
Risk/Reward: 1:2 ✅
Trade Result:
Price drops to 77.50 → Label shows ✓ = WIN
Table updates: Wins increases by 1, Win% increases
Example 3: E-mini S&P (ES) Day Trading
Setup:
Asset: Equity Futures → ES
Stop Loss: $250
Target: $1,000
Units: 6 contracts
Swap Length: 5 (default)
Enable FVG: ON
Morning Session:
See BUY at 5860.25 (swing break)
Hit TP at 5861.08 = WIN ✓
Table shows: Total 1, Buy 1, Win 1, W% 100%
See SELL at 5861.50 (FVG entry)
Hit SL at 5860.67 = LOSS ✗
Table shows: Total 2, Sell 1, Win 1, L% 50%
By end of day: 4 wins, 1 loss, 80% win rate
Troubleshooting
Issue 1: No signals appearing
Solution:
Check if both Show Bracket is ON
Check if Enable FVG Entry is ON
Try changing Swing Length (lower = more signals)
Ensure you're on a 1-hour or higher timeframe
Check chart has enough data (scroll left to see history)
Issue 2: Signals appear but no entry lines
Solution:
Confirm Show Bracket is toggled ON
Check Stop Loss ()andTarget() and Target (
)andTarget() are reasonable amounts
Ensure your Units value is not 0
Try refreshing the chart
Issue 3: Asset not recognized
Solution:
Check spelling of symbol (ES, not E-S)
Verify asset is in the supported list
Check you're in the correct category
Try closing and reopening the chart
Issue 4: Wrong stop loss/target levels
Solution:
Verify correct asset is selected
Check Units setting matches your position size
Verify Stop Loss ($) and Target ($) amounts
Look at Asset Info in table to confirm tick size
Manually calculate: SL $ ÷ (Units × Point Value) = Points
Issue 5: Statistics table not showing
Solution:
Toggle Show Statistics OFF then back ON
Try changing Table Position
Refresh the chart
Check that Show Table is enabled in settings
Issue 6: Indicator acting "heavy" or laggy
Solution:
Turn off Show Swing Structure if not needed
Turn off Show Bracket if reviewing historical trades
Reduce chart's data window (don't load entire years)
Refresh the chart
Pro Tips 🚀
Tip 1: Start with Micro Futures
Micro contracts (MES, MNQ, MCL) have lower cost
Perfect for learning the strategy
Same quality signals, smaller risk
Tip 2: Trade During Peak Hours
Equity Futures: 9:30-16:00 ET (Regular session)
Energy: 18:00-16:00 CT (After hours active)
Metals: 18:00-17:00 CT (Most liquid)
Currencies: 5:00 PM - 4:00 PM ET (24-5 market)
Tip 3: Combine Timeframes
Look for entry on 1-hour chart
Confirm on 15-minute chart
Execute on 5-minute breakout
More confluence = higher probability
Tip 4: Track Your Trades
Keep notes on WIN/LOSS trades
Identify patterns in your losses
Adjust settings based on performance
Use Win% table to monitor improvement
Tip 5: Risk Management First
Never risk more than 2% of account per trade
Respect your stop loss (don't move it)
Take profits when levels are hit
Be patient for high-probability setups
Tip 6: Adjust for Market Conditions
Trending markets: Increase Swing Length (6-8)
Choppy markets: Decrease Swing Length (2-4)
Low volatility: Reduce Stop Loss $
High volatility: Increase Target $
Quick Reference Card
────────────────────────────────────────────────────
SMC KILLER QUICK START ─────────────────────────────────────────────────────
│ 1. Select Asset Category & Symbol
│ 2. Set Units (contracts)
│ 3. Set Stop Loss ($) - your max risk
│ 4. Set Target ($) - your profit goal
│ 5. Wait for BUY (green) or SELL (red) signal
│ 6. Place entry at the entry line
│ 7. Place stop at the red/orange line
│ 8. Place take-profit at the lime/magenta line
│ 9. Close trade when line closes (✓ or ✗)
│ 10. Review statistics and adjust next trade
└─────────────────────────────────────────────────────
BUY Signal = Break Higher OR Fill Gap = LONG
SELL Signal = Break Lower OR Fill Gap = SHORT
Green candles = Uptrend
Orange candles = Downtrend
✓ = Win (took profit)
✗ = Loss (hit stop)
Support & Updates
Check settings are correct for your asset
Ensure adequate chart data is loaded
Test on demo account first
Start with smallest position size
Track performance over 20+ trades
Chop Meter + Trade Filter 1H/30M/15M (Ace PROFILE v3)💪 How to Actually Use This (The MMXM Way)
1️⃣ Check the Status Before ANY trade
If it says NO TRADE → Do not fight it.
Your psychology stays clean.
2️⃣ If TRADE (1M NO TRADE – 15M CHOP)
Avoid:
1M SIBI/OB
1M BOS/CHOCH
1M SMT
1M Silver Bullet windows
Use only higher-timeframe breaks.
3️⃣ If ALL THREE are NORMAL → Full Go Mode
Every tool is unlocked:
1M microstructure
1M FVG snipes
Killzones
Silver Bullet
SMT timing
MMXM purge setups
This is where your best trades come from.
4️⃣ If 30M is CHOP
Sit tight.
It’s a trap day or compression box.
This one filter alone will save you:
FOMO losses
False expansion traps
Microstructure whipsaws
News fakeouts
Reversal cliffs
Algo snapbacks
🧠 Why This Indicator Works
No indicators.
No RSI.
No Bollinger.
No volume bullshit.
Just structure, time, and compression — exactly how the algorithm trades volatility.
When this tool says NO TRADE, it is telling you:
“This is NOT the moment the algorithm will expand.”
And that’s the whole game.
🔥 Summary
Condition Meaning Action
30M = CHOP 30M box active No trading at all
2+ TF CHOP HTF compression No trading
15M CHOP Micro compression No 1M entries
All NORMAL Expansion conditions Full Go Mode

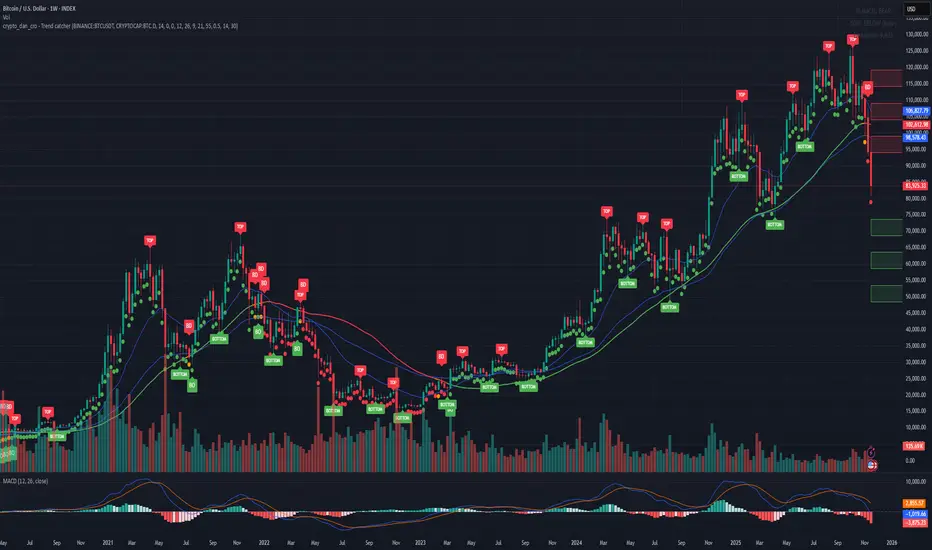
Crypto_Dan - Trend catcher - All projectsCrypto_dan_cro - Trend catcher indicator
This indicator will show you the Macro trend - ALL PROJECTS.
DOTS
Red dots - mean we are in Bearish part of the cycle where prices are expected to drop further
Yellow dots - mean we are in the area where either breakout or breakdown are possible
Green dots - mean we are in a Bullish part of the cycle, where prices are expected to raise
SMA LINE
Crossing below line, will make line red - bearmarket
Crossing above line, will make line green - bullmarket
Trading on the line, will make line yellow - direction still not decided
TOP & BOTTOM
Top - showing you tops
Bottom - showing you bottoms
BREAKOUTS & BREAKDOWNS
BO - BreakOut - showing you change in trend, and prices are expected to raise
BD - BreakDown - showing you change in trend, and prices are expected to drop.
SUPPORT & RESISTANCE
Red squares on the last candle - showing you 3 closest resistances (on every timeframe)
Green squares on the last candle - showing you 3 closest supports (on every timeframe)
Crypto markets are volatile, if you choose to use this indicator in trading, you are doing it on your own. Crypto_dan_cro is not responsible for any profits or losses created by using this Indicator.
Good luck ;)
If you want to get this indicator for free, follow me on
X handle: @crypto_dan_cro
Turn notifications on and engage with my posts

Crypto_dan_cro - Trend catcher - BTC OnlyCrypto_dan_cro - Trend catcher indicator
This indicator will show you the Macro trend BTC ONLY.
DOTS
Red dots - mean we are in Bearish part of the cycle where prices are expected to drop further
Yellow dots - mean we are in the area where either breakout or breakdown are possible
Green dots - mean we are in a Bullish part of the cycle, where prices are expected to raise
SMA LINE
Crossing below line, will make line red - bearmarket
Crossing above line, will make line green - bullmarket
Trading on the line, will make line yellow - direction still not decided
TOP & BOTTOM
Top - showing you tops
Bottom - showing you bottoms
BREAKOUTS & BREAKDOWNS
BO - BreakOut - showing you change in trend, and prices are expected to raise
BD - BreakDown - showing you change in trend, and prices are expected to drop.
SUPPORT & RESISTANCE
Red squares on the last candle - showing you 3 closest resistances (on every timeframe)
Green squares on the last candle - showing you 3 closest supports (on every timeframe)
Crypto markets are volatile, if you choose to use this indicator in trading, you are doing it on your own. Crypto_dan_cro is not responsible for any profits or losses created by using this Indicator.
Good luck ;)
If you want to get this indicator for free, follow me on
X handle: @crypto_dan_cro
Turn notifications on and engage with my posts
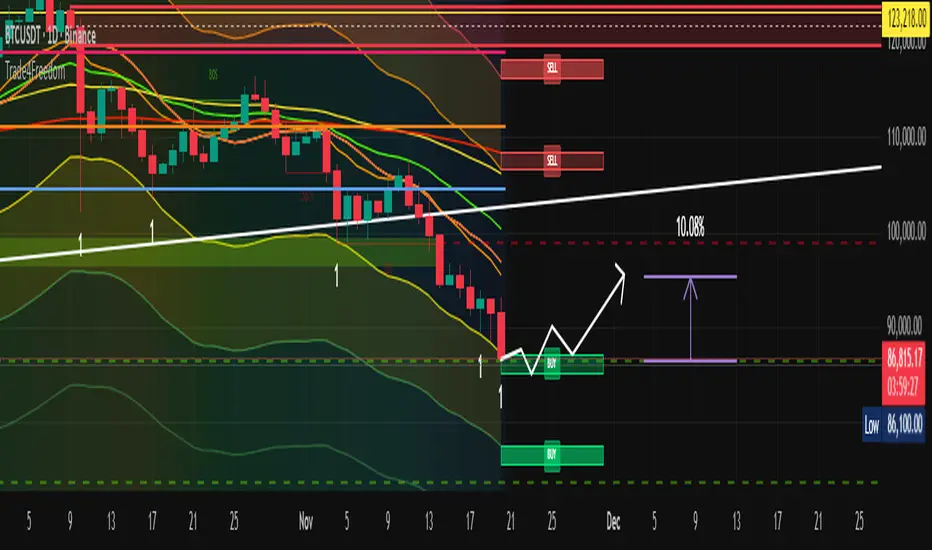
Trade4Freedom## 🔷 Trade4Freedom – Market Logic Framework
**Not a group of indicators. One continuous system of reading market behaviour.**
The script is designed to follow the same decision flow I use in trading.
Every tool here supports the others — there are no standalone modules.
The market is analysed layer by layer, but always as one sequence:
---
### 🔄 **How the logic works (continuous process)**
1. **Structure first** – BOS/ChoCH levels show where the market changed behaviour.
The projected dotted line is not a signal — it is a place where I wait and observe.
I do not enter until price interacts with structure.
2. **Liquidity next** – if the structure level aligns with a liquidity bag (retest),
the zone becomes important. Active liquidity lines are potential targets or
reasons to avoid trading against the area.
3. **Context filter** – I use CCI only when structure + liquidity are already active.
Example of long bias:
−200 level is broken → candle closes above the MA → CCI rises from the channel.
From this point I begin to trail stops and start building position if structure supports it.
4. **Confirmation & positioning**
Stochastic heatmap is not for entries – it confirms pressure.
Divergences on CCI or price are additional evidence when forming or adjusting a position.
5. **Execution zones** – only after structure → liquidity → context,
I use deviation levels (1–5) to define where to place orders.
On higher timeframes they work for accumulation models,
on intraday levels they work for tactical entry zones.
Dev1/Dev2 boxes exist only to make limit-order planning faster.
---
### 📌 **Purpose of the script**
This tool does not predict price or generate signals.
It creates the same structured environment on any chart:
**Structure → Liquidity → Context → Deviation → Decision**
This helps avoid random trading and replaces guessing with logic and observation.
Sphinx Trade ChecklistSphinx Trade Checklist — Your Rule-Based Trading Companion
Sphinx Trade Checklist is not a price-based indicator — it’s a structured decision-making tool designed to help traders follow a consistent, rule-based approach before entering any trade.
This checklist window guides you through a complete top-down analysis process:
1. Bias (Higher Timeframe) — Daily
Start by identifying the overall market bias. Determine whether price is in premium/discount, note any FVGs/imbalances, and confirm the larger directional context. This prevents impulsive trades and keeps you aligned with the dominant flow.
2. Mid-Term Structure — 4H / 1H
Next, analyze the mid-term structure:
• Key swing points
• Liquidity levels
• OB zones / FVGs
• SMT divergence
This section ensures you understand the structural roadmap that price is currently respecting.
3. Micro Entry — 15m / 5m
Finally, refine your entry on the lower timeframes. Look for your specific confirmations such as:
• Liquidity sweeps
• FVGs
• CHoCH / BOS
• Discount / Premium entries
This is the final step before execution, helping you stay disciplined and avoid weak, emotional trades.
⸻
Why This Tool Matters
Most traders lose not because of strategy but because they skip steps, enter too early, or misread the higher timeframe bias.
Sphinx Trade Checklist keeps your process organized, objective, and consistent — forcing you to confirm each layer of analysis before pressing the button.
Whether you’re a beginner building good habits or an advanced trader wanting more structure, this tool helps you stay crystal-clear on your bias, structure, and entry criteria.

Live Session Extremes: Asia / London / NY (5m)This script automatically tracks and plots the live high and low levels of the three major Forex trading sessions:
Asia Session (18:00–03:00) — Teal
London Session (03:00–08:00) — Blue
New York Session (08:00–12:00) — Red
Designed specifically for 5-minute charts, it updates in real time as each session forms new highs or lows.
You always see the most recent session’s levels, cleanly plotted and color-coded on your chart.
✔ Features
Live updating lines for each session’s high & low
Lines anchored to the exact candles that created the extreme
Auto-cleaning: old session levels are deleted when a new session begins
Clear labeling:
Asia High / Asia Low (Teal)
London High / London Low (Blue)
NY High / NY Low (Red)
Extend-right option for projecting session levels into future price action
Built for precision session-based strategies such as:
Liquidity grabs
Session sweeps
BOS/CHOCH analysis
ICT-style trading
High/low power levels

ZigZagZigZag Indicator – Overview
This ZigZag indicator highlights the most important swing highs and swing lows on the chart, helping traders see market structure more clearly by filtering out minor price movements. It connects significant turning points with straight lines, creating a clean visual representation of trend direction and major reversals.
How It Works
Price constantly moves up and down, but not every movement is meaningful. The ZigZag indicator waits for price to make a move large enough to be considered a true swing point. Once such a movement occurs, the indicator identifies it as either a swing high or a swing low and draws a line connecting it to the previous swing.
This produces a simplified outline of market structure, making it easier to recognize trends, corrections, and major turning points.
Settings
ZigZag Length
Controls the sensitivity of the indicator.
Lower values produce more frequent swing points.
Higher values show only major swings and reduce noise.
Show ZigZag
Enables or disables the visual lines. When disabled, the indicator continues tracking swing points internally.
What You See on the Chart
Every time the market creates a confirmed swing high or swing low, the indicator draws a line to the previous swing in the opposite direction.
After a major low is confirmed, a line is drawn to the most recent high.
After a major high is confirmed, a line is drawn to the most recent low.
This creates a clear, continuous zigzag that outlines the dominant movements of the market without reacting to every small fluctuation.
Why This ZigZag Is Useful
It does not repaint once a swing is confirmed.
It provides a clean and simplified view of price structure.
It helps identify trend direction, structure breaks, impulses, and corrections.
It is useful for traders who follow price action, smart money concepts, and swing-based strategies.
Recommended Use Cases
This ZigZag indicator is suited for traders who rely on market structure analysis, including:
Swing trading
Smart Money Concepts (BOS/CHOCH detection)
Identifying impulses and pullbacks
Finding strong highs and lows
Studying overall trend direction

Volume-Confirmed FTR Zones [AlgoPoint]FTR Zone Indicator — Fail To Return Zones (With Volume Confirmation)
Advanced Smart Money Zone Detection for Institutional Orderflow
The FTR Zone Indicator is a professional-grade tool designed for traders who follow Smart Money Concepts (SMC), ICT methodologies, or institutional orderflow. It automatically detects Fail To Return Zones (FTR) — high-probability supply and demand areas formed after strong displacement moves.
By combining impulse detection, base identification, and volume confirmation, this indicator highlights zones where price is most likely to react, reverse, or mitigate shortly after structure breaks.
⸻
⭐ What Are FTR Zones?
FTR zones (Fail To Return zones) are price areas where:
1. A strong displacement / impulse candle is formed
2. That impulse originates from a small consolidation (base)
3. Price moves away aggressively
4. AND fails to return immediately to the origin area
These zones often indicate:
• Institutional orders
• Imbalance
• Hidden liquidity
• Origin of a trend leg
• High-probability mitigation points
This indicator fully automates the detection and visualization of such areas.
🔍 How the Indicator Works
1. Impulse Detection
The indicator identifies a valid impulse candle using:
• ATR-based bar range filter
• Trend-aligned candle body direction
• Optional volume confirmation
Only large, meaningful institutional candles qualify — filtering out noise.
2. Base Zone Identification
Before every impulse, the tool finds the micro-consolidation base using:
• Highest high of the last X bars
• Lowest low of the last X bars
This base becomes the potential FTR zone.
3. FTR Zone Creation
When a valid impulse is detected:
• Bullish impulse → Demand FTR zone
• Bearish impulse → Supply FTR zone
The zone is immediately drawn on the chart using box.new().
4. Zone Extension
Every zone continuously extends to the right as price evolves, allowing you to track:
• Mitigation
• Retests
• Reaction points
• Liquidity sweeps
5. Invalidation Logic
Zones automatically delete when violated:
• Demand zone invalid if close < zone low
• Supply zone invalid if close > zone high
This keeps the chart clean and helps focus only on active, high-value areas.
🎛️ Key Features
✔ Automatic FTR Zone Detection
Instantly identifies institutional origin zones based on real impulse and displacement.
✔ Volume-Based Filtering
Ensures only high-volume impulses (true institutional orders) create zones.
✔ Supply & Demand Coloring
• Bullish FTR → Demand Zone (Teal tone)
• Bearish FTR → Supply Zone (Red tone)
✔ Safe Zone Storage
Fault-tolerant logic ensures no array errors, invalid zones, or broken visuals.
✔ Auto-Extending Boxes
Real-time zone updates with precise historical mapping.
✔ Smart Invalidation
Zone is removed only when fully broken, preventing false signals.
✔ Clean, Non-Repainting Logic
Impulse detection and zone placement are confirmed only on bar close.
📈 How to Use It (Example Schenarios)
For Reversals or Continuations
• Look for price reacting or mitigating inside a zone
• Use as entry confirmation in trend continuations
• Combine with FVG, BOS/CHOCH, liquidity sweeps, or premium/discount zones
For Scalping or Intraday Trading
• High-probability countertrend entries
• Reaction-based setups at institutional footprints
For Swing Traders
• Identify weekly/daily origin zones
• Plan entries around large displacement points

Dashti XAU Liquidity Map ELITE"No Sweep = No Trade
No BOS = No Trade
No Killzone = No Trade
No Volume = No Trade"

MPT with alert [Anson]MPT with alert
From Multi Pivot Trend
I made a few small changes and added an alert function.
Instead of relying on a single swing length, it tracks breakouts across ten increasing pivot lengths — then averages their behavior to produce a smooth, reliable trend reading.
Mitigation logic (close, wick, or HL2 touches) controls how breakouts are confirmed, giving traders institutional-style flexibility similar to BOS/CHoCH validation rules.
This indicator not only colors candles based on trend strength, but also extends trend strength and volatility-scaled projection candles to show where trend pressure may expand next.
Pivot breakout lines and labels mark key changes, making the trend transitions extremely clear.

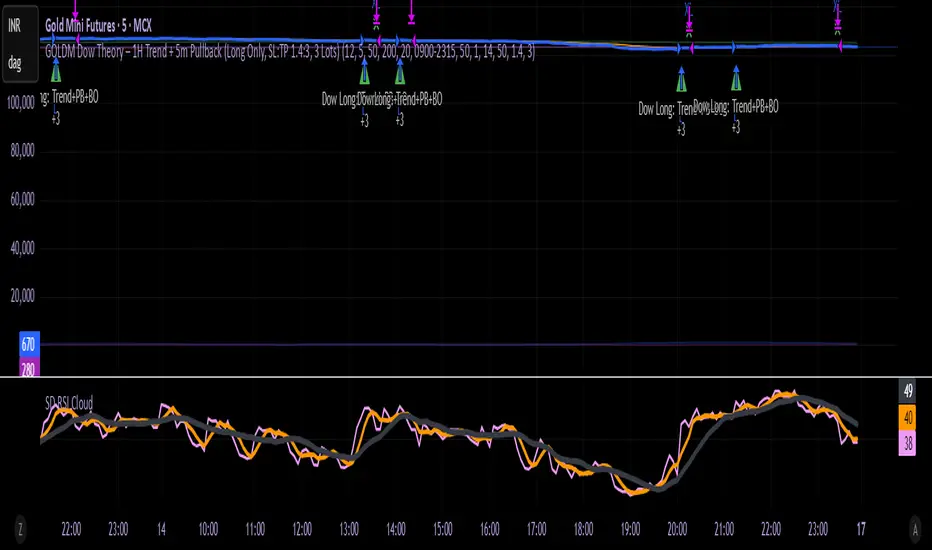
GOLDM Dow Theory – 1H Trend + 5m Pullback1. Strategy Overview
Instrument: MCX GOLDM
Chart timeframe: 5 minutes
Side: Long-only
Position size: Fixed 3 lots
Core idea:
Trade only in 1H uptrend, enter after a 5m pullback and breakout, with basic volume/volatility filters and ATR-based SL/TP.
2. High-Level Logic Flow (Per Bar)
On every 5-minute bar, the script does this:
Update session/time, volume, and ATR filters
Read 1H trend from higher timeframe
Update 5m pullback state (whether a valid dip happened)
Check if there is a valid breakout back in the direction of the 1H trend
If all filters + conditions align → enter Long (3 lots)
While in a trade:
Manage SL/TP using ATR
Close trade if 1H trend flips down or price closes below 5m EMA
Everything else (plots, alerts) is just for visibility and convenience.
3. Inputs & Configuration
Main inputs:
pullbackLookback – how many 5m bars to look back to detect a pullback
breakoutLookback – how many bars to consider for recent swing high
emaLenTrendFast / emaLenTrendSlow – 1H EMAs (50/200) for trend
emaLenPullback – 5m EMA used for pullback logic (default 20)
tradeSession – default "0900-2315" (you can change)
volLookback, volMult – volume filter
atrLen, atrSmaLen – ATR filter
slATRmult (1.4), tpATRmult (3.0) – ATR multiples → ~1.4 : 3 RR
4. Session / Time Filter
tradeSession = "0900-2315"
inSession = not useSessionFilter or not na(time(timeframe.period, tradeSession))
Only allows entries when the current bar’s time is inside 09:00–23:15.
If useSessionFilter is false, this filter is ignored.
No trade opens outside this window, but existing trades can still exit.
5. Volume & Volatility Filters
Volume Filter
avgVol = ta.sma(volume, volLookback)
highVolume = not useVolumeFilter or (volume > avgVol * volMult)
If enabled, current bar’s volume must be greater than average volume × multiplier.
Purpose: avoid thin, illiquid periods.
ATR Filter
atr5 = ta.atr(atrLen)
atrSma = ta.sma(atr5, atrSmaLen)
goodATR = not useATRFilter or (atr5 > atrSma)
If enabled, current ATR must be above its own moving average.
Purpose: avoid flat / extremely low-volatility periods.
Only if both highVolume and goodATR are true, the system considers entering.
6. Higher Timeframe Trend (1H)
emaFast1h = request.security(syminfo.tickerid, "60", ta.ema(close, emaLenTrendFast), ...)
emaSlow1h = request.security(syminfo.tickerid, "60", ta.ema(close, emaLenTrendSlow), ...)
trendUp = emaFast1h > emaSlow1h
trendDown = emaFast1h < emaSlow1h
On the 1-hour timeframe:
If EMA Fast (50) > EMA Slow (200) → trendUp = true
If EMA Fast (50) < EMA Slow (200) → trendDown = true
This is the core trend filter:
We only look for longs when trendUp is true.
7. 5-Minute Structure Logic (Dow-style)
7.1 Pullback Detection
emaPull = ta.ema(close, emaLenPullback)
pulledBackLong = ta.lowest(close, pullbackLookback) < emaPull
A pullback is defined as:
In the last pullbackLookback bars, price closed below the 5m EMA (emaPull) at least once.
This indicates a dip against the 1H uptrend.
A state flag tracks this:
var bool hadLongPullback = false
hadLongPullback := trendUp and pulledBackLong ? true : (not trendUp ? false : hadLongPullback)
When:
trendUp AND pulledBackLong → hadLongPullback = true.
If the trend stops being up (trendUp = false), flag resets to false.
So the system remembers:
“There has been a proper dip while the 1H uptrend is active.”
7.2 Breakout Confirmation
recentHigh = ta.highest(high, pullbackLookback)
breakoutUp = close > recentHigh
After a pullback, we wait for price to close above the highest high of recent bars (excluding the current one).
This mimics:
“Higher high after a higher low” → breakout in Dow Theory terms.
8. Final Long Entry Logic
The base entry condition:
baseLongEntry =
trendUp and
hadLongPullback and
breakoutUp and
close > emaPull
Translated:
1H trend is up (trendUp).
A valid pullback happened recently (hadLongPullback).
Current candle broke above the recent swing high (breakoutUp).
Price is now back above the 5m EMA (pullback is resolving, not deepening).
Then filters are applied:
longEntryCond =
baseLongEntry and
inSession and
highVolume and
goodATR and
not isLong
So a long entry only occurs if:
Core structure conditions (baseLongEntry) are true
Time is within session
Volume is high enough
ATR is healthy
You are not already in a long
When longEntryCond is true:
if longEntryCond
strategy.entry("Long", strategy.long, comment = "Dow Long: Trend+PB+BO")
hadLongPullback := false
Enters 3 lots long (as per default_qty_type + default_qty_value).
Resets hadLongPullback so we don’t re-use the same pullback.
9. Exit Logic
There are two exit layers:
9.1 Logical Exit (Trend or Structure Change)
exitLongTrendFlip = trendDown
exitLongEMA = ta.crossunder(close, emaPull)
longExitCond = isLong and (exitLongTrendFlip or exitLongEMA)
If in a long:
Exit when trend flips down (1H EMA50 < EMA200), OR
Price crosses below 5m EMA (pullback may be turning into reversal).
Then:
if longExitCond
strategy.close("Long", comment = "Exit Long: Trend flip / EMA break")
This closes the position at market (on bar close).
9.2 ATR-based Stop Loss & Take Profit
if useSLTP and isLong
longStop = strategy.position_avg_price - atr5 * slATRmult
longLimit = strategy.position_avg_price + atr5 * tpATRmult
strategy.exit("Long SLTP", "Long", stop = longStop, limit = longLimit)
SL = entry price – 1.4 × ATR(14, 5m)
TP = entry price + 3.0 × ATR(14, 5m)
This gives roughly 1.4 : 3 RR.
If SL or TP is hit, strategy.exit will close the trade.
So exits can come from:
Hitting Stop Loss
Hitting Take Profit
OR logic-based exit (trend flip / EMA break)
10. Alerts
Two alertconditions:
alertcondition(longEntryCond, title="Long Entry Signal",
message="GOLDM LONG: 1H Uptrend + 5m Pullback Breakout + Filters OK")
alertcondition(longExitCond, title="Long Exit Signal",
message="GOLDM LONG EXIT: Trend flip or EMA break")
You can set TradingView alerts based on:
“Long Entry Signal” → tells you when all entry conditions align.
“Long Exit Signal” → tells you when the logic-based exit triggers.
(ATR SL/TP exits won’t auto-alert unless you separately set price alerts or add extra conditions.)
11. Mental Model Summary (How YOU should think about it)
For every trade, the system is basically doing this:
Is GOLDM in an uptrend on 1H?
→ If no: do nothing
Did we get a clear dip below 5m EMA in that uptrend?
→ If no: wait
Did price then break above recent highs and reclaim EMA20?
→ If yes: this is our Dow-style continuation entry
Is market liquid and moving (volume + ATR)?
→ If yes: go Long with 3 lots
Manage with:
ATR SL & TP
Exit early if 1H trend flips or price falls back below EMA20
Break & Retest + Liquidity Sweep EntryIdentify a BOS (vertical line appears).
Wait for price to retest the broken level (circle shows up).
Optionally confirm with liquidity sweep.
Enter long/short trades based on bullish/bearish retest signals.
Use ATR or personal risk management for stop-loss placement.

MOMO – Imbalance Trend (SIMPLE BUY/SELL)MOMO – Imbalance Trend (SIMPLE BUY/SELL)
This strategy combines trend breaks, imbalance detection, and first-tap supply/demand entries to create a clean and disciplined trading model.
It automatically highlights imbalance candles, draws fresh zones, and waits for the first retest to deliver precise BUY and SELL signals.
Performance
On optimized settings, this strategy shows an estimated 57%–70% win-rate, depending on the asset and timeframe.
Actual performance may vary, but the model is built for consistency, discipline, and improved decision-making.
How it works
Detects trend structure shifts (BOS / Break of Trend)
Identifies displacement (imbalance) candles
Creates supply and demand zones from imbalance origin
Waits for first tap only (no second chances)
Confirms direction using trend logic
Generates clean BUY/SELL arrows
Automatic SL/TP based on user settings
Features
Clean BUY/SELL markers
Auto-drawn supply & demand zones
Trend break markers
Imbalance tags
Smart first-tap confirmation
Customizable stop loss & take profit
Works on crypto, gold, forex, indices
Best on M5–H1 for day trading
Note
This strategy is designed for day traders who want clarity, structure, and zero emotional trading.
Use it with discipline — and it will serve you well.
Good luck, soldier.

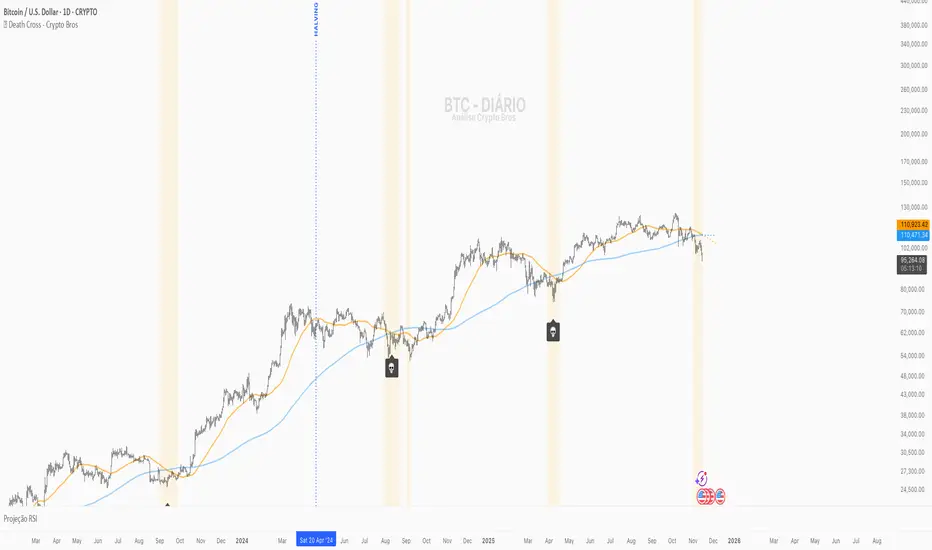
💀 Death Cross - Crypto Bros💀 Death Cross – Crypto Bros
Identify the most important crossover of CRYPTO:BTCUSD and visualize attention zones before and after the event.
What This Indicator Does
The Death Cross – Crypto Bros indicator monitors the structural relationship between the 50-period and 200-period moving averages, using a selectable timeframe (default: 1D).
It provides three core features:
1. Death Cross Detection
The Death Cross occurs when the MA50 crosses below the MA200.
The indicator automatically displays:
- a 💀 callout below the candle
- a highlighted background
- optional alerts
2. Attention Zone (Before and After the Cross)
The indicator highlights bars where structural weakness is developing.
Before the Death Cross:
- MA50 above MA200
- MA50 pointing downward
- Distance between MAs ≤ 4% (configurable)
After the Death Cross:
- MA50 below MA200
- MA50 still pointing downward
- Distance between MAs ≤ 4%
This creates a clear visual map of structural weakness around the cross.
3. MA Projections
Dotted projection lines show the current slope and momentum of MA50 and MA200.
When to Use It
This indicator is designed for traders who want to:
- spot early macro weakness
- manage exposure near trend shifts
- avoid premature long entries
- track Bitcoin's macro structure
- combine it with other confluence tools
Key Settings
- Timeframe for MAs – default 1D
- Type of Moving Average – SMA (default) or EMA
- Attention Zone – background color + maximum MA distance (%)
- Projections – enable/disable dotted forward MAs
Alerts Available
You can enable:
- Death Cross Alert
Triggers when MA50 crosses downward through MA200.
- Attention Zone Start
Triggers when the Attention Zone becomes active for the first time.
Create one or both depending on your strategy.
How to Interpret the Visuals
- 💀 Highlighted Candle + Skull Icon
→ The Death Cross has occurred.
- 🟡 Attention Zone Before the Cross
→ MA50 is turning downward and approaching MA200.
- 🟠 Attention Zone After the Cross
→ Post-cross weakness remains elevated.
- 🔮 MA Projections
→ Show the directional momentum of MA50 and MA200.
Suggested Confluence Tools
For better accuracy, combine with:
- RSI
- OBV
- Market Structure (BOS/CHoCH)
- Volume
- Macro sentiment
About This Indicator
Created for the Crypto Bros community to deliver:
- clean macro trend visualization
- early warning signals
- smart exposure and risk management
Feedback & Improvements
If you’d like more features or enhancements, feel free to reach out!