Relative Strength Index w/ STARC Bands and PivotsThis is an old script that I use with some useful RSI strategies from "Technical Analysis for the Trading Professional" 2nd edition by Constance Brown.
The base RSI comes with the option for custom length, and has some pre-configured ranges for looking at exits and entrances. The idea is to be bullish when bounces happen in the red zone during an already bullish trend or when the indicator enters green without a rejection. Be bearish if the indicator falls through the red zone or fails to enter green during an already bearish trend.
I have added the formulas used for creating STARC bands (just think fancier volatility bands) with adjustable tolerances. The idea is to look out for when the RSI touches one of the bands and reverses. This is usually indicative of a strong reversal (though the timing will be up to the trader). Best use this on shorter time frames during a volatile time of a stock's price action.
Although a little messy, there is a small segment of the script which includes pivot points. I like to use these because they make indicating local highs/lows for finding divergences easier.
Finally, I have added a couple of customizable EMAS for the RSI itself. Useful when combined with the other features!
Rsi-2

CoffeeShopCrypto 3pl MAThe CoffeeShopCrypto 3pl MA indicator is a technical analysis tool that uses three different moving averages to identify trends in the price of an asset. The three moving averages have lengths of 12, 26, and 50. If these numbers sound familiar its because they are based off the standard of the MACD indicator, and can be either simple moving averages (SMA) or exponential moving averages (EMA), depending on user preference.
The following is plotted on the chart
The fast EMA/SMA (based on the 12-period length) in yellow.
The mid EMA/SMA (based on the 26-period length) in gray.
The slow EMA/SMA (based on the 50-period length) in either green or red, depending on whether the current close price is above or below the Overall Trend MA.
In addition to the moving averages, the indicator also calculates the MACD (Moving Average Convergence Divergence), and uses it to color the bars based on the momentum of the asset.
The MACD is calculated using two user-defined lengths (fast and slow), as well as a user-defined smoothing length for the signal line. The oscillator and signal line can be either SMA or EMA, and the colors of the MACD bars are based on whether the histogram is growing or falling, and whether it is above or below the zero line.
Overall, this indicator provides traders with a comprehensive tool for understanding the trend of an asset, as well as the momentum behind that trend. The moving averages provide a clear visual representation of the trend, while the MACD bars give insight into the strength of that trend and potential shifts in momentum.
---------------LONG ENTRY----------------
MA1 above MA2 and Overall trend = Green
IF RSI is above its midline you are confirmed for a long entry
-----------Short Entry--------------
MA1 below MA2 and Overall trend = Red
IF RSI is below its midline you are confirmed for a short entry

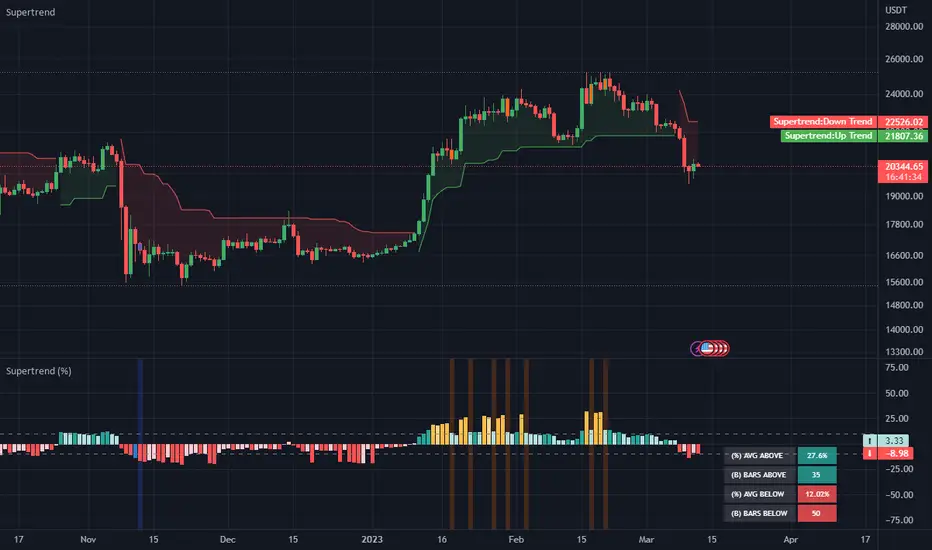
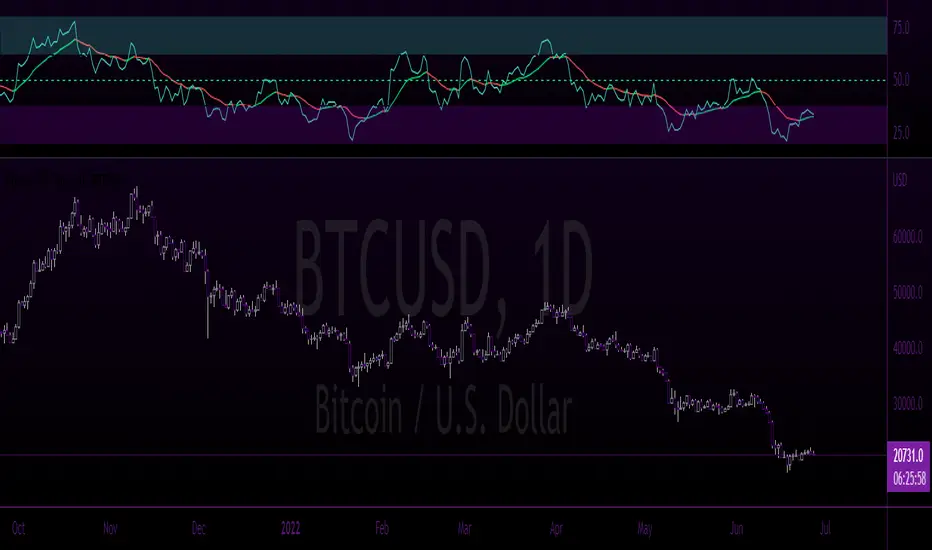
Supertrend Mean Reversion Index [HODLER]This indicator was created primarily as an experiment. While the supertrend can be powerful, in many cases, the trend has already started before the time it's identified, resulting in a price decrease. After conducting my own research, I discovered that the reversal point is often more nearby during the downtrend, rather than at the beginning of the uptrend. Surprisingly, this point is always based on the average percentage below or above the supertrend. The indicator calculates these averages, usually starting below the uptrend point, and in most cases, the trend continues upward from there.
This indicator can be very useful for checking corrections. For example, setting the percentages manually to around 50-60% on BTC 1d, I am impressed by how accurate the indication is. Although there might be other more professional ways to calculate this, I still find it amusing that we can use this indicator to make these calculations as well.
To use the indicator, you will need to set the ATR length and ATR factor, which are self-explanatory. The next settings are the ATR lookback and Percentages Stored. The ATR lookback is the ladder price from which the calculation begins, and Percentages Stored is the maximum number of the highest and lowest percentages from previous data points that are stored to calculate the average percentage.
The supertrend percentage settings can be manually set to adjust your percentage up or down, but if left at 0, it will be calculated automatically based on the above-mentioned settings. You can also set an offset to slightly deviate above or below the average to yield better results. The last supertrend setting is the minimum number of bars that must be considered before checking whether the value is above or below the average.
To filter out some noise, I have added Relative Strength Index (RSI). The values above and below are determined by whether the RSI moving average is above or below certain thresholds.
Please note that this indicator was created for my own research. While it can be very accurate with the right settings, you should always use it in combination with other technical analyses to validate your entry and exit points. If you have any suggestions to improve the indicator, please let me know in the comments. I would really appreciate it!
Negroni MA & RSI Strategy, plus trade entry and SL/TP optionsI will start with the context, and some things to think about when using a strategy tool to back-test ideas.
CONTEXT
FIRST: This is derived from other people's work, but I honestly hadn't found a mixed indicator MA strategy tool that does what this now does. If it is out there, apologies!!
This tool can help back-test various MA trends (SMA, EMA, HMA, VWMA); as well as factoring in RSI levels (or not); and can factor in a fixed HTF MA (or not). You can apply a 'retest entry' or a 'breakout entry', and you can also apply various risk mgt for SL/TP orders: 1) No SL/TP; or 2) a fixed %, or 3) dynamic ATR multipliers.
Find below, some details explaining what this tool is attempting to do.
Thank you, tack, salute!
THINGS TO REVIEW (it is not just about 'profitability'!!)
Whilst discretion is always highly encouraged as a trader, and a 100% indicator-driven strategy is VERY unlikely to yield sustainable results going forward, at the very least back-testing your strategies can help provide some guidance, not just on win rate Vs profit factor, but other things including:
a) Trade frequency: if a strategy has an 75% win rate and profit factor of 4, with all your parameters and confluence checks, but only triggers 3 trades every 5 years, is that realistically implementable to your trading situation if you have a $10,000 account?
b) Trade entry type: is it consistently better to wait for a retest of an 'MA zone', or is it better to market buy/sell on breakout of the 'MA zone'?
c) Risk management (SL/TP): is it consistently better to have a fixed static % for SL/TP ("I always place my stops 2% away, whether it is EURUSD or BTCUSDT"), or would you be better placed to try using an ATR multiplier of the respective assets?
d) Moving average type: is your old faithful 100 EMA really serving you well, or is the classic SMA more reliable, or how about the HMA, or the VWMA? Is the 100/200 cross holding up, or do you need something more sensitive? Is there any significant difference between a 10 EMA/20 EMA trend zone compared to a 13 EMA /25 EMA zone?
e) Confluence: Do added confluence checks (RSI, higher timeframe MA) actually improve profitability? But even if they do, is at the cost of cutting too many trades?
INPUTS AND PARAMETERS
Choice 1) Entry Strategy: Retest or Breakout - You can select both!
[ ]:
a) RETEST entry strat: price crosses UNDER FastMA INTO the 'MA trend zone'.
b) BREAKOUT entry strat: price crosses OVER FastMA OUT the 'MA trend zone'.
Choice 2) Risk Management (SL and TP) - You can select more than 1 strategy!
a) No SL/TP: Long trades are closed when the LOW crosses back UNDER the fastMA again, and shorts are closed when the HIGH crosses back OVER the fastMA again.
b) Static % SL/TP: Your SL/TP will be a fixed % away from avg. position price... WARNING: You should change this for various asset classes; FX vol is not the same as crypto altcoin vol!
c) Dynamic ATR SL/TP: Your SL/TP is a multiple of your selected ATR range (default is 50, see 'info' when you select ATR range). ATR accounts for the change in vol of different asset classes somewhat, HOWEVER... you should probably still not have the same multiplier trading S&P500 as you would trading crypto altcoins!
Then select your preferred parameters: EMA, SMA, HMA, VWMA, etc. You can mix and match, and most options have a info/tooltip guide.
RSI note: If you don't care for RSI levels, then set buy signal at 1... i.e always buys! Similarly set sell signal at 99.
ATR note: standard ATR length is usually 14, however... your SL/TP will move POST entry, and can tighten or widen your initial SL/TP... for better AND usually for worse! Go find a trade (strat 3) on the chart, look at the SL/TP lines, now change the number to 5, you'll see.
Fixed HTF MA note: If you don't care for HTF MA confluence, just change the timeframe/options to match the 'Slow MA' options you've chosen.

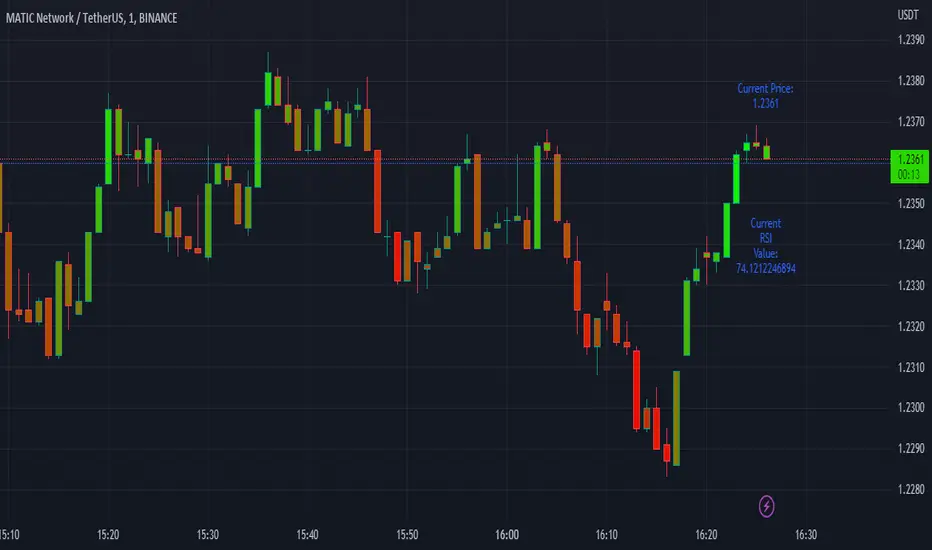
Easy RSI by nnamWhat Does this Indicator Do?
The Easy RSI Indicator color codes candles based on their RSI Value vs. Open / Close (Red / Green). It plots the current price and current RSI value on the chart in real-time. Additionally, when the RSI Value is in an oversold or overbought condition, it plots that signal on the chart in real-time.
The initial candle color is the standard Red / Green Tradingview color, but a Gradient is added to the color which either darkens or lightens the color based on the RSI Value.
As seen in the screenshot below, the higher the RSI Value, the brighter the Green Color is. The lower the RSI Value, the brighter the Red Color is.
The current Price and current RSI Value are both plotted on the chart by default, but can be optionally switched off by the trader.
As seen in the screenshot below, the prices and RSI Values are easily seen while visually tracking the price in real-time.
RSI Overbought Values are plotted when the Overbought condition is triggered. The Default is RED for Overbought and GREEN for Oversold.
As seen in the screenshot below, with all three labels turned on under the input settings (these are ON by default) you can see the overbought condition, the current RSI Value, and current price all in one centralized area. Oversold Values are also plotted when turned on under the input settings.
As shown in the screenshot below, the candle is GREEN (as evident by the green candle outline) but the RSI Value is low and shows lower than average relative strength. This turns the bar color ORANGE vs, GREEN showing that the relative strength of the move is subpar.
As shown on the screenshot below, if the trader has the standard Tradingview Price label switched on (in the Tradingview Chart Settings), the color of the bar is also translated to the price are for an easy to recognize RSI Value just by looking at the price. Even if the current candle is RED, when the RSI is higher than lower, the color will be green / greenish and even if the current candle is GREEN, when the RSI Value is lower than higher, the color will be red-ish / orange in color giving the user a quick view of RSI Value.
If you have any questions or feature requests for this Indicator please do not hesitate to reach out and ask.
GOOD LUCK trading!!
~nnamdert
RSI Overbought/Oversold + Divergence IndicatorDESCRIPTION:
This script combines the Relative Strength Index ( RSI ), Moving Average and Divergence indicator to make a better decision when to enter or exit a trade.
- The Moving Average line (MA) has been made hidden by default but enhanced with an RSIMA cloud.
- When the RSI is above the selected MA it turns into green and when the RSI is below the select MA it turns into red.
- When the RSI is moving into the Overbought or Oversold area, some highlighted areas will appear.
- When some divergences or hidden divergences are detected an extra indication will be highlighted.
- When the divergence appear in the Overbought or Oversold area the more weight it give to make a decision.
- The same color pallet has been used as the default candlestick colors so it looks familiar.
HOW TO USE:
The prerequisite is that we have some knowledge about the Elliot Wave Theory, the Fibonacci Retracement and the Fibonacci Extension tools.
Wave 1
(1) When we receive some buy signals we wait until we receive some extra indications.
(2) On the RSI Overbought/Oversold + Divergence Indicator we can see a Bullish Divergence and our RSI is changing from red to green ( RSI is higher then the MA).
(3) If we are getting here into the trade then we need to use a stop loss. We put our stop loss 1 a 2 pips just below the lowest wick. We also invest maximum 50% of the total amount we want to invest.
Wave 2
(4) Now we wait until we see a clear reversal and here we starting to use the Fibonacci Retracement tool. We draw a line from the lowest point of wave(1) till the highest point of wave (1). When we are retraced till the 0.618 fib also called the golden ratio we check again the RSI Overbought/Oversold + Divergence Indicator. When we see a reversal we do our second buy. We set again a stop loss just below the lowest wick (this is the yellow line on the chart). We also move the stop loss we have set in step (3) to this level.
Wave 3
(5) To identify how far the uptrend can go we need to use the Fibonacci Extension tool. We draw a line from the lowest point of wave(1) till the highest point of wave (1) and draw it back to the lowest point of wave (2). Wave (3) is most of the time the longest wave and can go till it has reached the 1.618 or 2.618 fib. On the 1.618 we can take some profit. If we don't want to sell we move our stop loss to the 1 fib line (yellow line on the chart).
(6) We wait until we see a clear reversal on the Overbought/Oversold + Divergence Indicator and sell 33% to 50% of our investment.
Wave 4
(7) Now we wait again until we see a clear reversal and here we starting to use the Fibonacci Retracement tool. We draw a line from the lowest point of wave(2) till the highest point of wave (3). When we are retraced till the 0.618 fib also called the golden ratio we check again the RSI Overbought/Oversold + Divergence Indicator. When we see a reversal we buy again. We set again a stop loss just below the lowest wick (this is the yellow line on the chart).
(8) If we bought at the first reversal ours stop los was triggered (9) and we got out of the trade.
(9) If we did not bought at step (7) because our candle did not hit the 0.618 fib or we got stopped out of the trade we buy again at the reversal.
Wave 5
(10) To identify how far the uptrend can go we need to use the Fibonacci Extension tool. We draw a line from the lowest point of wave(2) till the highest point of wave (3) and draw it back to the lowest point of wave (4). Most of the time wave 5 goes up till it has reached the 1 fib. And that is the point where we got out of the trade with all of our investment. In this trade we got out of the trade a bit earlier. We received the sell signals and got a reversal on the Overbought/Oversold + Divergence Indicator.
We are hoping you learned something so you can make better decisions when to get into or out of a trade.
If you have any question just drop it into the comments below.
FEATURES:
• You can show/hide the RSI .
• You can show/hide the MA.
• You can show/hide the lRSIMA cloud.
• You can show/hide the Stoch RSI cloud.
• You can show/hide and adjust the Overbought and Oversold zones.
• You can show/hide and adjust the Overbought Extended and Oversold Extended zones.
• You can show/hide the Overbought and Oversold highlighted zones.
• Etc...
HOW TO GET ACCESS TO THE SCRIPT:
• Favorite the script and add it to your chart.
REMARKS:
• This advice is NOT financial advice.
• We do not provide personal investment advice and we are not a qualified licensed investment advisor.
• All information found here, including any ideas, opinions, views, predictions, forecasts, commentaries, suggestions, or stock picks, expressed or implied herein, are for informational, entertainment or educational purposes only and should not be construed as personal investment advice.
• We will not and cannot be held liable for any actions you take as a result of anything you read here.
• We only provide this information to help you make a better decision.
• While the information provided is believed to be accurate, it may include errors or inaccuracies.
Good Luck and have fun,
The CryptoSignalScanner Team

Bender Money Flow Index MTF with Buy & Sell SignalsMFI = Money Flow Index
MTF = Multi Timeframe
The Money Flow Index (MFI) is a technical indicator that can generate sentiment insight or pressure using both price and volume data.
Configurable Indicator Signals
Signal on MFI line directional changes
Invalidate Signal if not in a overbought or oversold pressure zone
Invalidate signal if MFI line is not in confluence with the moving average
Invalidate signal after a defined number of bars in the opposing direction
Please Note:
This indicator is also embedded in the Bender Bot strategy script. Signals and confluence identified by this indicator can be used to autonomously mange strategies. The below features will not have any effect on this indicator's functionality when used as a stand alone indicator.
Bender Bot Strategy Confluence
Require any signal and MFI directional confluence before opening any trade
Require any signal and MFI and Moving average to be in confluence before opening any trade
Require any signal to be in directional confluence with the full MFI signal
Please feel free to contact me with any questions or concerns.

Volume RSIThis is an indicator that shows the inflow and outflow of volume into a financial instrument. Volume is likely one of the most underrated source of data in trading unfortunately so there seems to be a lack of studies on it. The size of the candle is related to the strength of the move. The calculations for this are: cumulative sum of +volume if open < close OR -volume if open > close. This has been now transformed into an rsi style indicator to give a distinct advantage (or atleast thats the idea). The idea is that we take rsi of candles so we might as well take the rsi of volume candles. As far as I can tell it is faster/its own thing compared to regular rsi. I ave also added a smoothing option. Dont forget you can change the settings and you wont die. Thank you for your interest in this release I hope you find great piles of money with it.
link to the script I used to make this

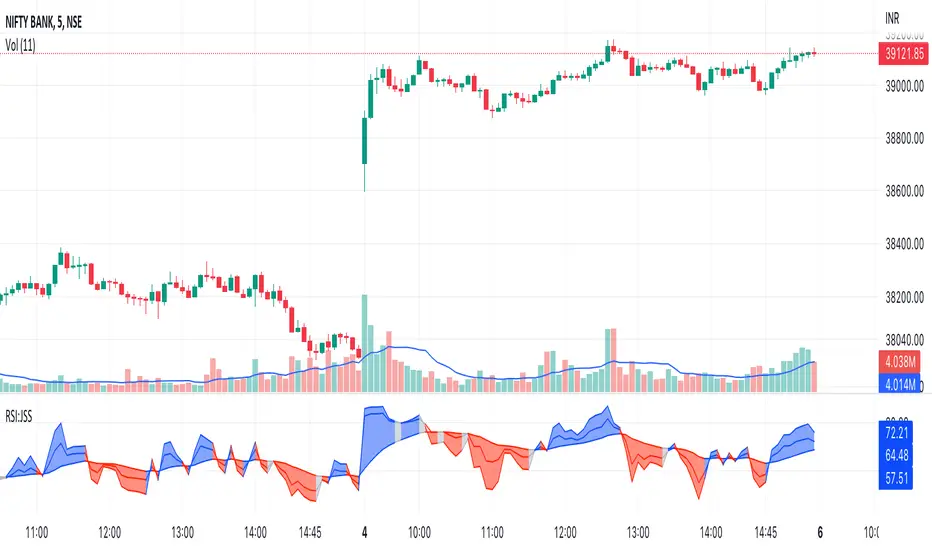
JSS:Relative Strength Index//Date: 5-Oct-22
//Author: Jatinder Sodhi
RSI Indicator with colour coding.
Blue - Long
Red - Short
Gray - Stay Out
Best used for Intraday on 5 minute charts. Works well on other timeframes as well.
@Inspired from Asit Baran's RankDelta-RSI Indicator.
Relative Strength Index with fast and slow MAsThis is the typical Relative Strength Index indicator with two moving averages, one slow (length 50 by default) and one fast (length 20 by default). Additionally, there are four lines, which mark the oversold/overbought signals at different levels, there are two inner bands with values at the levels 40, and 60, and two outer bands at the levels 20, and 80. The presence of the fast and slow moving averages and their crossover/crossunder with the oversold/overbought levels or the RSI can provide more insightful and faster signals. The indicator has a slightly different colouring mechanism.
The views of the RSI indicator on the above the price chart in both dark and light modes:

RSI+OBVthis strategy works on the basis of crossovers of RSI at different period and OBV at different periods (separately). I am using it for Nifty and Bank Nifty. Entry for long can be taken when green bar appears; and exit has to be done when it disappears. Entry for short has to be taken when red bar appears; and exit has to be done when it disappears.
With little help from price action good results can be achieved.

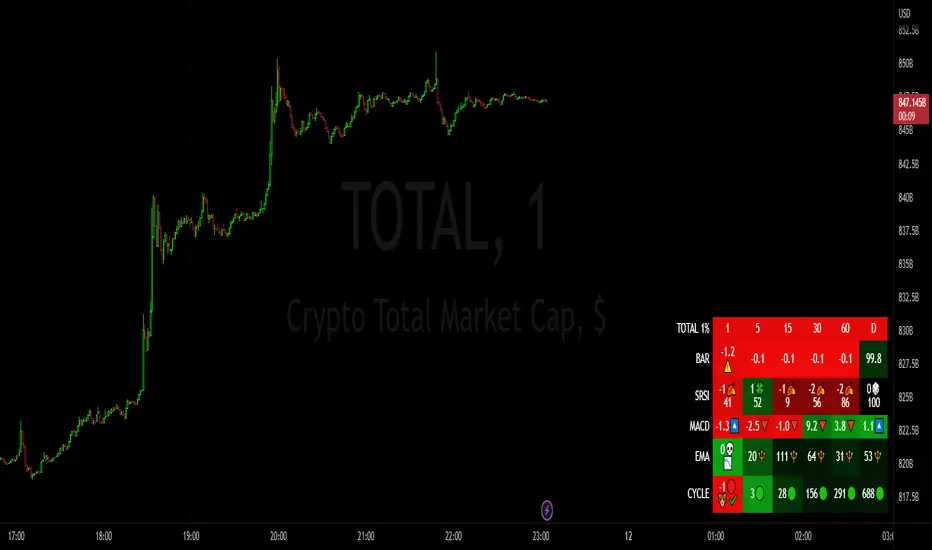
Market StatsIn this exciting new indicator...!
- You are able to select 6 different timeframes: 1 minute, 60 minute, 1 day, weekly, monthly, anything you please!
- With these timeframes, you are able to compare the different tema dema crossing percentages, to know whether the selected or current ticker is in an uptrend or downtrend!
- You are also able to formulate your very own EMA ratios to see in these different timeframes, or use the default, carefully optimized default EMA ratios per timeframe, to ultimately reveal the desired trends and whether these are in your favor for your position!
- Lastly, you have the RSI values at full display, also carefully optimized, for best alignment in indication of the current trend. To top it off, these RSI values are also displayed on the chart as well, should you choose to have it on display.
SUPER RSI [Gabbo]RSI revolutionizes the classic RSI by allowing you to modify its behavior based on different chart types and dynamic multi-source calculations.
It’s designed for traders who want greater precision and adaptability in momentum analysis across various market conditions.
Whether you want to apply the RSI on alternative candles like Heikin Ashi, Renko, or even combine multiple data sources, this tool provides maximum flexibility.
🔷 Key Features
🟩Customizable Chart Inputs
Apply RSI calculations not only on traditional candles but also on alternative bar types like Heikin Ashi, Kagi, Line Break, Point & Figure, and Renko for a deeper understanding of trend strength.
🟩Multi-Source Aggregation
Blend multiple sources together to create a more stable and refined RSI signal. Combine 2, 3, 4, or even 5 different sources into a single input.
🟩Dynamic RSI and Bands
Unlock advanced options to dynamically adjust the RSI itself and its surrounding bands based on real-time price action.
🔷 Technical Details and Customizable Inputs
1️⃣ Bar Type Selection:
Choose the type of chart structure used for RSI calculation:
Candles (classic)
Heikin Ashi
Kagi
Line Break
Point & Figure
Renko
2️⃣ Use Different Source???
Activate multi-source RSI by combining multiple elements:
2 sources : (Source 1 + Source 2) ÷ 2
3 sources : (Source 1 + Source 2 + Source 3) ÷ 3
4 sources : (Source 1 + Source 2 + Source 3 + Source 4) ÷ 4
5 sources : (Source 1 + Source 2 + Source 3 + Source 4 + Source 5) ÷ 5
3️⃣ Use Dynamic RSI???
Enable a dynamic RSI calculation that adjusts in real-time to market behavior for greater responsiveness.
4️⃣ Use Dynamic Band???
Enable dynamic bands that adapt to price action rather than relying on fixed static thresholds.
🔍 How to Use Dynamic RSI Source Pro
📈 Choose Your Candle Type
Select the bar format that best matches your strategy needs—classic candles, Heikin Ashi, Renko, and more.
🧩 Customize Your Data Source
Activate multi-source input to create smoother, more reliable RSI signals.
⚡ Unlock Dynamic Adaptation
Enable dynamic RSI and bands to adjust automatically to live price movements and enhance signal accuracy.
☄️ With Dynamic RSI Source Pro, you can elevate your RSI analysis by applying it dynamically across multiple candle types and sources, giving you a new level of control and precision.

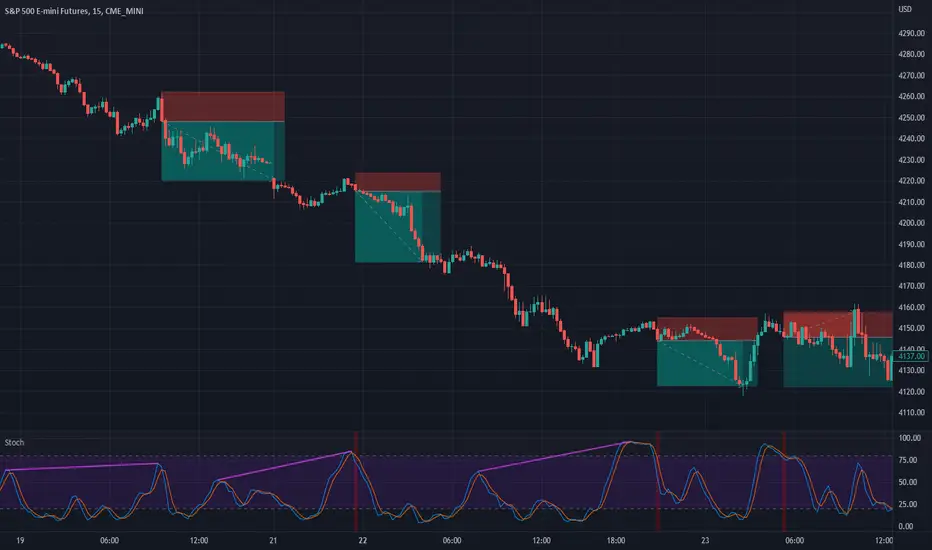
Stochastic with DivergencesReuploading as there was an issue with the description.
This indicator uses the popular Stochastic indicator as its base. I have included the ability to draw divergences on the indicator as they occur live. By default it will be off, select the settings for the indicator and about halfway down there will be a dropdown menu that says "Off". Select it and then select which divergences you want to draw: Regular, Hidden, or Both. I like to draw both. I find that hidden divergence is really nice during a trending market and the regular divergence is works great in a range market. I also feel that the regular divergence is great during a trending market if you are given the signal but then wait for the next price movement for a double top/bottom to occur. The Stochastic indicator itself is often used in a ranging market by selling when it is overbought and buying once it indicates oversold (much like the RSI indicator). I find that it can work in trending markets if you only take overbought in a down trend and oversold in an up trend. In the above picture you can see that I had used it to trade this downtrend using both the Hidden Divergence and Sell Signals to catch the trend continuation until it failed on the fourth trade. From here I would usually start using the Stochastic as simply an oscillating indicator and buy/sell based on overbought/oversold. I've also added an option to enable the Stochastic RSI if you'd rather use that, as well as a fill option which simply colors in the space between the Stochastic and Signal lines. The Signals option will put on highlights of when to buy or sell based on overbought/oversold areas that agree with the long term trend (based on the 200 EMA).
Divergence is a short way of saying there was a higher or lower movement compared to normal but the price did not represent that movement, indicating strength or weakness in a specific direction.
Regular divergence is an indication of a trend reversal. Regular bullish divergence occurs when the price chart shows a lower low while the stochastic shows a higher low. Regular bearish divergence occurs when the price chart shows a higher high while the stochastic shows a lower high.
Hidden divergence is an indication of a trend continuation. Hidden bullish divergence occurs when the price chart shows a higher low while the stochastic shows a lower low. Hidden bearish divergence occurs when the price chart shows a lower high while the stochastic shows a higher high.
The "Only Trending Divergences" option, if enabled, will only show bearish divergences during a down trend (price is below 200 EMA) and only show bullish divergences during an uptrend (price is above 200 EMA). I like to use this option and have set it to ON by default.
The "Middle Filter" option, if enabled, ensures that Highs on the stochastic indicator will not be counted as Highs unless they are above the middle value of the oscillator (which is 50), same goes for lows: they will not be counted as Lows unless they are below the middle value of the oscillator.
I also include buy/sell signals that coincide with the trend (based on the 200 EMA). If price is currently below the 200 EMA and the stochastic indicator is overbought (over 80), you can get a sell signal when it the blue line crosses down below 80. This sell signal shows that you are in a down trend and the price just was overbought but is now likely to continue pushing downwards. The opposite works for buy signals: Above 200 EMA, stochastic goes below 20, when it crosses above 20 it will show a green highlight to indicate price is likely to push upwards.
I think the default options are likely the best to use. The only one I tend to change on occasion is the "Pivots to look back" which I adjust usually to either 1 or 3.
RSI+ by Wilson (alt)Extension of the excellent RSI+ script by Wilsonlibero. I tweaked the parameters to better fit crypto markets, and I added a few more visuals, such as midline, overbought/oversold threshold lines and areas, background coloration depending on RSI trend above or below midline, and a few other tweaks especially colors (fixed the transp parameter deprecation for example). The color theme is by default more optimized for dark mode charts, but all colors can be configured, and all drawings can be enabled/disabled/tweaked in the parameters.
I'm just giving back to the community since I could modify this script only because it was open-source. If you like this script, please don't give me any credit, but please show some love to the original author Wilsonlibero:

RSI mid partition color changeWhen RSI is above 50 our default bias is on buy side and when below 50 our bias is on sell side.
Therefore created 2 zones for easy identification.
RSI TrendRSI Hull Trend is a hybrid indicator with RSI of HULL Signal. The Hull MA is combined with RSI to see if the Hull MA Buy/Sell Signal is in overbought or oversold condition. Buy Sell Signals are plotted based on settings of OB/OS or RSI. This indicator is very useful to see if the Trend is in Exhaustion or Beginning of a Trend. Entry and Exit conditions can be more precise based on OB/OS condition of price action. In addition normal RSI trend is plotted with trend color from Hull MA. Best Performance with Heiken Ashi Candles.
OB/OS Settings provided
Hull Buy/Sell Signals plotted
Double RSI FAST and DEFAULT signal with crossover
Bar Color applied based on Hull RSI Trend
Hull Trend + RSI + Price Action

Triple RSI strategyThis strategy is commonly used both in forex and stock markets for reversal trading. when the rsi line reaches and crosses simultaneously at 3 rsi setups i.e at 7, 14, and 21, a signal is generated.
This strategy works best in 1-hour timeframe. It provides over 60 to 80 percent accuracy in 1-hour timeframe.
In the stock market, this strategy provides an excellent entry point, if one is seeking small profits.
One can expect to make around 10 to 50 pips in the forex market easily. However, I advise seeking support from price action from the lower timeframe in the forex market.
I hope you like it.
Follow for more strategies and scripts like this.

Multi Type RSI [Misu]█ This Indicator is based on RSI ( Relative Strength Index ) & multiple type of MA (Moving Average) to show different variations of RSI.
The relative strength index (RSI) is a momentum indicator used in technical analysis to evaluate overvalued or undervalued conditions in the price of that security.
█ Usages:
The purpose of this indicator is to obtain the RSI calculated with different MAs modes instead of the classic RMA.
The red and green zones indicate the oversold and overbought zones.
Buy or sell signals are marked by the green and red circles
We have 2 different signal modes : when the different size RSIs cross and when the fast RSI crosses the extreme bands.
Alerts are setup.
█ Parameters:
Lenght RSI: The lenght of the RSI. (14 by default)
RSI MA Type: The type of MA with which the rsi will be calculated. ("SMA", "EMA", "SMMA (RMA)", "WMA", "VWMA")
Fast Lenght MA: The fast lenght smoothing MA.
Slow Lenght MA: The Slow lenght smoothing MA.
Lower Band: The lenght of the lower band. (25 by default)
Upper Band: The lenght of the upper band. (75 by default)
Signal Type: The mode with which buy and sell signals are triggered. ("Cross 2 Mas", "Cross Ma/Bands")

Ultimate Custom MTF ScreenerThis indicator will allow you to make your custom TradingView MTF screener without coding. Add it to the chart, select up to 10 instruments, 4 timeframes, and 4 indicators, and the screener will do the rest for you. The indicator will form a lovely table with all values and highlighted signals.
The screener is highly customizable, and you can choose its position on the chart, sorting, order of the columns, and colors for the tables. You can easily change parameters for all supported indicators and their signals.
Currently, there are 21 different custom indicators available. Current list of indicators:
Average Directional Index (ADX) - displaying the value of ADX and checking if it's higher than the threshold
Average True Range (ATR) - showing the value of ATR
Awesome Oscillator (AO) - displaying the value of AO and highlighting positive/negative values.
Bollinger Bands (BB) - showing if the price is above/below/in the channel.
Breakout Pivots - Displaying when the price is below/above the most recent pivot low/high.
Commodity Channel Index (CCI) - shows the last CCI value and highlights overbought/oversold values.
Directional Movement Index (DMI) - Up/Down signal (+DI above or below -DI)
Donchian Channel (DC) - showing if the price is above/below/in the channel.
Heikin Ashi Count (HAC) - What is the current Heikin Ashi candle color and for how long was this color?
Historical Volatility (HV) - Current value of Historical Volatility
Keltner Channel (KC) -showing if the price is above/below/in the channel.
Moving Average Convergence Divergence (MACD) - Up/Down signal (MACD above / below signal)
Moving Average Crossover (MA Cross) - Displaying MA crosses signals (SMA, EMA, WMA, HMA, VWMA, SMMA, DEMA, VWAP supported)
Moving Average Distance (MA DIST) - Displaying distance to the MA (SMA, EMA, WMA, HMA, VWMA, SMMA, DEMA, VWAP supported)
Parabolic Stop and Reverse (PSAR) - Up or Down
Relative Strength Index (RSI) - Displaying the last RSI value and highlighting overbought/oversold values.
Stochastic (STOCH) - Displaying the last Stochastic value and highlighting overbought/oversold values.
Stochastic RSI (STOCH RSI) - Displaying the last Stochastic RSI value and highlighting overbought/oversold values.
SuperTrend - Current state of the SuperTrend.
Trailing Stop-Loss (TSL) - Up or Down
True Strength Index (TSI) - Displaying the last TSI value and highlighting overbought/oversold values.
We're already working on adding a few more supported indicators. If you have any ideas about the indicators you want to see in our screener, contact us, and we'll consider them.
Disclaimer
Please remember that past performance may not be indicative of future results.
Due to various factors, including changing market conditions, the strategy may no longer perform as well as in historical backtesting.
This post and the script don’t provide any financial advice.

MACD + RSI with Trade SignalsThis indicator by default comes with the MACD shown but can be switched to show the RSI instead. Settings for each indicator can also be customized as well as Buy/Sell signals given based on pull back crossovers that follow the 200 EMA of the price Chart. There's an above/below middle fill option you can use but I tend not to but I know some traders like to see when an oscillator is above/below the middle and use it as a trend diretion. By the way, the fourth setting for the MACD (which is 2 by default) is the size of the histogram.
Buy Signal = Price is above the 200 EMA. Current or previous MACD or RSI line is/was below middle line and now crossed above the signal line.
Sell Signal = Price is below the 200 EMA. Current or previous MACD or RSI line is/was above middle line and now crossed below the signal line.
There are alerts for each signal as well (MACD and RSI, both buy and sell).
Feel free to leave a comment regarding issues or suggestions for this indicator or ideas for the next one I should do :)

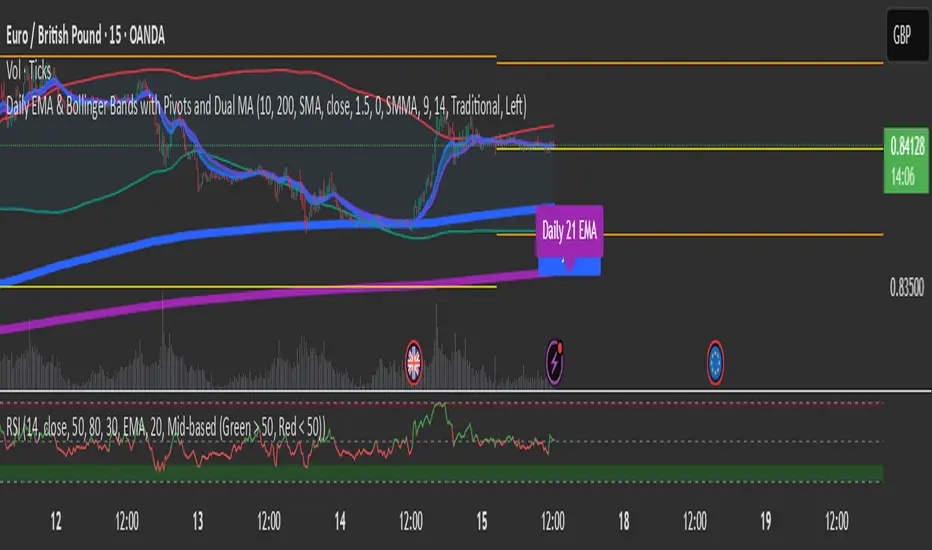
Bonds RSIA visually appealing RSI indicator with "at a glance" visual cues to quickly and easily identify who is in control of the chart.
This indicator provides clear "Bull" and "Bear" control zones, as well as a built-in EMA that is color changing based on the trend direction.
All functions, specific data points and color themes are 100% customizable to allow the user the ability to tweak all aspects of this tool to their own liking.
As time allows I will be adding additional features & functions.
Please like & share this indicator if you find it useful.
VXD SupercycleVXD is a brand new indicator and still developing. to minimize stop losses and overcome sideways market conditions, Higher Timeframe are recommended
Trend lines
-using Rolling VWAP as trend line to determined if Volume related to a certain price.
-you can switch RVWAP to EMA in the setting
ATR
-trailing 12*ATR and 2.4 Mutiplier
Pivot point and Rejected Block
Pivot show last High and low of a price in past bars
Rejected Block show when that High or Low price are important level to determined if it's Hidden Divergence or Divergence
Symbols on chart show Premium and Discount Prices
X-Cross - show potential reversal trend with weak volume .
O-circle - show potential reversal trend with strong volume .
Setting
Momentum: RSI = 25 , RSI MA = 14
Trend: Rolling VWAP and ATR and Subhag
Trailing STOP: ATR 12 x 2.4
Highlight Bars color when volume is above SMA 6
SMA200 act as TP Line
Risk:Reward Calculation
if Buy your Stoploss will be previous Pivot low
if Sell your Stoploss will be previous Pivot high and will be calculated form there, then show TP in Orange color line
VXD เป็นระบบเทรดที่ผมทดลองเอาหลาย ๆ ไอเดีย ทั้งจาก Youtube facebook และกลุ่มคนต่าง ๆ มารวบรวมไว้ แล้วตกผลึกขึ้นมาเป็นระบบนี้ ใน Timeframe ใหญ่ ๆ สามารถลากได้ทั้ง Cycle กันเลย
Trend lines
-ใช้ Rolling VWAP ของแอพ Tradingview (สามารถตั้งแค่าเป็น EMA ได้)
ATR
-ใช้ค่า ATR 12 Mutiplier 2.4
Pivot point and Rejected Block
Pivot โชว์เส้น High low และมีผลกับออเดอร์ หากแท่งเทียนปิดทะลุเส้นนี้
Rejected Block วาดแนวรับ-ต้าน อัตโนมัติ ใช้ประกอบ RSI ว่ามี Divergence หรือไม่
สัญลักษณ์ต่าง ๆ
X-Cross - แท่งกลืนกิน วอลุ่มน้อย
O-circle - แท่งกลืนกิน มีวอลุ่ม
Setting
Momentum: RSI = 25 , RSI MA = 14
Trend: Rolling VWAP and ATR and Subhag
Trailing STOP: ATR 12 x 2.4
Highlight Bars color when volume is above SMA 6
SMA200 act as TP Line
Risk:Reward Calculation
หาก Buy จุด SL จะอยู่ที่ Pivot low
หาก Sell จุด SL จะอยู่ที่ Pivot high และระบบจะคำนวณจากตรงนั้น จากนั้นแสดงเป็นเส้น TP สีส้ม
This Strategy Combined the following indicators and conditioning by me
ATR , RSI , EMA , SMA
Rolling VWAP - /script/ZU2UUu9T-Rolling-VWAP/
Regression Lines - Subhag form Subhag Ghosh /script/LHHBVpQu-Subhag-Ghosh-Algo-Version-for-banknifty/
Rejection Block , Pivots , High Volume Bars and PPDD form Super OrderBlock / FVG / BoS Tools by makuchaku & eFe /script/aZACDmTC-Super-OrderBlock-FVG-BoS-Tools-by-makuchaku-eFe/
ขอให้รวยครับ.
