Leavitt Convolution ProbabilityTechnical Analysis of Markets with Leavitt Market Projections and Associated Convolution Probability
The aim of this study is to present an innovative approach to market analysis based on the research "Leavitt Market Projections." This technical tool combines one indicator and a probability function to enhance the accuracy and speed of market forecasts.
Key Features
Advanced Indicators : the script includes the Convolution line and a probability oscillator, designed to anticipate market changes. These indicators provide timely signals and offer a clear view of price dynamics.
Convolution Probability Function : The Convolution Probability (CP) is a key element of the script. A significant increase in this probability often precedes a market decline, while a decrease in probability can signal a bullish move. The Convolution Probability Function:
At each bar, i, the linear regression routine finds the two parameters for the straight line: y=mix+bi.
Standard deviations can be calculated from the sequence of slopes, {mi}, and intercepts, {bi}.
Each standard deviation has a corresponding probability.
Their adjusted product is the Convolution Probability, CP. The construction of the Convolution Probability is straightforward. The adjusted product is the probability of one times 1− the probability of the other.
Customizable Settings : Users can define oversold and overbought levels, as well as set an offset for the linear regression calculation. These options allow for tailoring the script to individual trading strategies and market conditions.
Statistical Analysis : Each analyzed bar generates regression parameters that allow for the calculation of standard deviations and associated probabilities, providing an in-depth view of market dynamics.
The results from applying this technical tool show increased accuracy and speed in market forecasts. The combination of Convolution indicator and the probability function enables the identification of turning points and the anticipation of market changes.
Additional information:
Leavitt, in his study, considers the SPY chart.
When the Convolution Probability (CP) is high, it indicates that the probability P1 (related to the slope) is high, and conversely, when CP is low, P1 is low and P2 is high.
For the calculation of probability, an approximate formula of the Cumulative Distribution Function (CDF) has been used, which is given by: CDF(x)=21(1+erf(σ2x−μ)) where μ is the mean and σ is the standard deviation.
For the calculation of probability, the formula used in this script is: 0.5 * (1 + (math.sign(zSlope) * math.sqrt(1 - math.exp(-0.5 * zSlope * zSlope))))
Conclusions
This study presents the approach to market analysis based on the research "Leavitt Market Projections." The script combines Convolution indicator and a Probability function to provide more precise trading signals. The results demonstrate greater accuracy and speed in market forecasts, making this technical tool a valuable asset for market participants.
Regressionanalysis

Logarithmic Regression Channel-Trend [BigBeluga]
This indicator utilizes logarithmic regression to track price trends and identify overbought and oversold conditions within a trend. It provides traders with a dynamic channel based on logarithmic regression, offering insights into trend strength and potential reversal zones.
🔵Key Features:
Logarithmic Regression Trend Tracking: Uses log regression to model price trends and determine trend direction dynamically.
f_log_regression(src, length) =>
float sumX = 0.0
float sumY = 0.0
float sumXSqr = 0.0
float sumXY = 0.0
for i = 0 to length - 1
val = math.log(src )
per = i + 1.0
sumX += per
sumY += val
sumXSqr += per * per
sumXY += val * per
slope = (length * sumXY - sumX * sumY) / (length * sumXSqr - sumX * sumX)
average = sumY / length
intercept = average - slope * sumX / length + slope
Regression-Based Channel: Plots a log regression channel around the price to highlight overbought and oversold conditions.
Adaptive Trend Colors: The color of the regression trend adjusts dynamically based on price movement.
Trend Shift Signals: Marks trend reversals when the log regression line cross the log regression line 3 bars back.
Dashboard for Key Insights: Displays:
- The regression slope (multiplied by 100 for better scale).
- The direction of the regression channel.
- The trend status of the logarithmic regression band.
🔵Usage:
Trend Identification: Observe the regression slope and channel direction to determine bullish or bearish trends.
Overbought/Oversold Conditions: Use the channel boundaries to spot potential reversal zones when price deviates significantly.
Breakout & Continuation Signals: Price breaking outside the channel may indicate strong trend continuation or exhaustion.
Confirmation with Other Indicators: Combine with volume or momentum indicators to strengthen trend confirmation.
Customizable Display: Users can modify the lookback period, channel width, midline visibility, and color preferences.
Logarithmic Regression Channel-Trend is an essential tool for traders who want a dynamic, regression-based approach to market trends while monitoring potential price extremes.

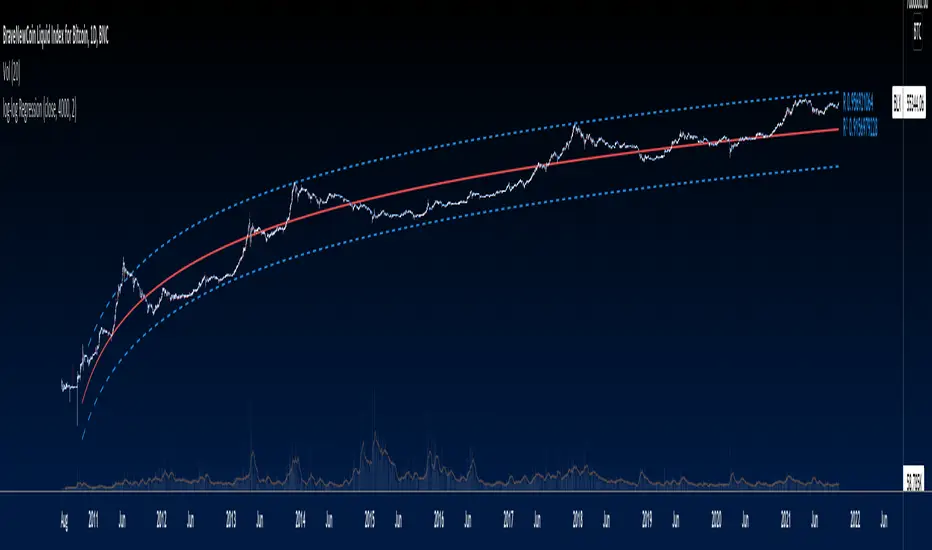
Bitcoin wave modelBitcoin wave model is based on the logarithmic regression model and the sinusoidal waves, induced by the halving events.
This chart presents the outcome of an in-depth analysis of the complete set of Bitcoin price data available from October 2009 to August 2023.
The central concept is that the logarithm of the Bitcoin price closely adheres to the logarithmic regression model. If we plot the logarithm of the price against the logarithm of time, it forms a nearly straight line.
The parameters of this model are provided in the script as follows: log (BTCUSD) = 1.48 + 5.44log(h).
The secondary concept involves employing the inherent time unit of Bitcoin instead of days:
'h' denotes a slightly adjusted time measurement intrinsic to the Bitcoin blockchain. It can be approximated as (days since the genesis block) * 0.0007. Precisely, 'h' is defined as follows: h = 0 at the genesis block, h = 1 at the first halving block, and so forth. In general, h = block height / 210,000.
Adjustments are made to account for variations in block creation time.
The third concept revolves around investigating halving waves triggered by supply shock events resulting from the halvings. These halvings occur at regular intervals in Bitcoin's native time 'h'. All halvings transpire when 'h' is an integer. These events induce waves with intervals denoted as h = 1.
Consequently, we can model these waves using a sin(2pih - a) function. The parameter determining the time shift is assessed as 'a = 0.4', aligning with earlier expectations for halving events and their subsequent outcomes.
The fourth concept introduces the notion that the waves gradually diminish in amplitude over the progression of "time h," diminishing at a rate of 0.7^h.
Lastly, we can create bands around the modeled sinusoidal waves. The upper band is derived by multiplying the sine wave by a factor of 3.1*(1-0.16)^h, while the lower band is obtained by dividing the sine wave by the same factor, 3.1*(1-0.16)^h.
The current bandwidth is 2.5x. That means that the upper band is 2.5 times the lower band. These bands are forming an exceptionally narrow predictive channel for Bitcoin. Consequently, a highly accurate estimation of the peak of the next cycle can be derived.
The prediction indicates that the zenith past the fourth halving, expected around the summer of 2025, could result in prices ranging between 200,000 and 240,000 USD.
Enjoy the mathematical insights!

Nadaraya-Watson: Envelope (Non-Repainting)Due to popular request, this is an envelope implementation of my non-repainting Nadaraya-Watson indicator using the Rational Quadratic Kernel. For more information on this implementation, please refer to the original indicator located here:
What is an Envelope?
In technical analysis, an "envelope" typically refers to a pair of upper and lower bounds that surrounds price action to help characterize extreme overbought and oversold conditions. Envelopes are often derived from a simple moving average (SMA) and are placed at a predefined distance above and below the SMA from which they were generated. However, envelopes do not necessarily need to be derived from a moving average; they can be derived from any estimator, including a kernel estimator such as Nadaraya-Watson.
How to use this indicator?
Overall, this indicator offers a high degree of flexibility, and the location of the envelope's bands can be adjusted by (1) tweaking the parameters for the Rational Quadratic Kernel and (2) adjusting the lookback window for the custom ATR calculation. In a trending market, it is often helpful to use the Nadaraya-Watson estimate line as a floating SR and/or reversal zone. In a ranging market, it is often more convenient to use the two Upper Bands and two Lower Bands as reversal zones.
How are the Upper and Lower bounds calculated?
In this indicator, the Rational Quadratic (RQ) Kernel estimates the price value at each bar in a user-defined lookback window. From this estimation, the upper and lower bounds of the envelope are calculated based on a custom ATR calculated from the kernel estimations for the high, low, and close series, respectively. These calculations are then scaled against a user-defined multiplier, which can be used to further customize the Upper and Lower bounds for a given chart.
How to use Kernel Estimations like this for other indicators?
Kernel Functions are highly underrated, and when calibrated correctly, they have the potential to provide more value than any mundane moving average. For those interested in using non-repainting Kernel Estimations for technical analysis, I have written a Kernel Functions library that makes it easy to access various well-known kernel functions quickly. The Rational Quadratic Kernel is used in this implementation, but one can conveniently swap out other kernels from the library by modifying only a single line of code. For more details and usage examples, please refer to the Kernel Functions library located here:

log-log Regression From ArraysCalculates a log-log regression from arrays. Due to line limits, for sets greater than the limit, only every nth value is plotted in order to cover the entire set.
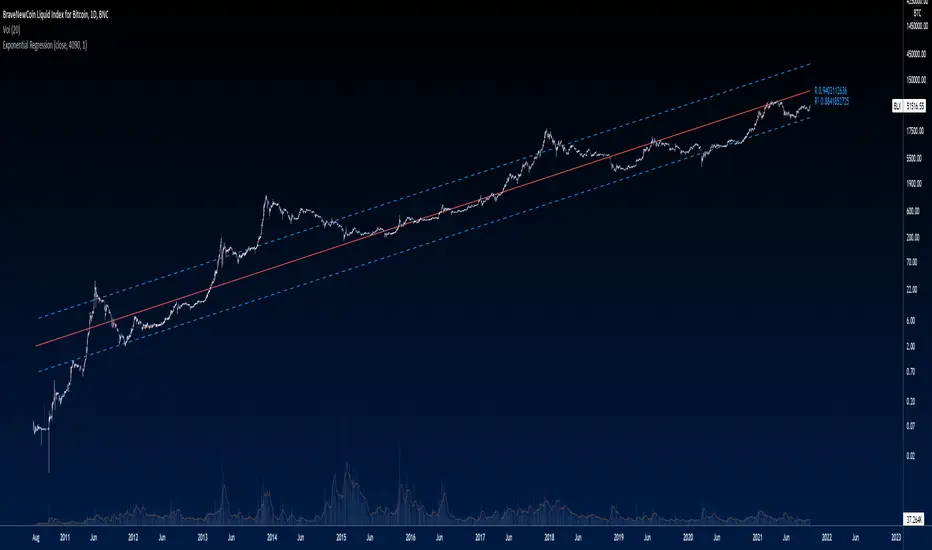
Exponential Regression From ArraysCalculates an exponential regression from arrays. Due to line limits, for sets greater than the limit, only every nth value is plotted in order to cover the entire set.
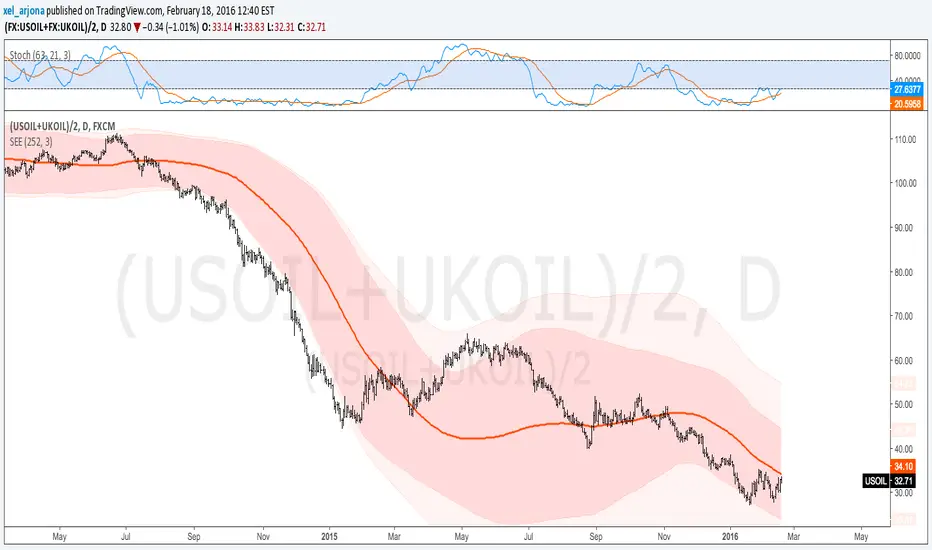
Standard Error of the Estimate -Jon Andersen- V2Original implementation idea of bands by:
Traders issue: Stocks & Commodities V. 14:9 (375-379):
Standard Error Bands by Jon Andersen
Standard Error Bands are quite different than Bollinger's.
First, they are bands constructed around a linear regression curve.
Second, the bands are based on two standard errors above and below this regression line.
The error bands measure the standard error of the estimate around the linear regression line.
Therefore, as a price series follows the course of the regression line the bands will narrow , showing little error in the estimate. As the market gets noisy and random, the error will be greater resulting in wider bands .
Thanks to the work of @glaz & @XeL_arjona
In this version you can change the type of moving averages and the source of the bands.
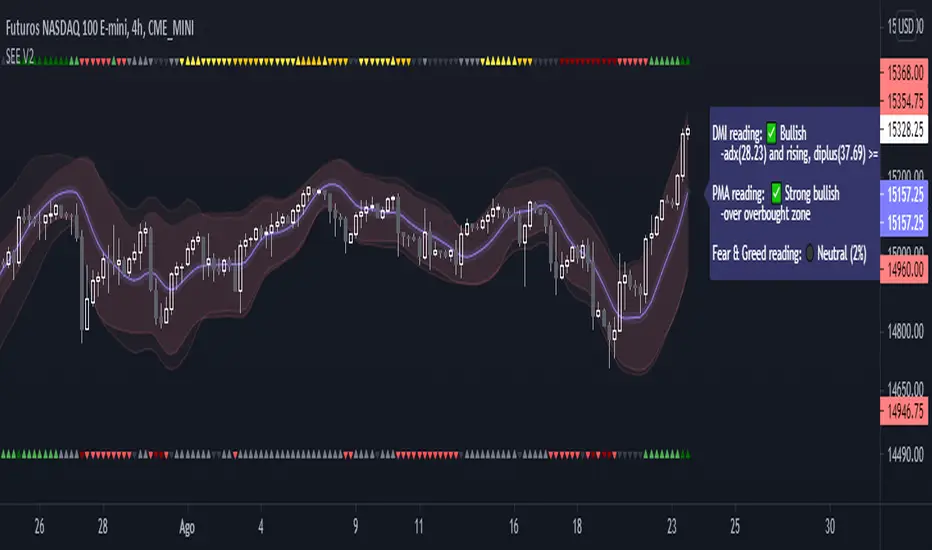
Add a few studies of @dgtrd
1- ADX Colored Directional Movement Line
Directional Movement (DMI) (created by J. Welles Wilder ) consists of the Average Directional Index ( ADX ), to define whether or not there is a trend present, and Plus Directional Indicator (+D I) and Minus Directional Indicator (-D I) serve the purpose of determining trend direction
ADX Colored Directional Movement Line is custom interpretation of Directional Movement (DMI) with aim to present all 3 DMI indicator components with SINGLE line and ability to be added on top of the price chart (main chart)
How to interpret :
* triangle shapes:
▲- bullish : diplus >= diminus
▼- bearish : diplus < diminus
* colors:
green - bullish trend : adx >= strongTrend and di+ > di-
red - bearish trend : adx >= strongTrend and di+ < di-
gray - no trend : weekTrend < adx < strongTrend
yellow - week trend : adx < weekTrend
* color density:
darker : adx growing
lighter : adx falling
2- Volatility Colored Price/MA Line
Custom interpretation of the idea “Prices high above the moving average (MA) or low below it are likely to be remedied in the future by a reverse price movement”. Further details can be found under study “Price Distance to its MA by DGT”
How to interpret :
-▲ – Bullish , Price Action above Moving Average
-▼ – Bearish , Price Action below Moving Average
-Gray/Black - Low Volatility
-Green/Red – Price Action in Threshold Bands
-Dark Green/Red – Price Action Exceeds Threshold Bands
3- Volume Weighted Bar s
Volume Weighted Bars, a study of Kıvanç Özbilgiç, aims to present whether volume supports price movements. Volume Weighted Bars are calculated based on volume moving average.
How to interpret :
-Volume high above the volume moving average be displayed with red/green colors
-Average volume values will remain as they are and
-Volume low below the volume moving average will be indicated with darker colors
4- Fear & Greed index value, using technical anlysis approach calculated based on :
⮩1 - Price Momentum : Price Distance to its Moving Average
⮩2 - Strenght : Rate of Return, price movement over a period of time
⮩3 - Money Flow : Chaikin Money Flow, quantify changes in buying and selling pressure. CMF calculations is based on Accumulation/Distribution
⮩4 - Market Volatility : CBOE Volatility Index ( VIX ), the Volatility Index, or VIX , is a real-time market index that represents the market's expectation. It provides a measure of market risk and investors' sentiments
⮩5 -Safe Haven Demand: in this study GOLD demand is assumed
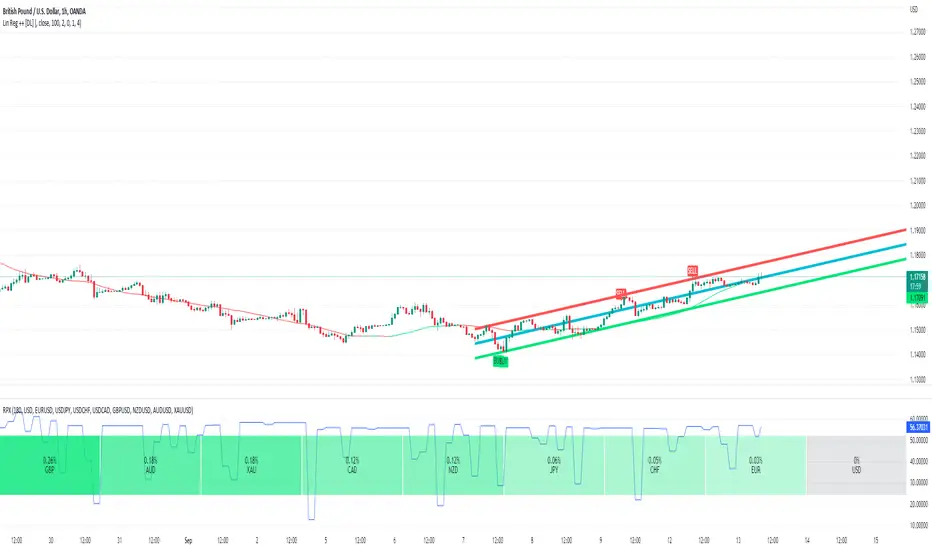
KINSKI Volume Regression TrendRegression trends are typically used to determine when a price is unusually far from its baseline. The script calculates the linear regression of volume and price to determine the trend direction and strength. This can be used to determine the volume support for upward/downward trends.
As a special feature, this indicator allows you to choose from three (as of 07/20/2021) templates with special presets.
The following templates are available:
"Precise" (Period: 4, Smoothing Factor Type: "DISABLED", Smoothing Factor Length = 1).
"Smooth" (Period: 4, Smoothing Factor Type: "RMA", Smoothing Factor Length = 2)
"Long Term (Period: 20, Smoothing Factor Type: "DISABLED", Smoothing Factor Length = 1)
In the selection for templates, the option "DISABLED" can also be selected. Then the user-defined settings selectable under it take effect. There are the following setting options.
"Length": Adjustable period
"Smoothing Factor: Type": Type of moving average
"Smoothing Factor: Length": Adjustable period
Other setting options are:
Color codes: The color codes are explained in the settings
Display types: "Columns", "Histogram", "Area", "Line", "Stepline"

Linear Regression (All Data)The tool plots a linear regression line using the entire history of an instrument on chart. There are may be issues on intraday timeframes less then 1h. On daily, weekly and monthly charts it works without problem.
If an instrument has a lot of data points, you may not see the line (this is TV feature):
To fix that you need to scroll your chart to the left and find the starting point of the line:
And then do an auto-scroll to the last bar:

Linear Regression ++Due to public demand
Linear Regression Formula
Scraped Calculation With Alerts
Here is the Linear Regression Script For traders Who love rich features
Features
++ Multi time frame -> Source Regression from a different Chart
++ Customized Colors -> This includes the pine lines
++ Smoothing -> Allow Filtered Regression; Note: Using 1 Defaults to the original line. The default is 1
++ Alerts On Channel/Range Crossing
Usage
++ Use this for BreakOuts and Reversals
++ This Script is not to be used Independently
Risks
Please note, this script is the likes of Bollinger bands and poses a risk of falling in a trend range.
Signals may Keep running on the same direction while the market is reversing.
Requests
If you have any feature requests, comment below or dm me. I will answer when i can.
Feel free to utilize this on your chart and share your ideas
For developers who want to use this on their chart, Please use this script
The original formula for calculation is posted there
❤❤❤ I hope you love this. From my heart! ❤❤❤
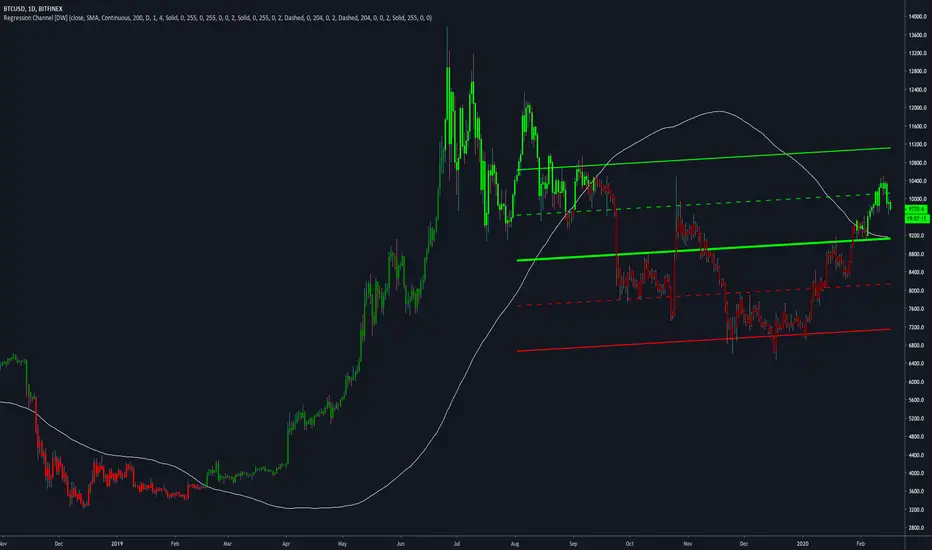
Regression Channel [DW]This is an experimental study which calculates a linear regression channel over a specified period or interval using custom moving average types for its calculations.
Linear regression is a linear approach to modeling the relationship between a dependent variable and one or more independent variables.
In linear regression, the relationships are modeled using linear predictor functions whose unknown model parameters are estimated from the data.
The regression channel in this study is modeled using the least squares approach with four base average types to choose from:
-> Arnaud Legoux Moving Average (ALMA)
-> Exponential Moving Average (EMA)
-> Simple Moving Average (SMA)
-> Volume Weighted Moving Average (VWMA)
When using VWMA, if no volume is present, the calculation will automatically switch to tick volume, making it compatible with any cryptocurrency, stock, currency pair, or index you want to analyze.
There are two window types for calculation in this script as well:
-> Continuous, which generates a regression model over a fixed number of bars continuously.
-> Interval, which generates a regression model that only moves its starting point when a new interval starts. The number of bars for calculation cumulatively increases until the end of the interval.
The channel is generated by calculating standard deviation multiplied by the channel width coefficient, adding it to and subtracting it from the regression line, then dividing it into quartiles.
To observe the path of the regression, I've included a tracer line, which follows the current point of the regression line. This is also referred to as a Least Squares Moving Average (LSMA).
For added predictive capability, there is an option to extend the channel lines into the future.
A custom bar color scheme based on channel direction and price proximity to the current regression value is included.
I don't necessarily recommend using this tool as a standalone, but rather as a supplement to your analysis systems.
Regression analysis is far from an exact science. However, with the right combination of tools and strategies in place, it can greatly enhance your analysis and trading.
Dorsey InertiaThis indicator was originally developed by Donald Dorsey (Stocks & Commodities, V.13:9 (September, 1995): "Refining the Relative Volatility Index").
Inertia is based on Relative Volatility Index (RVI) smoothed using linear regression.
In physics, inertia is the tendency of an object to resist to acceleration. Dorsey chose this name because he believes that trend and inertia are related and that it takes more effort and energy to reverse the direction of a stock or market than to keep it in the same direction. He argues that the volatility is the simplest and most accurate measure of inertia.
When the indicator is below 50, it signals bearish market sentiment and when the indicator is above 50 it signals a bullish trend.
Good luck!

Kirshenbaum BandsThis indicator was originally developed by Paul Kirshenbaum, a mathematician with a Ph.D. in economics from New York University.
It uses the standard error of linear regression lines of the closing price to determine band width. This has the effect of measuring volatility around the current trend, rather than measuring volatility for changes in trend.
Good luck!

Quadratic Regression Slope [DW]This is a study geared toward identifying price trends using Quadratic regression.
Quadratic regression is the process of finding the equation of a parabola that best fits the set of data being analyzed.
In this study, first a quadratic regression curve is calculated, then the slope of the curve is calculated and plotted.
Custom bar colors are included. The color scheme is based on whether the slope is positive or negative, and whether it is increasing or decreasing.

Quadratic RegressionA quadratic regression is the process of finding the equation that best fits a set of data.This form of regression is mainly used for smoothing data shaped like a parabola.
Because we can use short/midterm/longterm periods we can say that we use a Quadratic Least Squares Moving Average or a Moving Quadratic Regression.
Like the Linear Regression (LSMA) a Quadratic regression attempt to minimize the sum of squares (sum of the squared difference between a set of data and an estimator), this is why
those kinds of filters have low lag .
Here the difference between a Least Squared Moving Average ( green ) and a Quadratic Regression ( red ) of both period 500
Here it look like the Quadratic Regression have a best fit than the LSMA

Price Regression AgreggatorPrice Estimator with aggregated linear regresion
---------------------------------------------------------------------------
How it works:
It uses 6 linear regression from time past to get an estimated point in future time, and using transparency, those areas that are move "visited" by those 6 different regressions and maybe more probable to be visited by the price (in fact if you zoom out you will see that price normally is around the lighter zones) have more aggregated painted colors, the transparency is lower and well, the lighter area should be more probable to be visited by the price should we put any faith on linear regression estimations and even more when many of them coincide in several points where the color is more aggregated.
If the "I" (the previous regressions increment) is too low, then we will have huge spikes as the only info gathered from the oldest linear regresssion will be within the very same trend we are now, resulting in "predictions" of huge spikes in the trend direction. (all regressions estimating on a line pointing to infinite)
If the "I" is high enough (not very or TV won't be able to display it) then you will get somewhat a "vectorial" resultant force of many linear regressions giving a more "real prediction" as it comes from tendencies from higher timeframes. E.g. 12 hours could be going down, 4h could be going sideways, 30m could be going up.
contact tradingview -> hecate . The idea and implementation is mine.
Note: transparency + 10 * tranparencygradient cannot be > 100 or nothing will be displayed
Note2: if the Future increment (how many lines are displayed to the right of the actual price ) are excessive, it will start to do weird things.
Note3: two times the standard deviation statistically correponds to a probability of 95%. We are calculating Top and Bot with that amount above and below. So anything inside those limits is more probable and if we are out of those limits it should fall back soon. Increase the number of times the std deviation as desired. There are calculators in the web to translate number of times std dev to their correspondent probability.
Note4: As we use backwards in time linear regressions for our "predictions" we lose responsiveness. Those old linear regressions are weighted with less value than more recent ones.
Note5: In the code i have included many color combinations (some horrible :-) )
Note6: This was an experiment while i was quite bored although ended enjoying playing with it.
Have fun! :-)
I leave it here because i am getting dizzy.

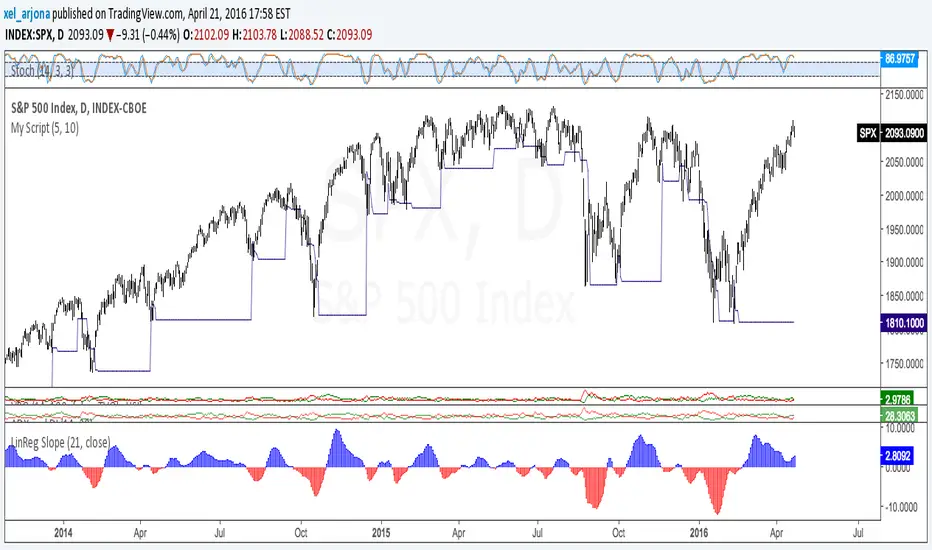
ORDINARY LEAST SQUARES Slope by @XeL_ArjonaORDINARY LEAST SQUARES Slope by @XeL_Arjona
Ver. 1 by Ricardo M Arjona @XeL_Arjona
DISCLAIMER:
The Following indicator/code IS NOT intended to be a formal investment advice or recommendation by the author, nor should be construed as such. Users will be fully responsible by their use regarding their own trading vehicles/assets.
The embedded code and ideas within this work are FREELY AND PUBLICLY available on the Web for NON LUCRATIVE ACTIVITIES and must remain as is.
WHAT'S THIS?
This is a REAL mathematically approach of an ORDINARY LEAST SQUARES LINE FITTING SLOPE as TradingView currently don't have a native one embedded, neither as a pine function. Other "Sope" indicators from this linear regression model I found on public library are currently based on "momentum" rather tan slope.
Any modifications or additions are quite welcome!
Cheers!
@XeL_Arjona
BUY & SELL PRESSURE by RegressionBUY & SELL PRESSURE by Regression Analysis at candle price/volume (Rate-Of-Change)
Ver. 3 By Ricardo M Arjona @XeL_Arjona
DISCLAIMER:
The Following indicator/code IS NOT intended to be a formal investment advice or recommendation by the author, nor should be construed as such. Users will be fully responsible by their use regarding their own trading vehicles/assets.
The embedded code and ideas within this work are FREELY AND PUBLICLY available on the Web for NON LUCRATIVE ACTIVITIES and must remain as is.
WHAT'S THIS?
This is my 3rd. revision of the original implementation for AmiBroker by Karthik Marar's of it's BUY AND SELL PRESSURE INDICATORS but this time, constructed under a complete REGRESSIVE ANALYSIS premise based in Rate Of Change (A kind of Slope but measured in % Performance).
Some minimal adaptation's (and cleaning) have been made:
Instead of simple Range calculation at price, Rate Of Change (Regressive) is used.
Oscillator of Pressure can be deactivated in favor of a simple RoC Cumulative Pressures at candle.
Oscillator can read Volume data from external tickers for accurate Index calculation. ( NYA can use TVOL as example.)
Code is small, cleaner and faster =) !
Cheers!
Any feedback will be welcome...
@XeL_Arjona

Standard Error of the Estimate -Composite Bands-Standard Error of the Estimate - Code and adaptation by @glaz & @XeL_arjona
Ver. 2.00.a
Original implementation idea of bands by:
Traders issue: Stocks & Commodities V. 14:9 (375-379):
Standard Error Bands by Jon Andersen
This code is a former update to previous "Standard Error Bands" that was wrongly applied given that previous version in reality use the Standard Error OF THE MEAN, not THE ESTIMATE as it should be used by Jon Andersen original idea and corrected in this version.
As always I am very Thankfully with the support at the Pine Script Editor chat room, with special mention to user @glaz in order to help me adequate the alpha-beta (y-y') algorithm, as well to give him full credit to implement the "wide" version of the former bands.
For a quick and publicly open explanation of this truly statistical (regression analysis) indicator, you can refer at Here!
Extract from the former URL:
Standard Error Bands are quite different than Bollinger's. First, they are bands constructed around a linear regression curve. Second, the bands are based on two standard errors above and below this regression line. The error bands measure the standard error of the estimate around the linear regression line. Therefore, as a price series follows the course of the regression line the bands will narrow, showing little error in the estimate. As the market gets noisy and random, the error will be greater resulting in wider bands.