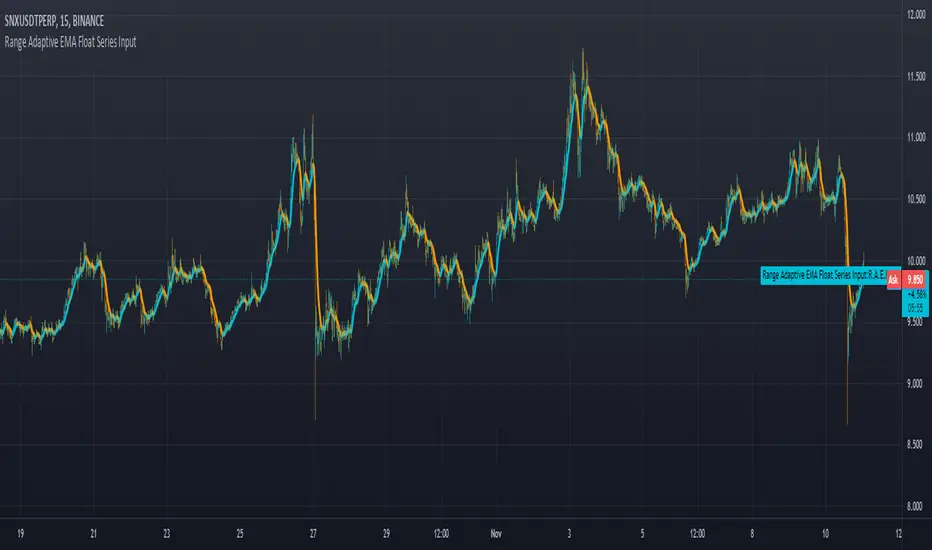
Range Adaptive EMA Float Series Inputuses range and change distance on arrays to allow for more control as well as any choice of input value as a controller for how tightly it grips the input signal.
Range
No Duplicates Interval Range & EQGenerates Range & EQ levels and removes duplicates. Prioritizes by higher timeframe for duplicates. For example, on Monday's open, weekly open is displayed while daily open is hidden automatically.

Asteroid Belt SpaceManBTCAsteroid Belt SpaceManBTC
Asteroid Belt is a trend analysis tool that provides 3 areas of importance, upper, lower, and main belt. The belts provide areas
of key interest that will likely cause a reaction on any asset that is being charted.
Within The Belt
There are 2 ways to play the belt, when trending in either direction, entering the belt can be seen as an area to buy a pullback, providing a strong entry in the trend. The Upper Belt will suffice in the strongest of trends, the middle of the belt indicates a trend that is still strong. A tap of the lowest belt is a weaker trend but often the bottom of any uptrend.
The other way to play the belt from within is play the range from one belt to the other usually the lower belt to the upper belt for a full range play is successful and the mid belt should be used to take partial profits/determine the strength of the move to the other side of the belt.
Responsiveness
3 Types of responsiveness, Fast, Slow and Normal. Slow being the default as its my preffered. The Slow belt will highlight entries with higher probability of causing reaction.
Normal is the best for reliable entries with less patience, it can be recommended for those who are faster to react to directional changes.
Fast belt should only really be used on the Higher timeframe trends as their pull backs can take significantly longer and therefore provides a reliable entry for a quicker than usual high time frame execution.
Dynamic Colors
This is a simple calculation which will be advanced in the future, it can be used to determine the strength of a trend in the belt, highlighting uptrend and downtrends when enabled. Can be disabled in settings.
Auto Aggregator is the primary difference by providing its own calculations very different to how previous auto calculations have worked in spacemanbtc indicators, this aggregator is a work in progress but should produce results that can be replicated accross all coins. Doing so allows for chart by chart switching and is useful for anyone who is in need of quick trend analysis. This can be disabled for manual fine tuning. On by default for new users to learn with.
To Do:
Add outer reversion belts for a full trading system.
Improve dynamic coloring logic.
Improve Auto Aggregator logic.

Fibonaci Opening Range Candle
Fibonacci Opening Range it is 50% and 0.61% of 5 min or 30min or 1 hour opening candle
search buying opportunities below 0.61
and selling opportunities above 0.50
Also acts as good support and resistance in intraday
BEST RESULTS IN INDEXES
Thanks & Best Regards
Marella Ganesh

Opening Range FibonaccisThis indicator uses the concept of the "Opening Range" to create a Fibonacci zone from the high and low set during a specific time period after open (Defaults to 9:30 - 10:05 AM, EST)
The Opening Range is a popular tool for intraday technical analysis. Price frequently uses these levels as support/resistance, and a breakout from within the range can be a sign of further movement.
The Fibonacci levels are set such that the opening range high/low fall on the +/-0.5 fib. This creates an "extended range" outside of the opening range that may be useful during breakouts.

Exhaustion ZonesOur Indicator “Exhaustion Zones” offers an insight into the expected Volatility of any given Instrument applied to. Understanding Volatility is essential for using this Indicator. If you are familiar with the concept, then you will most likely find this indicator useful in your trading. If you are unfamiliar with the concept and are interested in this topic, then continue reading a “Brief Concept of Volatility” at the end of the description, where we will provide some informational Links.
This description will provide a High Level description of how our Indicator identifies and visualizes Exhaustion Zones, followed by how to use the Indicator in your trading. At the end we would like to introduce our team and experience.
High Level Description of “Exhaustion Zones”:
Our indicator is predicting the expected market volatility for a predefined period based on recent historical Volatility, which will be referred to as “Period Volatility” from now on. Currently there are two Predefined Periods…
...a daily period, which starts from 21 UTC for the next 24 hours.
...a weekly period, which starts from Sunday 21 UTC for the next 7 days.
Our indicator calculates an expected volatility for the respective period and informes you, the trader, how large the price range could be. The indicator calculates “Exhaustion Zones” using the Period Volatility, which is a multiple (1x, 2x and 3x) of the Period Volatility, based on the Period High/Low. Basically, adding the multiple of the Period Volatility to the Period Low would equate to the “Upper Exhaustion Zones”, and subtracting the multiple of the Period Volatility from the Period High would equate to the “Lower Exhaustion Zones”.
Visualisation:
Our indicator needs to display 2 states …
…price range is SMALLER than predicted Period Volatility. An example would be, a daily period has just begun, and the Daily range is small, hence the Daily range is smaller than the predicted Period Volatility. This state will be referred to as “Moving Exhaustion Zones”
...price range is GREATER than predicted Period Volatility. An example would be, a market has experienced a shock leading to a huge price change and exceeding the Period Volatility. This state will be referred to as “Locked Exhaustion Zones”
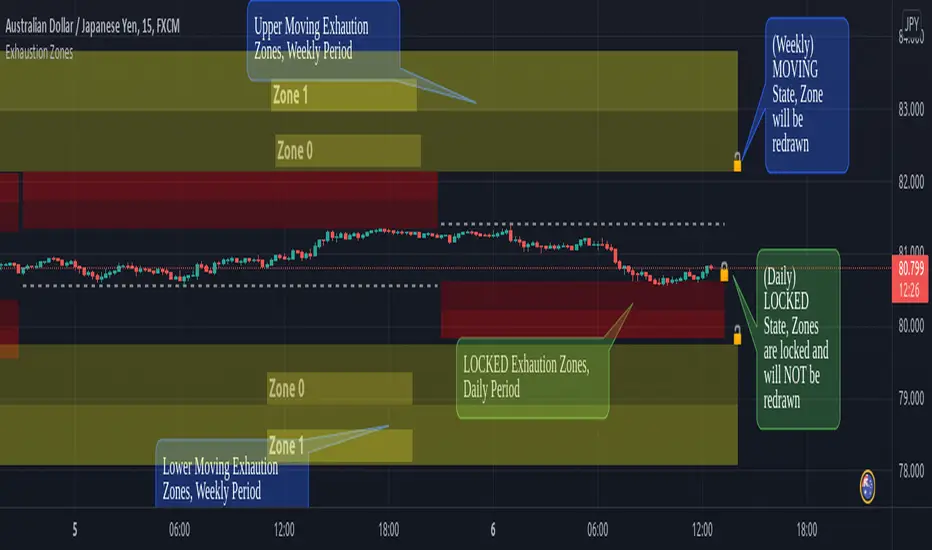
What do the Boxes mean:
Our Indicator displays 2 different Periods - Daily and Weekly. The Daily period is displayed with a red accent color, whereas a weekly Period has a yellow accent.
The Boxes themself display the “Exhaustion Zones”. Each period displays upto 4 Exhaustion Zones - 2 Upper Exhaustion Zones, 2 Lower Exhaustion Zones, each having a “Zone 0” and “Zone 1”.
Moving Exhaustion Zones
Moving Exhaustion Zones displays 4 Exhaustion Zones. These Zones are based on the Period High/Low and are NOT locked, and can still be redrawn. As prices make new Period Highes and Lows, exhaustion Zones will be adjusted. This state is visualized by the Open Lock on the right side of the current Exhaustion Zone.
Locked Exhaustion Zones
Locked Exhaustion Zones display 2 Exhaustion Zones and a dashed Line. Price has made its move and has exceeded predicted Period Volatility. Exhaustion Zones are locked and will NOT be repainted from now on. This state is visualized by the closed Lock on the right side of the current Exhaustion Zone.
How to use it:
The Exhaustion Zones indicator is a mean reverting Indicator. That being said, when Price approaches/enters a Zone, the assumption is that Price will either slow down, or reverse.
The Exhaustion Zone is displayed as 2 Sub-Zones: Zone 0 and Zone 1. As Price continues through the Zones without a reversal, the potential for a reversal increases.
We recommend using this Indicator with a reversal Trading Strategy familiar to you.
Furthermore, this Indicator is well suited as a Target. You can use the Exhaustion Zones to define your Target or where you would like to remove partial Profits.
Important
Please note, that the indicator itself just presents price areas where there is a potential for a price reversal, and that these Zones should not be traded blindly
Time frame:
This indicator is programmed to be used on all Timeframes lower than Weekly Timeframes.
Instruments:
This indicator aims to visualize areas of where Market price has the potential to reverse, hence making this a mean reverting Indicator.
Taking this statement to account, it is recommended to apply this Indicator to Instruments with a mean reverting character.
Examples of mean reverting markets could be for example …
...all FOREX instruments, as FOREX is considered a mean reverting Market.
...an instrument that is in a consolidation, or which you are expecting to enter a period of consolidation.
Indicator settings and configuration:
The Indicator has no functional parameters, to reduce User error, and only has visual parameters. The color of the Zones can be tailored to your liking.
Furthermore you have decided what you would like to display on your chart:
… Display Weekly Zones
...Display Daily Zones
...Show History
...Show Zone States.
Brief concept of Volatility:
Volatility is a concept that has been around for a very long time. Following links are helpful to get a grasp of the concept:
en.wikipedia.org(finance)
www.investopedia.com
Our Team:
We are a team of 3 Traders with a co mbined experience of 40 years. We are using our experiences from the market to create Indicators to Visualize the most relevant Patterns to us in our trading today. Our goal is to reconstruct these patterns to match our understanding of the market and to simplify the process of creating reproducible trading Strategies.
Classic Candlestick on Range ChartHello traders!
This is my first script to share with everyone! As of right now the range candles on Tradingview are lacking the option to see range charts using the classic candlesticks. This script allows you to overlay a regular candlestick or heikin-ashi candlestick on a range chart!! Unfortunately, the only bar that cannot be a candlestick is the current bar. Once that bar has completed its range then it will update to a regular candlestick.
Install / Use instructions!
-For the best visual appearance it is important to set the transparency of up bars and down bars to 0. This setting is found in the main chart settings under SYMBOL. However, if you want to see the current unfinished range bar you need to set the "projection up bars" and "projection down bars" to the color you prefer.
-To change the colors of the candlesticks is found under the indicator settings like any other script!

Flow of RangeThe Flow of Range is calculated by averaging the range for the given bars for the short term oscillations, then averaging the average to determine long term runs.
Above 0 indicates bullish momentum, below 0 indicates bearish momentum.
Notice the behavior of the market when the range is increasing and decreasing - both on the long and short term oscillations.
The indicator should be used in a discretionary manner along with your usual preferred tools.

Bar StatisticsThis script calculates and displays some bar statistics.
For the bar length statistics, it takes every length of upper or lower movements and calculates their average (with SD), median, and max. That way, you can see whether there is a bias in the market or not.
Eg.: If for 10 bars, the market moved 2 up, then 1 down, then 3 up, then 2 down, and 2 up, the average up bars length would be at 2.33, while the average for the down length would be at 1.5, showing that upper movements last longer than down movements.
For the range statistics, it takes the true range of each bar and calculates where the close of the bar is in relation to the true low of it. So if the closing of the bar is at 10.0, the low is at 9.0, and the high is at 10.2, the candle closed in the upper third of the bar. This process is calculated for every bar and for both closing prices and open prices. It is very useful to locate biasses, and they can you a better view of the market, since for most of the time a bar will open on an extreme and close on another extreme.
Eg.: Here on the DJI, we can see that for most of the time, a month opens at the lower third (near the low) and closes at the upper third (near the high). We can also see that it is very difficult for a month to open or close on the middle of the candle, showing how important the first and the last day are for determining the trend of the rest of the month.

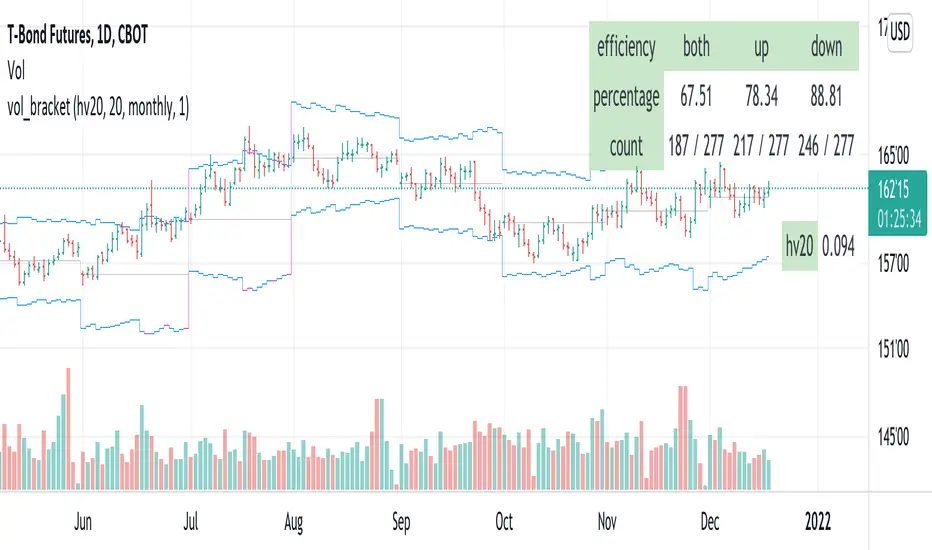
vol_bracketThis simple script shows an "N" standard deviation volatility bracket, anchored at the opening price of the current month, week, or quarter. This anchor is meant to coincide roughly with the expiration of options issued at the same interval. You can choose between a manually-entered IV or the hv30 volatility model.
Unlike my previous scripts, which all show the volatility bracket as a rolling figure, the anchor helps to visualize the volatility estimate in relation to price as it ranges over the (approximate) lifetime of a single, real contract.
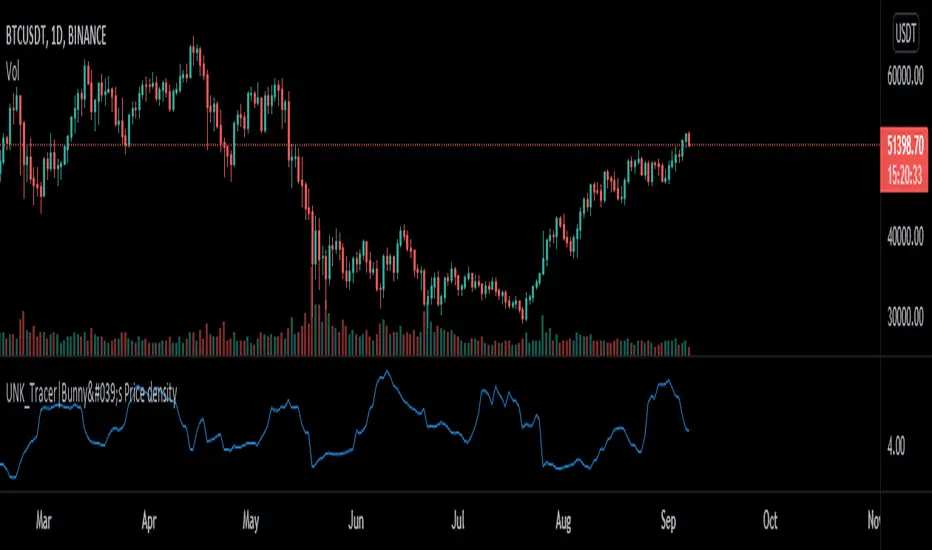
Price density [Measuring Market Noise:Take advantage]$$ Market noise can be problematic to some types of trading strategies yet beneficial to others.
By measuring noise using the 'Price Density' can enable us to improve our
trading edge and turn noise to our advantage.
Robust analysis of noise can inform us when it is best to avoid trend-following
systems (when noise is too high), and vice versa for systems based on a
mean-reverting trading premise (when market noise is low).
__________________________________________________________________________
Using Noise to our advantage
* Two techniques:
-Measure Noise and trade when suitable for the system
~ High noise = avoid trend-following
~ Low noise = avoid mean-reversion
-Match assets to strategies
~ Only trade 'noisy assets' with Mean-reversion Strategies
~ Only trade 'efficient assests' with Trend-following Strategies
## Price density:-
High values = High noise
Low values = Low noise
___________________________________________________________________________
Disclaimer!! Do your own research
Range BreakoutThis indicator makes easy to identify a range breakout in both the direction
Expected input is number of days that we should expect the range to be in

Michigandolf's 30min Opening RangeThis script plots the 30min Opening Range as well as the previous day's high & low.
Description:
Blue Line = Top of the 30min Opening Range for the session
Pink Line = Bottom of the 30min Opening Range for the session
White Line = Mid-Point of the 30min Opening Range for the session
White Transparent Area = The full range of the 30min Opening Range
Green Line = Yesterday's High for the session
Red Line = Yesterday's Low for the session
Use:
The Opening Range will continue to expand until the first 30minutes of trading has passed, at which point the range will lock in place for the remainder of the trading session. Many traders use these important levels to gauge trade entries and exits (e.g. Mark Fisher's ACD strategy).
This script does not work currently work for futures (e.g. ES, NQ, RTY) due to the session start time. Will configure for futures trading in a future update.

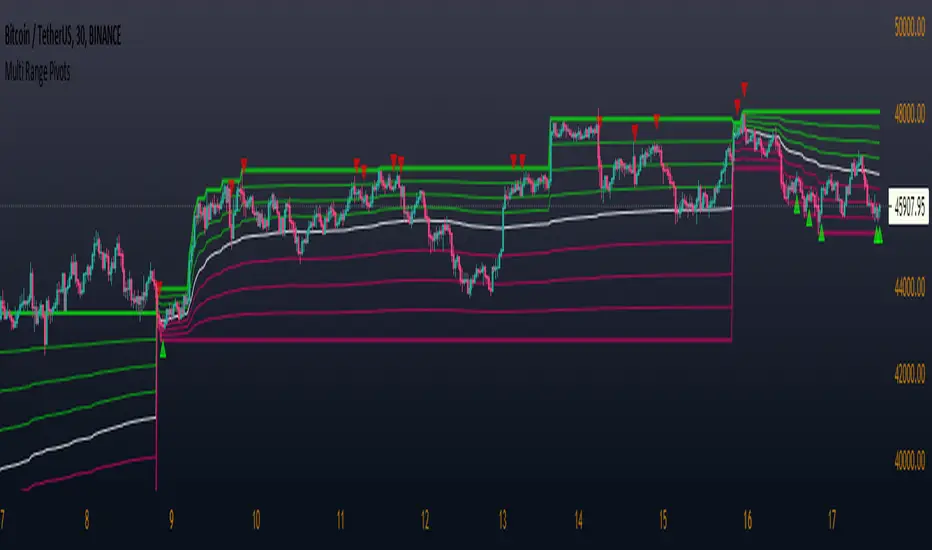
Multi Range Pivots
Multi Range Pivots works by recognizing the high and low of the timeframe selected and plotting range high to MEAN averages and range low to MEAN averages.
This is essentially the VWAP pivots updated to include not only VWAP as a MEAN, but also SMA, EMA, VWMA, DEMA, TEMA, TRIMA, KAMA, MAMA, T3, H/L basis and Donchian basis.
Also, with high and low no longer repainting, I was able to add true reliable signals.
Enjoy
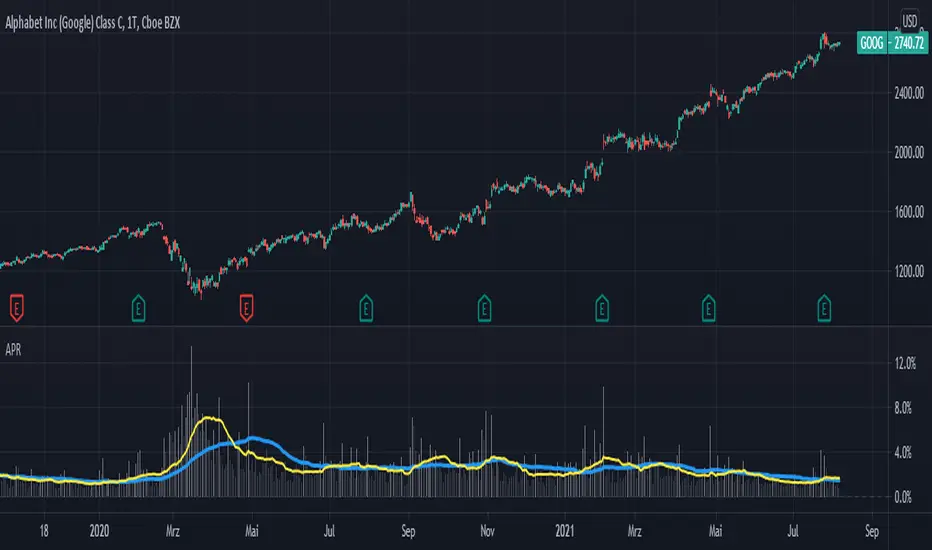
Averange Percentage RangeThis Indicator displays the two different Averange Percentage Range (APR) and the Percentage Range of the current bar.
If the long term APR is over the short term it indicates a lower volatility otherwise a higher.
You can set the calculation method, rising for (highest/lowest-1)*-100 or falling for (lowest/highest-1)*-100.
Burgerized MTF BB + Reverse Engineering RSI (RERSI) + Hidden S&RThis is a mod of a script by informanerd that has helped me immensely with my trading setup.
HUGE HUGE HUGE credit to him! Check him out! He gave me permission to publish this and so here I am, sharing it with you. I hope you all like it!
This version is functionally essentially the same - the difference is in visualization choices and automation.
Instead of selecting different timeframes, and thus having to change not one but 4 timeframes manually every time you look at a different time frame on the main chart, I found (with help from the kind community in the Pine Script chat right here on Tradingview!) a method to choose multiples so that you can have consistent results no matter what timeframe you are looking at.
Default is set to multiples of 2, 4 and 8 which is the system I found works best for myself personally.
I also changed visualization - crossovers are now highlighted in the background of the respective bands. By default I have chosen different transparency levels for crossovers then sitting inside the bands. This destroyed the ability to modify colors the old school way in Style tab, but I have added inputs for all the relative settings so you can modify the visual aspect to your hearts content, as I know my colors make most people barf (something I did when I was younger maybe?).
Hope the nice barfs of color help you quickly see trends and reversals - I know they help me! Happy trading, no matter your timeframe! xD

vol_rangesThis script shows three measures of volatility:
historical (hv): realized volatility of the recent past
median (mv): a long run average of realized volatility
implied (iv): a user-defined volatility
Historical and median volatility are based on the EWMA, rather than standard deviation, method of calculating volatility. Since Tradingview's built in ema function uses a window, the "window" parameter determines how much historical data is used to calculate these volatility measures. E.g. 30 on a daily chart means the previous 30 days.
The plots above and below historical candles show past projections based on these measures. The "periods to expiration" dictates how far the projection extends. At 30 periods to expiration (default), the plot will indicate the one standard deviation range from 30 periods ago. This is calculated by multiplying the volatility measure by the square root of time. For example, if the historical volatility (hv) was 20% and the window is 30, then the plot is drawn over: close * 1.2 * sqrt(30/252).
At the most recent candle, this same calculation is simply drawn as a line projecting into the future.
This script is intended to be used with a particular options contract in mind. For example, if the option expires in 15 days and has an implied volatility of 25%, choose 15 for the window and 25 for the implied volatility options. The ranges drawn will reflect the two standard deviation range both in the future (lines) and at any point in the past (plots) for HV (blue), MV (red), and IV (grey).

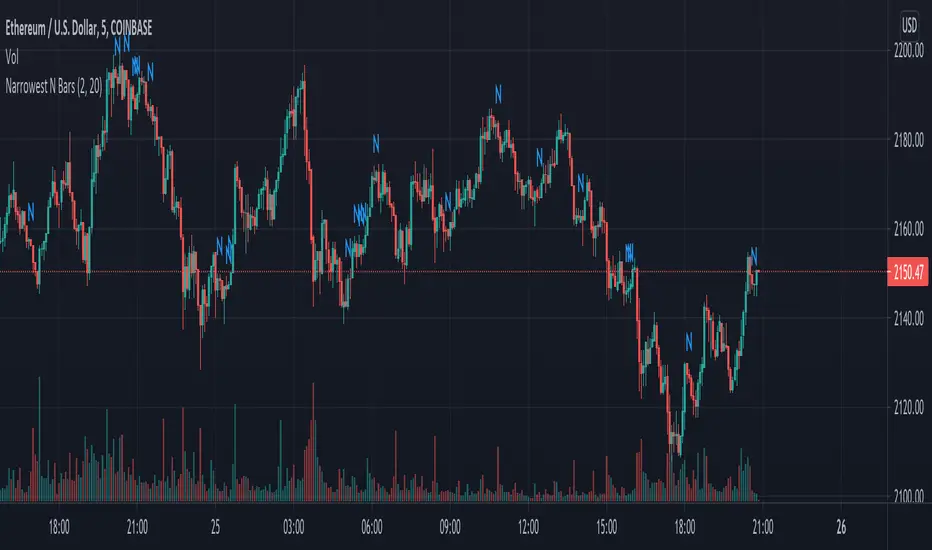
Narrowest N BarsThe indicator is inspired by Toby Crabel's work.
Originally 2-Bar NR pattern is defined as the narrowest range from high to low of any two day period relative to any two day period within the previous 20 market days.
However, this script allows user to look for N Bar narrowest range within user defined numbers of previous days
Settings are as follows:
1. N Bars - sets number of bars in range
2. Lookback period is self-descriptive)
The last bar in the narrowest range is marked with N
High/Low Anchored VWAPHigh/Low Anchored VWAP simply plots an Anchored VWAP at High and Low, within a set range (D,W,M) , with a central "Basis" plot of the High and Low anchored VWAPs
*DISCLAMER* This indicator repaints. DO NOT set alerts or backtest using this indicator.

Narrow Range (NR) IndicatorNarrow Range (NR) trading strategy is a breakout-based method that assumes that the price of security trends up or down after a brief consolidation in a narrow range. This indicator can plot:
1. Narrow Range (NR) 4, 7, and 21
2. Narrow Range (NR) 4, 7, and 21 + Inside Bars (IB)
NR 4/NR 7/NR 21 day acts as a confirming factor on where the price will move further. Breakout of NR 4/NR 7/NR 21 candle with high volumes indicates bullishness, while the breakdown candle indicates bearishness.

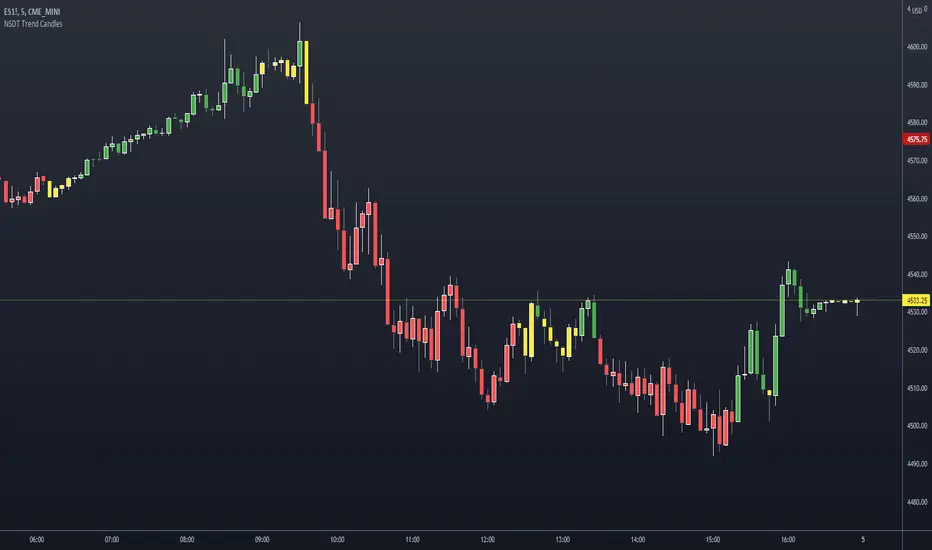
NSDT Trend CandlesThis script changes the color of the candles based on uptrend (green), downtrend (red), neutral/chop (yellow). It uses an ATR and Pivots to determine the direction, or lack of. Since all markets move differently and market volatility changes, you will need to adjust the settings to find a potential match for the day. It's pretty simple to use. Just enter in the direction of the trend and exit (or reverse) when the candle color changes.
ATR Stop Loss FinderThis Indicator uses Average True Range (ATR) to determine a safe place to put stop losses to avoid being stop hunted or stopped out of a trade due to a tight stop loss. Default multiplier setting is 1.5. For a more conservative stop loss use 2 and for a tighter stop loss use 1. ATR and stop loss prices are displayed in table at bottom of screen. Use high(red) for shorts and low(teal) for longs.

Relative VolatilityRelative volatility highlights large changes in price. This was designed to be used with my relative volume indicator so that traders can see the effect of volume on price action. It is also a good tool to analyse breakout patterns to identify best entry points and waves.
Above shows relative volatility and relative volume working together.
