Adaptive Candlestick Pattern Recognition System█ INTRODUCTION
Nearly three years in the making, intermittently worked on in the few spare hours of weekends and time off, this is a passion project I undertook to flesh out my skills as a computer programmer. This script currently recognizes 85 different candlestick patterns ranging from one to five candles in length. It also performs statistical analysis on those patterns to determine prior performance and changes the coloration of those patterns based on that performance. In searching TradingView's script library for scripts similar to this one, I had found a handful. However, when I reviewed the ones which were open source, I did not see many that truly captured the power of PineScrypt or leveraged the way it works to create efficient and reliable code; one of the main driving factors for releasing this 5,000+ line behemoth open sourced.
Please take the time to review this description and source code to utilize this script to its fullest potential.
█ CONCEPTS
This script covers the following topics: Candlestick Theory, Trend Direction, Higher Timeframes, Price Analysis, Statistic Analysis, and Code Design.
Candlestick Theory - This script focuses solely on the concept of Candlestick Theory: arrangements of candlesticks may form certain patterns that can potentially influence the future price action of assets which experience those patterns. A full list of patterns (grouped by pattern length) will be in its own section of this description. This script contains two modes of operation for identifying candlestick patterns, 'CLASSIC' and 'BREAKOUT'.
CLASSIC: In this mode, candlestick patterns will be identified whenever they appear. The user has a wide variety of inputs to manipulate that can change how certain patterns are identified and even enable alerts to notify themselves when these patterns appear. Each pattern selected to appear will have their Profit or Loss (P/L) calculated starting from the first candle open succeeding the pattern to a candle close specified some number of candles ahead. These P/L calculations are then collected for each pattern, and split among partitions of prior price action of the asset the script is currently applied to (more on that in Higher Timeframes ).
BREAKOUT: In this mode, P/L calculations are held off until a breakout direction has been confirmed. The user may specify the number of candles ahead of a pattern's appearance (from one to five) that a pattern has to confirm a breakout in either an upward or downward direction. A breakout is constituted when there is a candle following the appearance of the pattern that closes above/at the highest high of the pattern, or below/at its lowest low. Only then will percent return calculations be performed for the pattern that's been identified, and these percent returns are broken up not only by the partition they had appeared in but also by the breakout direction itself. Patterns which do not breakout in either direction will be ignored, along with having their labels deleted.
In both of these modes, patterns may be overridden. Overrides occur when a smaller pattern has been detected and ends up becoming one (or more) of the candles of a larger pattern. A key example of this would be the Bearish Engulfing and the Three Outside Down patterns. A Three Outside Down necessitates a Bearish Engulfing as the first two candles in it, while the third candle closes lower. When a pattern is overridden, the return for that pattern will no longer be tracked. Overrides will not occur if the tail end of a larger pattern occurs at the beginning of a smaller pattern (Ex: a Bullish Engulfing occurs on the third candle of a Three Outside Down and the candle immediately following that pattern, the Three Outside Down pattern will not be overridden).
Important Functionality Note: These patterns are only searched for at the most recently closed candle, not on the currently closing candle, which creates an offset of one for this script's execution. (SEE LIMITATIONS)
Trend Direction - Many of the patterns require a trend direction prior to their appearance. Noting TradingView's own publication of candlestick patterns, I utilize a similar method for determining trend direction. Moving Averages are used to determine which trend is currently taking place for candlestick patterns to be sought out. The user has access to two Moving Averages which they may individually modify the following for each: Moving Average type (list of 9), their length, width, source values, and all variables associated with two special Moving Averages (Least Squares and Arnaud Legoux).
There are 3 settings for these Moving Averages, the first two switch between the two Moving Averages, and the third uses both. When using individual Moving Averages, the user may select a 'price point' to compare against the Moving Average (default is close). This price point is compared to the Moving Average at the candles prior to the appearance of candle patterns. Meaning: The close compared to the Moving Average two candles behind determines the trend direction used for Candlestick Analysis of one candle patterns; three candles behind for two candle patterns and so on. If the selected price point is above the Moving Average, then the current trend is an 'uptrend', 'downtrend' otherwise.
The third setting using both Moving Averages will compare the lengths of each, and trend direction is determined by the shorter Moving Average compared to the longer one. If the shorter Moving Average is above the longer, then the current trend is an 'uptrend', 'downtrend' otherwise. If the lengths of the Moving Averages are the same, or both Moving Averages are Symmetrical, then MA1 will be used by default. (SEE LIMITATIONS)
Higher Timeframes - This script employs the use of Higher Timeframes with a few request.security calls. The purpose of these calls is strictly for the partitioning of an asset's chart, splitting the returns of patterns into three separate groups. The four inputs in control of this partitioning split the chart based on: A given resolution to grab values from, the length of time in that resolution, and 'Upper' and 'Lower Limits' which split the trading range provided by that length of time in that resolution that forms three separate groups. The default values for these four inputs will partition the current chart by the yearly high-low range where: the 'Upper' partition is the top 20% of that trading range, the 'Middle' partition is 80% to 33% of the trading range, and the 'Lower' partition covers the trading range within 33% of the yearly low.
Patterns which are identified by this script will have their returns grouped together based on which partition they had appeared in. For example, a Bullish Engulfing which occurs within a third of the yearly low will have its return placed separately from a Bullish Engulfing that occurred within 20% of the yearly high. The idea is that certain patterns may perform better or worse depending on when they had occurred during an asset's trading range.
Price Analysis - Price Analysis is a major part of this script's functionality as it can fundamentally change how patterns are shown to the user. The settings related to Price Analysis include setting the number of candles ahead of a pattern's appearance to determine the return of that pattern. In 'BREAKOUT' mode, an additional setting allows the user to specify where the P/L calculation will begin for a pattern that had appeared and confirmed. (SEE LIMITATIONS)
The calculation for percent returns of patterns is illustrated with the following pseudo-code (CLASSIC mode, this is a simplified version of the actual code):
type patternObj
int ID
int partition
type returnsArray
float returns
// No pattern found = na returned
patternObj TEST_VAL = f_FindPattern()
priorTestVal = TEST_VAL
if not na( priorTestVal )
pnlMatrixRow = priorTestVal.ID
pnlMatrixCol = priorTestVal.partition
matrixReturn = matrix.get(PERCENT_RETURNS, pnlMatrixRow, pnlMatrixCol)
percentReturn = ( (close - open ) / open ) * 100%
array.push(matrixReturn.returns, percentReturn)
Statistic Analysis - This script uses Pine's built-in array functions to conduct the Statistic Analysis for patterns. When a pattern is found and its P/L calculation is complete, its return is added to a 'Return Array' User-Defined-Type that contains numerous fields which retain information on a pattern's prior performance. The actual UDT is as follows:
type returnArray
float returns = na
int size = 0
float avg = 0
float median = 0
float stdDev = 0
int polarities = na
All values within this UDT will be updated when a return is added to it (some based on user input). The array.avg , array.median and array.stdev will be ran and saved into their respective fields after a return is placed in the 'returns' array. The 'polarities' integer array is what will be changed based on user input. The user specifies two different percentages that declare 'Positive' and 'Negative' returns for patterns. When a pattern returns above, below, or in between these two values, different indices of this array will be incremented to reflect the kind of return that pattern had just experienced.
These values (plus the full name, partition the pattern occurred in, and a 95% confidence interval of expected returns) will be displayed to the user on the tooltip of the labels that identify patterns. Simply scroll over the pattern label to view each of these values.
Code Design - Overall this script is as much of an art piece as it is functional. Its design features numerous depictions of ASCII Art that illustrate what is being attempted by the functions that identify patterns, and an incalculable amount of time was spent rewriting portions of code to improve its efficiency. Admittedly, this final version is nearly 1,000 lines shorter than a previous version (one which took nearly 30 seconds after compilation to run, and didn't do nearly half of what this version does). The use of UDTs, especially the 'patternObj' one crafted and redesigned from the Hikkake Hunter 2.0 I published last month, played a significant role in making this script run efficiently. There is a slight rigidity in some of this code mainly around pattern IDs which are responsible for displaying the abbreviation for patterns (as well as the full names under the tooltips, and the matrix row position for holding returns), as each is hard-coded to correspond to that pattern.
However, one thing I would like to mention is the extensive use of global variables for pattern detection. Many scripts I had looked over for ideas on how to identify candlestick patterns had the same idea; break the pattern into a set of logical 'true/false' statements derived from historically referencing candle OHLC values. Some scripts which identified upwards of 20 to 30 patterns would reference Pine's built-in OHLC values for each pattern individually, potentially requesting information from TradingView's servers numerous times that could easily be saved into a variable for re-use and only requested once per candle (what this script does).
█ FEATURES
This script features a massive amount of switches, options, floating point values, detection settings, and methods for identifying/tailoring pattern appearances. All modifiable inputs for patterns are grouped together based on the number of candles they contain. Other inputs (like those for statistics settings and coloration) are grouped separately and presented in a way I believe makes the most sense.
Not mentioned above is the coloration settings. One of the aims of this script was to make patterns visually signify their behavior to the user when they are identified. Each pattern has its own collection of returns which are analyzed and compared to the inputs of the user. The user may choose the colors for bullish, neutral, and bearish patterns. They may also choose the minimum number of patterns needed to occur before assigning a color to that pattern based on its behavior; a color for patterns that have not met this minimum number of occurrences yet, and a color for patterns that are still processing in BREAKOUT mode.
There are also an additional three settings which alter the color scheme for patterns: Statistic Point-of-Reference, Adaptive coloring, and Hard Limiting. The Statistic Point-of-Reference decides which value (average or median) will be compared against the 'Negative' and 'Positive Return Tolerance'(s) to guide the coloration of the patterns (or for Adaptive Coloring, the generation of a color gradient).
Adaptive Coloring will have this script produce a gradient that patterns will be colored along. The more bullish or bearish a pattern is, the further along the gradient those patterns will be colored starting from the 'Neutral' color (hard lined at the value of 0%: values above this will be colored bullish, bearish otherwise). When Adaptive Coloring is enabled, this script will request the highest and lowest values (these being the Statistic Point-of-Reference) from the matrix containing all returns and rewrite global variables tied to the negative and positive return tolerances. This means that all patterns identified will be compared with each other to determine bullish/bearishness in Adaptive Coloring.
Hard Limiting will prevent these global variables from being rewritten, so patterns whose Statistic Point-of-Reference exceed the return tolerances will be fully colored the bullish or bearish colors instead of a generated gradient color. (SEE LIMITATIONS)
Apart from the Candle Detection Modes (CLASSIC and BREAKOUT), there's an additional two inputs which modify how this script behaves grouped under a "MASTER DETECTION SETTINGS" tab. These two "Pattern Detection Settings" are 'SWITCHBOARD' and 'TARGET MODE'.
SWITCHBOARD: Every single pattern has a switch that is associated with its detection. When a switch is enabled, the code which searches for that pattern will be run. With the Pattern Detection Setting set to this, all patterns that have their switches enabled will be sought out and shown.
TARGET MODE: There is an additional setting which operates on top of 'SWITCHBOARD' that singles out an individual pattern the user specifies through a drop down list. The names of every pattern recognized by this script will be present along with an identifier that shows the number of candles in that pattern (Ex: " (# candles)"). All patterns enabled in the switchboard will still have their returns measured, but only the pattern selected from the "Target Pattern" list will be shown. (SEE LIMITATIONS)
The vast majority of other features are held in the one, two, and three candle pattern sections.
For one-candle patterns, there are:
3 — Settings related to defining 'Tall' candles:
The number of candles to sample for previous candle-size averages.
The type of comparison done for 'Tall' Candles: Settings are 'RANGE' and 'BODY'.
The 'Tolerance' for tall candles, specifying what percent of the 'average' size candles must exceed to be considered 'Tall'.
When 'Tall Candle Setting' is set to RANGE, the high-low ranges are what the current candle range will be compared against to determine if a candle is 'Tall'. Otherwise the candle bodies (absolute value of the close - open) will be compared instead. (SEE LIMITATIONS)
Hammer Tolerance - How large a 'discarded wick' may be before it disqualifies a candle from being a 'Hammer'.
Discarded wicks are compared to the size of the Hammer's candle body and are dependent upon the body's center position. Hammer bodies closer to the high of the candle will have the upper wick used as its 'discarded wick', otherwise the lower wick is used.
9 — Doji Settings, some pulled from an old Doji Hunter I made a while back:
Doji Tolerance - How large the body of a candle may be compared to the range to be considered a 'Doji'.
Ignore N/S Dojis - Turns off Trend Direction for non-special Dojis.
GS/DF Doji Settings - 2 Inputs that enable and specify how large wicks that typically disqualify Dojis from being 'Gravestone' or 'Dragonfly' Dojis may be.
4 Settings related to 'Long Wick Doji' candles detailed below.
A Tolerance for 'Rickshaw Man' Dojis specifying how close the center of the body must be to the range to be valid.
The 4 settings the user may modify for 'Long Legged' Dojis are: A Sample Base for determining the previous average of wicks, a Sample Length specifying how far back to look for these averages, a Behavior Setting to define how 'Long Legged' Dojis are recognized, and a tolerance to specify how large in comparison to the prior wicks a Doji's wicks must be to be considered 'Long Legged'.
The 'Sample Base' list has two settings:
RANGE: The wicks of prior candles are compared to their candle ranges and the 'wick averages' will be what the average percent of ranges were in the sample.
WICKS: The size of the wicks themselves are averaged and returned for comparing against the current wicks of a Doji.
The 'Behavior' list has three settings:
ONE: Only one wick length needs to exceed the average by the tolerance for a Doji to be considered 'Long Legged'.
BOTH: Both wick lengths need to exceed the average of the tolerance of their respective wicks (upper wicks are compared to upper wicks, lower wicks compared to lower) to be considered 'Long Legged'.
AVG: Both wicks and the averages of the previous wicks are added together, divided by two, and compared. If the 'average' of the current wicks exceeds this combined average of prior wicks by the tolerance, then this would constitute a valid 'Long Legged' Doji. (For Dojis in general - SEE LIMITATIONS)
The final input is one related to candle patterns which require a Marubozu candle in them. The two settings for this input are 'INCLUSIVE' and 'EXCLUSIVE'. If INCLUSIVE is selected, any opening/closing variant of Marubozu candles will be allowed in the patterns that require them.
For two-candle patterns, there are:
2 — Settings which define 'Engulfing' parameters:
Engulfing Setting - Two options, RANGE or BODY which sets up how one candle may 'engulf' the previous.
Inclusive Engulfing - Boolean which enables if 'engulfing' candles can be equal to the values needed to 'engulf' the prior candle.
For the 'Engulfing Setting':
RANGE: If the second candle's high-low range completely covers the high-low range of the prior candle, this is recognized as 'engulfing'.
BODY: If the second candle's open-close completely covers the open-close of the previous candle, this is recognized as 'engulfing'. (SEE LIMITATIONS)
4 — Booleans specifying different settings for a few patterns:
One which allows for 'opens within body' patterns to let the second candle's open/close values match the prior candles' open/close.
One which forces 'Kicking' patterns to have a gap if the Marubozu setting is set to 'INCLUSIVE'.
And Two which dictate if the individual candles in 'Stomach' patterns need to be 'Tall'.
8 — Floating point values which affect 11 different patterns:
One which determines the distance the close of the first candle in a 'Hammer Inverted' pattern must be to the low to be considered valid.
One which affects how close the opens/closes need to be for all 'Lines' patterns (Bull/Bear Meeting/Separating Lines).
One that allows some leeway with the 'Matching Low' pattern (gives a small range the second candle close may be within instead of needing to match the previous close).
Three tolerances for On Neck/In Neck patterns (2 and 1 respectively).
A tolerance for the Thrusting pattern which give a range the close the second candle may be between the midpoint and close of the first to be considered 'valid'.
A tolerance for the two Tweezers patterns that specifies how close the highs and lows of the patterns need to be to each other to be 'valid'.
The first On Neck tolerance specifies how large the lower wick of the first candle may be (as a % of that candle's range) before the pattern is invalidated. The second tolerance specifies how far up the lower wick to the close the second candle's close may be for this pattern. The third tolerance for the In Neck pattern determines how far into the body of the first candle the second may close to be 'valid'.
For the remaining patterns (3, 4, and 5 candles), there are:
3 — Settings for the Deliberation pattern:
A boolean which forces the open of the third candle to gap above the close of the second.
A tolerance which changes the proximity of the third candle's open to the second candle's close in this pattern.
A tolerance that sets the maximum size the third candle may be compared to the average of the first two candles.
One boolean value for the Two Crows patterns (standard and Upside Gapping) that forces the first two candles in the patterns to completely gap if disabled (candle 1's close < candle 2's low).
10 — Floating point values for the remaining patterns:
One tolerance for defining how much the size of each candle in the Identical Black Crows pattern may deviate from the average of themselves to be considered valid.
One tolerance for setting how close the opens/closes of certain three candle patterns may be to each other's opens/closes.*
Three floating point values that affect the Three Stars in the South pattern.
One tolerance for the Side-by-Side patterns - looks at the second and third candle closes.
One tolerance for the Stick Sandwich pattern - looks at the first and third candle closes.
A floating value that sizes the Concealing Baby Swallow pattern's 3rd candle wick.
Two values for the Ladder Bottom pattern which define a range that the third candle's wick size may be.
* This affects the Three Black Crows (non-identical) and Three White Soldiers patterns, each require the opens and closes of every candle to be near each other.
The first tolerance of the Three Stars in the South pattern affects the first candle body's center position, and defines where it must be above to be considered valid. The second tolerance specifies how close the second candle must be to this same position, as well as the deviation the ratio the candle body to its range may be in comparison to the first candle. The third restricts how large the second candle range may be in comparison to the first (prevents this pattern from being recognized if the second candle is similar to the first but larger).
The last two floating point values define upper and lower limits to the wick size of a Ladder Bottom's fourth candle to be considered valid.
█ HOW TO USE
While there are many moving parts to this script, I attempted to set the default values with what I believed may help identify the most patterns within reasonable definitions. When this script is applied to a chart, the Candle Detection Mode (along with the BREAKOUT settings) and all candle switches must be confirmed before patterns are displayed. All switches are on by default, so this gives the user an opportunity to pick which patterns to identify first before playing around in the settings.
All of the settings/inputs described above are meant for experimentation. I encourage the user to tweak these values at will to find which set ups work best for whichever charts they decide to apply these patterns to.
Refer to the patterns themselves during experimentation. The statistic information provided on the tooltips of the patterns are meant to help guide input decisions. The breadth of candlestick theory is deep, and this was an attempt at capturing what I could in its sea of information.
█ LIMITATIONS
DISCLAIMER: While it may seem a bit paradoxical that this script aims to use past performance to potentially measure future results, past performance is not indicative of future results . Markets are highly adaptive and often unpredictable. This script is meant as an informational tool to show how patterns may behave. There is no guarantee that confidence intervals (or any other metric measured with this script) are accurate to the performance of patterns; caution must be exercised with all patterns identified regardless of how much information regarding prior performance is available.
Candlestick Theory - In the name, Candlestick Theory is a theory , and all theories come with their own limits. Some patterns identified by this script may be completely useless/unprofitable/unpredictable regardless of whatever combination of settings are used to identify them. However, if I truly believed this theory had no merit, this script would not exist. It is important to understand that this is a tool meant to be utilized with an array of others to procure positive (or negative, looking at you, short sellers ) results when navigating the complex world of finance.
To address the functionality note however, this script has an offset of 1 by default. Patterns will not be identified on the currently closing candle, only on the candle which has most recently closed. Attempting to have this script do both (offset by one or identify on close) lead to more trouble than it was worth. I personally just want users to be aware that patterns will not be identified immediately when they appear.
Trend Direction - Moving Averages - There is a small quirk with how MA settings will be adjusted if the user inputs two moving averages of the same length when the "MA Setting" is set to 'BOTH'. If Moving Averages have the same length, this script will default to only using MA 1 regardless of if the types of Moving Averages are different . I will experiment in the future to alleviate/reduce this restriction.
Price Analysis - BREAKOUT mode - With how identifying patterns with a look-ahead confirmation works, the percent returns for patterns that break out in either direction will be calculated on the same candle regardless of if P/L Offset is set to 'FROM CONFIRMATION' or 'FROM APPEARANCE'. This same issue is present in the Hikkake Hunter script mentioned earlier. This does not mean the P/L calculations are incorrect , the offset for the calculation is set by the number of candles required to confirm the pattern if 'FROM APPEARANCE' is selected. It just means that these two different P/L calculations will complete at the same time independent of the setting that's been selected.
Adaptive Coloring/Hard Limiting - Hard Limiting is only used with Adaptive Coloring and has no effect outside of it. If Hard Limiting is used, it is recommended to increase the 'Positive' and 'Negative' return tolerance values as a pattern's bullish/bearishness may be disproportionately represented with the gradient generated under a hard limit.
TARGET MODE - This mode will break rules regarding patterns that are overridden on purpose. If a pattern selected in TARGET mode would have otherwise been absorbed by a larger pattern, it will have that pattern's percent return calculated; potentially leading to duplicate returns being included in the matrix of all returns recognized by this script.
'Tall' Candle Setting - This is a wide-reaching setting, as approximately 30 different patterns or so rely on defining 'Tall' candles. Changing how 'Tall' candles are defined whether by the tolerance value those candles need to exceed or by the values of the candle used for the baseline comparison (RANGE/BODY) can wildly affect how this script functions under certain conditions. Refer to the tooltip of these settings for more information on which specific patterns are affected by this.
Doji Settings - There are roughly 10 or so two to three candle patterns which have Dojis as a part of them. If all Dojis are disabled, it will prevent some of these larger patterns from being recognized. This is a dependency issue that I may address in the future.
'Engulfing' Setting - Functionally, the two 'Engulfing' settings are quite different. Because of this, the 'RANGE' setting may cause certain patterns that would otherwise be valid under textbook and online references/definitions to not be recognized as such (like the Upside Gap Two Crows or Three Outside down).
█ PATTERN LIST
This script recognizes 85 patterns upon initial release. I am open to adding additional patterns to it in the future and any comments/suggestions are appreciated. It recognizes:
15 — 1 Candle Patterns
4 Hammer type patterns: Regular Hammer, Takuri Line, Shooting Star, and Hanging Man
9 Doji Candles: Regular Dojis, Northern/Southern Dojis, Gravestone/Dragonfly Dojis, Gapping Up/Down Dojis, and Long-Legged/Rickshaw Man Dojis
White/Black Long Days
32 — 2 Candle Patterns
4 Engulfing type patterns: Bullish/Bearish Engulfing and Last Engulfing Top/Bottom
Dark Cloud Cover
Bullish/Bearish Doji Star patterns
Hammer Inverted
Bullish/Bearish Haramis + Cross variants
Homing Pigeon
Bullish/Bearish Kicking
4 Lines type patterns: Bullish/Bearish Meeting/Separating Lines
Matching Low
On/In Neck patterns
Piercing pattern
Shooting Star (2 Lines)
Above/Below Stomach patterns
Thrusting
Tweezers Top/Bottom patterns
Two Black Gapping
Rising/Falling Window patterns
29 — 3 Candle Patterns
Bullish/Bearish Abandoned Baby patterns
Advance Block
Collapsing Doji Star
Deliberation
Upside/Downside Gap Three Methods patterns
Three Inside/Outside Up/Down patterns (4 total)
Bullish/Bearish Side-by-Side patterns
Morning/Evening Star patterns + Doji variants
Stick Sandwich
Downside/Upside Tasuki Gap patterns
Three Black Crows + Identical variation
Three White Soldiers
Three Stars in the South
Bullish/Bearish Tri-Star patterns
Two Crows + Upside Gap variant
Unique Three River Bottom
3 — 4 Candle Patterns
Concealing Baby Swallow
Bullish/Bearish Three Line Strike patterns
6 — 5 Candle Patterns
Bullish/Bearish Breakaway patterns
Ladder Bottom
Mat Hold
Rising/Falling Three Methods patterns
█ WORKS CITED
Because of the amount of time needed to complete this script, I am unable to provide exact dates for when some of these references were used. I will also not provide every single reference, as citing a reference for each individual pattern and the place it was reviewed would lead to a bibliography larger than this script and its description combined. There were five major resources I used when building this script, one book, two websites (for various different reasons including patterns, moving averages, and various other articles of information), various scripts from TradingView's public library (including TradingView's own source code for *all* candle patterns ), and PineScrypt's reference manual.
Bulkowski, Thomas N. Encyclopedia of Candlestick Patterns . Hoboken, New Jersey: John Wiley & Sons Inc., 2008. E-book (google books).
Various. Numerous webpages. CandleScanner . 2023. online. Accessed 2020 - 2023.
Various. Numerous webpages. Investopedia . 2023. online. Accessed 2020 - 2023.
█ AKNOWLEDGEMENTS
I want to take the time here to thank all of my friends and family, both online and in real life, for the support they've given me over the last few years in this endeavor. My pets who tried their hardest to keep me from completing it. And work for the grit to continue pushing through until this script's completion.
This belongs to me just as much as it does anyone else. Whether you are an institutional trader, gold bug hedging against the dollar, retail ape who got in on a squeeze, or just parents trying to grow their retirement/save for the kids. This belongs to everyone.
Private Beta for new features to be tested can be found here .
Vires In Numeris
Pattern

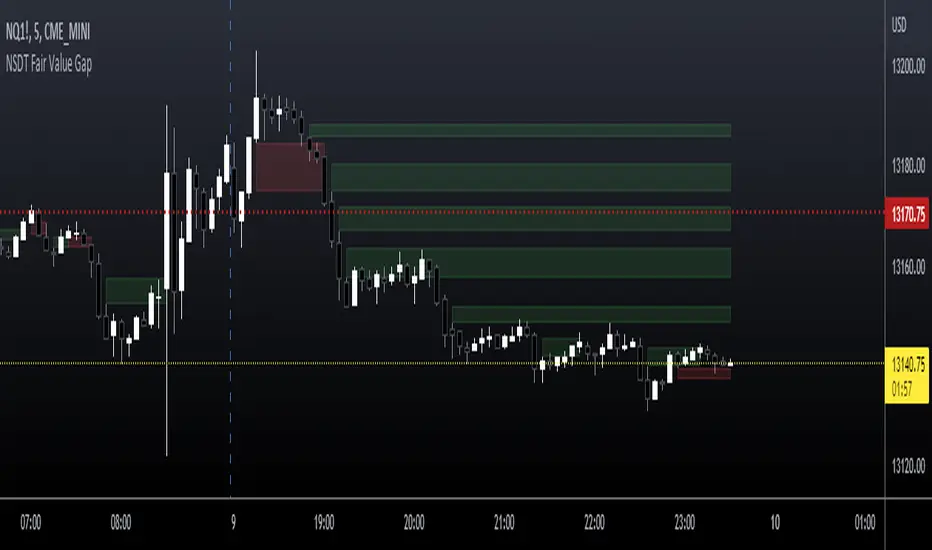
NSDT Fair Value GapThis script is our version of the "Fair Value Gap".
A Fair Value Gap is nothing more than a series of 3 candles with a gap between a candle high/low and a candle high/low two candles prior.
For example:
A Gap Up - the Low of a candle is higher than the High of two candles back.
A Gap Down - the High of a candle is lower than the Low of two candles back.
Typically, on a Gap Up, the trader would wait for the price to re-enter the Gap, and take a Long position.
Typically, on a Gap Down, the trader would wait for the price to re-enter the Gap, and take a Short position.
We found that simply trading through the Gaps (fill the gap) produced a better result. So we reversed the procedure and the colors to show our suggested direction.
We have added inputs so the trader can determine the size of the Gaps to be plotted on the chart. A minimum and maximum can be set.
The number of Gaps to be displayed can be adjusted.
There is a option to remove Gaps that had been filled, to help keep a clean chart.
[TTI] IBD's 3 (three) weeks tight close pattern––––HISTORY & CREDITS 🏦
The Three Weeks Tight Close pattern is a technical analysis pattern that occurs when a stock closes at nearly the same price for three consecutive weeks, suggesting a period of consolidation before the stock moves in a new direction. The concept of "line of least resistance" as mentioned by Jesse Livermore is closely related to this pattern. It indicates that there is a period of indecision in the market, with buyers and sellers fairly evenly matched. This pattern is often associated with stocks that have strong fundamentals and a solid business model. The pattern was first discovered by Investor's Business Daily founder William Bill O'Neill.
––––WHAT IT DOES 💡
The Three Weeks Tight Close pattern helps traders identify periods of consolidation in a stock's price movement. During these periods, the stock's closing price remains nearly unchanged for three consecutive weeks. This pattern can be a signal that the stock is under accumulation and potentially ready to make a significant move in either an upward or downward direction. By identifying these tight closes, traders can prepare to take advantage of the solid price run and make profitable trades.
The indicator plots 3 different dots/squares above the weekly bar on order to indicate which consecutive tight close wee have.
👉 Cyan color indicates 3 week tight closes
👉 Pink color indicates 4 week tight closes
👉 Red color indicates 5 week tight closes
––––HOW TO USE IT 🔧
• Focus on weekly charts for easier identification.
• Look for three consecutive weekly closes with nearly the same price, within 1-1.5% of each other. Using the indicator.
• Check for low volume during the tightening period.
• Once the pattern is confirmed, switch to the daily timeframe to find the exact buy point.
• Use other technical indicators to confirm a breakout before taking a position in the stock, such as breakouts, moving averages, and trend lines.
• Monitor the position regularly to ensure continued positive price movement.
• Be patient and wait for confirmation before buying in.
• Use stop-loss orders to limit losses if the stock does not move in the expected direction.
• Consider the overall market and its impact on individual stocks before making a trade.
• Keep in mind that not all three tight closes are created equal and use technical analysis to confirm your suspicions.
By following these steps, traders can use the Three Weeks Tight Close pattern to identify potential trading opportunities and increase their chances of making profitable trades.

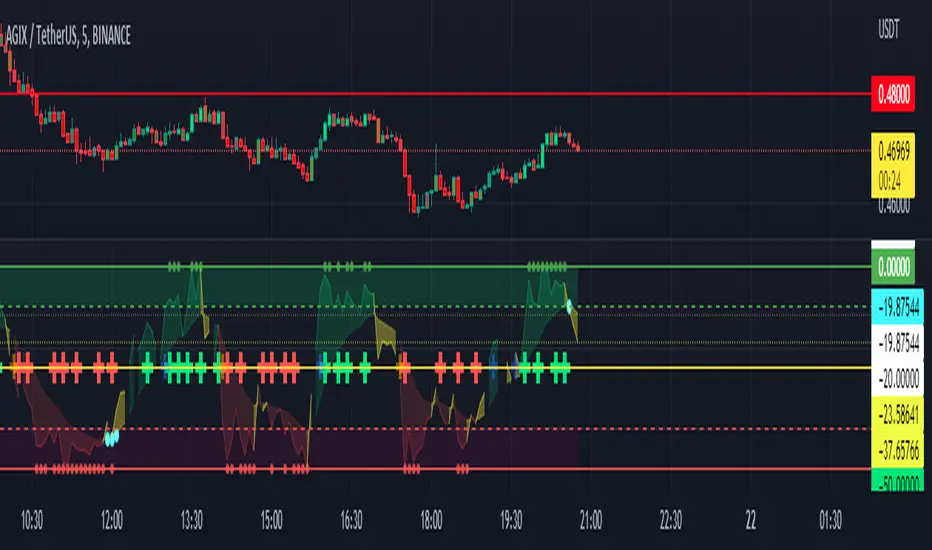
FOREX Master Pattern Trend Finder by nnamdertWhat does this Indicator do?
This indicator works by identifying Trends and "potential" shifts in trends before they happen. It is technically a momentum indicator that watches for specific Bullish or Bearish momentum (i.e. Bull Runs, and Crashes).
How does it do this?
It uses a custom script that takes into account extremes in price and certain moving averages and other accurate forward looking indicators. Once it finds a Bull run, signals are triggered in the form of PLUS signs. It does the same for strong Bearish trends. Based on how the script is configured, the Indicator is able to spot (in advance) unique movement in the trend that can predict a change in momentum prior to the change occurring.
These momentum changes can be configured as alerts.
As seen in the screenshot below the indicator triggers "early warning" signals when it detects a specific movement that is indicative of a potential change in momentum or trend. It does this IN ADVANCE of any change - it is ONLY A PREDICTION but allows the trader to look at the asset to determine if the potential change in trend is valid and gives the trader enough time to set up a trade and stop-loss.
As seen in the screenshot below color-coded candles allow the trader to visually SEE the change on the chart making it easier to get a quick glance at the current trend. In addition, Green and Red Crosses were added to the oscillator to help easily identify trends if the color coded candle feature is turned OFF. These Red and Green Crosses are not located at every highlighted bar location, rather, at the first bar that the alert was triggered on. If there was a gap in the trend, the alert triggers, and plots again when a new trend starts.
As seen in the screenshot below, when a strong trend is present in either direction, small red or green dots are plotted on the oscillator. This makes spotting past and current trends much easier. Even if the price is not moving up or down, this indicates strong underlying buying or selling pressure.
Some traders like using indicators as a reversal finder. Although this indicator is NOT A REVERSAL INDICATOR, I added a signal that can be used as a "potential" reversal finder. You can see this in the screenshot below.
These "reversal" signals typically appear prior to a move in the opposite direction (but not always). A stop-loss can be set at the high or low of the previous bar depending on direction.
At times, multiple "conflicting" warning signals appear back-to-back. This is indicative of a "crab" in the market. Basically, indecision is present in the market. These "early warning" signals are smaller and either BLUE or ORANGE . Once a trend is recognized, the signal will be either RED or GREEN and a bit larger.
Viewing a higher timeframe will allow Forex Master Pattern traders to easily spot contraction zones. I manually draw the lines in at these zones. These "Value Lines" are typically respected in the future. As shown in the screenshot below, the level acted as support in the future and a newer value line was created at a "higher level" - this indicates a Bullish momentum in price as buyers and sellers have agreed upon the higher price as a true value area.
As seen in the screenshot below, multiple potential reversal signals plotted on the chart indicate a "weakening' in the strength of the current trend. This allows the trader to strategically move their stop-loss or simply take some profits off the table at this level.
This Indicator does NOT overlay on the current chart but allows the trader to see color coded bars. Simply double clicking within the indicator will expand the indicator to full screen, and double clicking within the chart itself will hide the secondary pane but keep the candles visible on the chart.
Happy Trading and GOOD LUCK!
Hikkake Hunter 2.0This script serves as a successor to a previous script I wrote for identifying Hikkakes nearly two years ago.
The old version has been preserved here:
█ OVERVIEW
This script is a rework of an old script that identified the Hikkake candlestick pattern. While this pattern is not usually considered a part of the standard candlestick patterns set, I found a lot of value when finding a solution to identifying it. A Hikkake pattern is a 3-candle pattern where a middle candle is nested in between the range of the prior candle, and a candle that follows has a higher high and a higher low (bearish setup) or a lower high and a lower low (bullish setup). What makes this pattern unique is the "confirmation" status of the pattern; within 3 candles of this pattern's appearance, there must be a candle that closes above the high (bullish setup) or below the low (bearish setup) of the second candle. Additional flexibility has been added which allows the user to specify the number of candles (up to 5) that the pattern may have to confirm after its appearance.
█ CONCEPTS
This script will cover concepts mainly focusing on candlestick analysis, price analysis (with higher timeframes), and statistical analysis. I believe there is also educational value presented with the use of user-defined-types (UDTs) in accomplishing these concepts that I hope others will find useful.
Candlestick Analysis - Identification and confirmation of the patterns in the deprecated script were clunky and inefficient. While the previous script required the use of 6 candles to perform the confirmations of patterns (restricted solely to identifying patterns that confirmed in 3 candles or less), this script only requires 3 candles to identify and process patterns by utilizing a UDT representing a 'pattern object'. An object representing a pattern will be created when it has been identified, and fields within that object will be set for processing by the functions it is passed to. Pattern objects are held by a var array (values within the array persist between bars) and will be removed from this array once they have been confirmed or non-confirmed.
This is a significant deviation from the previous script's methods, as it prevents unnecessary re-evaluations of the confirmation status of patterns (i.e. Hikkakes confirmed on the first candle will no longer need to be checked for confirmations on the second or third; a pitfall of the deprecated version which required multiple booleans tracking prior confirmation statuses). This deviation is also what provides the flexibility in changing the number of candles that can pass before a pattern is deemed non-confirmed.
As multiple patterns can be confirmed simultaneously, this script uses another UDT representing a linked-list reduction of the pattern object used to process it. This liked-list object will then be used for Price Analysis.
Price Analysis - This script employs the use of a UDT which contains all the returns of confirmed patterns. The user specifies how many candles ahead of the confirmed pattern to calculate its return, as well as where this calculation begins. There are two settings: FROM APPEARANCE and FROM CONFIRMATION (default). Price differences are calculated from the open of the candle immediately following the candle which had confirmed the pattern to the close of the candle X candles ahead (default 10). ( SEE FEATURES )
Because of how Pine functions, this calculation necessitates a lookback on prior candles to identify when a pattern had been confirmed. This is accomplished with the following pseudo-code:
if not na(confirmed linked-list )
for all confirmed in list
GET MATRIX PLACEMENT
offset = FROM CONFIRMATION ? 0 : # of candles to confirm
openAtFind = open
percent return = ((close - openAtFind) / openAtFind) * 100
ADD percent return TO UDT IN MATRIX
All return UDTs are held in a matrix which breaks up these patterns into specific groups covered in the next section.
Higher Timeframes - This script makes a request.security call to a higher timeframe in order to identify a price range which breaks up these patterns into groups based on the 'partition' they had appeared in. The default values for this partitioning will break up the chart into three sections: upper, middle, and lower. The upper section represents the highest 20% of the yearly trading range that an asset has experienced. The lower section represents the trading range within a third (33%) of the yearly low. And the middle section represents the yearly high-low range between these two partitions.
The matrix containing all return UDTs will have these returns split up based on the number of candles required to confirm the pattern as well as the partition the pattern had appeared in. The underlying rationale is that patterns may perform better or worse at different parts of an asset's trading range.
Statistical Analysis - Once a pattern has been confirmed, the matrix containing all return UDTs will be queried to check if a 'returnArray' object has been created for that specific pattern. If not, one will be initialized and a confirmed linked-list object will be created that contains information pertinent to the matrix position of this object.
This matrix contains the returns of both the Bullish and Bearish Hikkake patterns, separated by the number of candles needed to confirm them, and by the partitions they had appeared in. For the standard 3 candles to confirm, this means the matrix will contain 18 elements (dependent on the number of candles allowed for confirmations; its size will range from 12 to 30).
When the required number of candles for Price Analysis passes, a percent return is calculated and added to the returnArray contained in the matrix at the location derived from the confirmed linked-list object's values. The return is added, and all values in the returnArray are updated using Pine's built in array.___ functions. This returnArray object contains the array of all returns, its size, its average, the median, the standard deviation of returns, and a separate 3-integer array which holds values that correspond to the types of returns experienced by this pattern (negative, neutral, and positive)*.
After a pattern has been confirmed, this script will place the partition and all of the aforementioned stats values (plus a 95% confidence interval of expected returns) related to that pattern onto the tooltip of the label that identifies it. This allows users to scroll over the label of a confirmed pattern to gauge its prior performance under specific conditions. The percent return of the specific pattern identified will later be placed onto the label tooltip as well. ( SEE LIMITATIONS )
The stats portion of this script also plays a significant role in how patterns are presented when using the Adaptive Coloring mode described in FEATURES .
*These values are incremented based on user-input related to what constitutes a 'negative' or 'positive' return. Default values would place any return by a pattern between -3% and 3% in the 'neutral' category, and values exceeding either end will be placed in the 'negative' or 'positive' categories.
█ FEATURES
This script contains numerous inputs for modifying its behavior and how patterns are presented/processed, separated into 5 groups.
Confirmation Setting - The most important input for this script's functioning. This input is a 'confirm=true' input and must be set by the user before the script is applied to the chart. It sets the number of candles that a pattern has to confirm once it has been identified.
Alert Settings - This group of booleans sets which types of alerts will fire during the scripts execution on the chart. If enabled, the four alerts will trigger when: a pattern has been identified, a pattern has been confirmed, a pattern has been non-confirmed, and show the return for that confirmed pattern in an alert. Because this script uses the 'alert' function and not 'alertcondition', these must be enabled before 'any alert() function call' is set in TradingView's 'alerts' settings.
Partition Settings - This group of inputs are responsible for creating (and viewing) the partitions that breaks the returns of the patterns identified up into their respective groups. The user may set the resolution to grab the range from, the length back of this resolution the partitions get their values from, the thresholds which breaks the partitions up into their groups, and modify the visibility (if they're shown, the colors, opacity) of these partitions.
Stats Settings - These inputs will drastically alter how patterns are presented and the resulting information derived from them after their appearance. Because of this section's importance, some of these inputs will be described in more detail.
P/L Sample Length - Defines the number of candles after the starting point to grab values from in the % return calculation for that pattern.
P/L Starting Point - Defines the starting point where the P/L calculation will take place. 'FROM APPEARANCE' will set the starting point at the candle immediately following the pattern's appearance. 'FROM CONFIRMATION' will place the starting point immediately following the candle which had confirmed the pattern. ( SEE LIMITATIONS )
Min Returns Needed - Sets how many times a specific pattern must appear (both by number of candles needed to confirm and by partition) before the statistics for that pattern are displayed onto the tooltip (and for gradient coloration in Adaptive Coloring mode).
Enable Adaptive Coloring - Changes the coloration of the patterns based on the bullish/bearishness of the specified Gradient Reference value of that pattern compared to the Return Tolerance values OR the minimum and maximum values of that specified Gradient Reference value contained in the matrix of all returns. This creates a color from a gradient using the user-specified colors and alters how many of the patterns may appear if prior performance is taken into account.
Gradient Reference - Defines which stats measure of returns will be used in the gradient color generation. The two settings are 'AVG' and 'MEDIAN'.
Hard Limit - This boolean sets whether the Return Tolerance values will not be replaced by values that exceed them from the matrix of returns in color gradient generation. This changes the scale of the gradient where any Gradient Reference values of patterns that exceed these tolerances will be colored the full bullish or bearish gradient colors, and anything in between them will be given a color from the gradient.
Visibility Settings - This last section includes all settings associated with the overall visibility of patterns found with this script. This includes the position of the labels and their colors (+ pattern colors without Adaptive Coloring being enabled), and showing patterns that were non-confirmed.
Most of these inputs in the script have these kinds of descriptions to what they do provided by their tooltips.
█ HOW TO USE
I attempted to make this script much easier to use in terms of analyzing the patterns and displaying the information to the user. The previous script would have the user go to the 'data window' side bar on TradingView to view the returns of a pattern after they had specified which pattern to analyze through the settings, needlessly convoluted. This aim at simplicity was achieved through the use of UDTs and specific code-design.
To use, simply apply the indicator to a chart, set the number of candles (between 2 and 5) for confirming this specific pattern and adjust the many settings described above at your leisure.
█ LIMITATIONS
Disclaimer - This is a tool created with the hopes of helping identify a specific pattern and provide an informative view about the performance of that pattern. Previous performance is not indicative of future results. None of this constitutes any form of financial advice, *use at your own risk*.
Statistical Analysis - This script assumes that all patterns will yield a NORMAL DISTRIBUTION regarding their returns which may not be reflective of reality. I personally have limited experience within the field of statistics apart from a few high school/college courses and make no guarantees that the calculation of the 95% confidence interval is correct. Please review the source code to verify for yourself that this interval calculation is correct (Function Name: f_DisplayStatsOnLabel).
P/L Starting Point - Because of when the object related to the confirmation status of a pattern is created (specifically the linked-list object) setting the 'P/L Starting Point' to 'FROM APPEARANCE' will yield the results of that P/L calculation at the same time as 'FROM CONFIRMATION'.
█ EXAMPLES
Default Settings:
Partition Background (default):
Partition Background (Resolution D : Length 30):
Adaptive Coloration:
Show Non-Confirmed:

DojiCandle body size RSI-SMMA filter MTF
DojiCandle body size RSI-SMMA filter MTF
Hi. I was inspired by a public script written by @ahmedirshad419, .
I thank him for his idea and hard work.
His script is the combination of RSI and Engulfing Pattern.
//------------------------------------------------------------
I decided to tweak it a bit with Open IA.
I have changed:
1) candle pattern to DojiCandle Pattern;
2) I added the ability for the user to change the size of the candlestick body;
3) Added SMMA 200;
4) Changed the colour of SMMA 200 depending on price direction;
5) Added a change in the colour of candlesticks, depending on the colour of the SMMA 200;
6) Added buy and sell signals with indicator name, ticker and close price;
7) Added ability to use indicator on multi time frame.
How it works
1. when RSI > 70 > SMMA 200 and form the bullish DojiCandle Pattern. It gives sell signal
2. when RSI < 30 < SMMA 200 and form the bearish DojiCandle Pattern. It gives buy signal
settings:
basic setting for RSI, SMMA 200 has been enabled in the script to set the levels accordingly to your trades
Enjoy

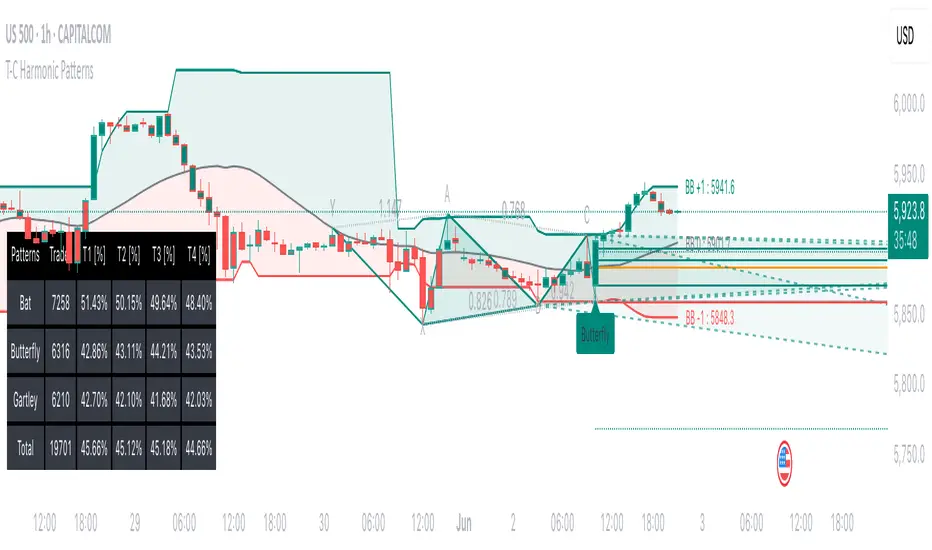
Tailored-Custom Hamonic Patterns█ OVERVIEW
We have included by default 3 known Patterns. The Bat, the Butterfly and the Gartley. But have you ever wondered how effective other,
not yet known models could be? Don't ask yourself the question anymore, it's time to find out for yourself! You have the option to customize
your own Patterns with the Backtesting tool and set Retracement Ratios and Targets for your own Patterns. In addition to this, in order to determine
the Trend at a glance and make Pattern detection more efficient, we have linked the calculation of Patterns to Bands of several types to choose
from (Bollinger, Keltner, Donchian) that you can select from a drop-down menu in the settings and play with the Multiplier
and the Adaptive Length of the Patterns to see how it affects the success rate in the Backtesting table.
█ HOW DOES IT WORK?
- Harmonic Patterns
-Pattern Names, Colors, Style etc… Everything is customizable.
-Dynamic Adaptative Length with Min/Max Length.
- XAB/ABC Ratio
-Min/Max XAB/ABC Configurable Ratio for each Pattern to create your own Patterns.
(This is really the particular option of this Indicator, because it allows you to be able to Backtest in real time
after having played at configuring your own Ratios)
- Bands
-Contrary to the original logic of the HeWhoMustNotBeNamed script, here when the price breaks out of the upper Bands
(example, Bollinger band, Keltner Channel or Donchian Channel) , with a predetermined Minimum and Maximum Length and Multiplier, we can consider
the Trend to be Bearish (and not Bullish) and similarly when the price breaks down in the lower band, we can consider the Trend
to be Bullish (not Bearish) . We have also added the middle line of the Channels (which can be useful for 'Scalper' type Traders.
-The Length of the Bands Filter is directly related to the Dynamic Length of the Patterns.
-You can use a drop-down menu to select from the following Bands Filters :
SMA, EMA, HMA, RMA, WMA, VWMA, HIGH/LOW, LINREG, MEDIAN.
-Sticky and Adaptive Bands options has been included.
- Projections
-BD/CD Projection Ratio configurable for each Pattern.
(Projections are visible as Dotted Lines which we can choose to Extend or not)
- Targets
-Target, PRZ and Stop Levels are set to optimal values based on individual Patterns. (The PRZ Level corresponds to point D
of the detected Pattern so its value should always be 0) but you can change the Targets value (defined in %) as you wish.
Again here, you have the option to fully configure the Style and Extend the Lines or not.
- Backtesting Table
-As said previously, with the possibility of testing the Success Rate of each of the 3 Customizable Patterns,
this option is part of the logic of this Indicator.
- Alerts
-We originally believe that this Indicator does not even need Alerts. But we still decided to include at least one Alert
that you can set for when a new Pattern is detected.
█ NOTES
Thanks to HeWhoMustNotBeNamed for his permission to reuse some part of his zigzag scripts.
Remember to only make a decision once you are sure of your analysis. Good trading sessions to everyone and don't forget,
risk management remains the most important!
The Candle Hunter Candlestick Pattern - by Karoshi TradingThe Candle Hunter Indicator - by Karoshi Trading
The Candle Hunter Indicator is based on specific Candlesticks and Patterns.
Activating this indicator will mark all specific Bullish & Bearish Candles on the Chart.
Depending on your settings, not all candles will be displayed on the chart.
The goal of this indicator is, to highlight all the important trending candles and ignore all ranging candles.
This can be helpful for rejecting/bouncing zones or S&R Levels. Or even if you like to trade reversals, you do not want to trade it on low volume ranging candles.
This indicator should only be used as a supplementary tool while trading, not as a stand alone.
Which Candles & Pattern will be marked on the chart?
1# Pinbar / Hammer (multiple Variations)
2# Marubozu Candles (multiple Variations)
3# Engulfing Candles (Multiple Variations)
How does this indicator works?
First of all, the indicator has to calculate 3 different parameters, before marking one of the given candle. To do so, we will need the average volume, average candle size and the specific candles.
1st Parameter: Defining the needed Candles
First of all, the indicator will calculate, based on the opening & closing price and also the wick (range of each candle). If one of the calculation is a match, for the mentioned candles above, we come to step 2.
2nd Parameter: Average Candle Size
The next one is the size of each candle, compared to the average candle on the chart.
You can customize the settings, but in this example, we want the specific candle be at least 1.5 times the size of the average last 14 candles.
3rd Parameter: Average Volume
The indicator will now calculate the average volume of the last selected candles period (default settings = 14) and compare it to the current candle. In this example, the current candle should be at least 1.5 times the average volume.
The indicator provides two possibilities to calculate the average volume:
1# Volume MA = Volume Moving Average
2# Volume SA = Volume Simple Average
Result: Colorizing the given Candle
After all parameters were met, the indicator will colorize and mark with a label + name all the candles on the chart.
Special Settings:
1st The Engulfing Candles, have 3 different options:
1# Classic = Only the body of the previous candle has to be engulfed by the current candle
2# Reinforced = The full candle + wick of the previous candle has to be engulfed
3# Multiple Candles = Minimum 3 previous candles has to be engulfed to be marked on the chart
The numbers of candles are changeable and you can have all 3 options simultaneously active.
That means, that the code will check all 3 options to see if there is a match.
2nd Marubozu Candle
You can set the ratio between body compared to wick in the settings. Depends if you want full marubozu candles or also the variations of it.
3rd Hammer Wick
You can decide how much bigger the wick should be, compared to the body of the candle. The default settings are set on 1.5 times.
You can also set the position of the body. As example if the settings are set on 30%, the body of the hammer should be on the upper half of a bullish hammer or the lower 30% of the candle if bearish.

wedges and flagsThis script identifies chart patterns: wedges, flags, triangles on the chart
It has many settings. You can choose by which extremums you want to identify patterns - by the edges of wicks (tails, shadows), or by the edges of candle bodies .
You can also adjust the accuracy - how smooth and accurate the shapes must be in order for them to be considered wedges or triangles.
You can also customize other parameters of the figure, for example, how long the flagpole should be in order to consider such a figure a wedge, a flag or a triangle.
You can also set how large the allowable spread of candles relative to the flagpole can be.
The Sensitivity parameter - will allow you to control the number of patterns detected depending on whether you want the patterns to be detected more often, or if they cover more candles and thus be more reliable
You can also customize your styles.
All key settings are accompanied by tooltips
FOREX MASTER PATTERN Companion ToolWhat This Indicator Does
The Forex Master Pattern uses candlesticks, which provide more information than line, OHLC or area charts. For this reason, candlestick patterns are a useful tool for gauging price movements on all time frames. While there are many candlestick patterns, there is one which is particularly useful...
The Engulfing Pattern
An engulfing pattern provides an excellent trading opportunity because it can be easily spotted and the price action indicates a strong and immediate change in direction. In a downtrend, an up candle real body will completely engulf the prior down candle real body (bullish engulfing). In an uptrend a down candle real body will completely engulf the prior up candle real body (bearish engulfing).
Used in conjunction with the FOREX Master Pattern value line, the Engulfing Pattern can assist the trader with reversal timing or trend confirmation during the expansion and trend phases.
As shown in the screenshot below. Engulfing Candles usually precede a sharp move in price in the direction of the engulfing candle.
As shown in the screenshot below, when the Show Lines option is ON while using the indicator, both red and green lines are drawn on the chart automatically when engulfing candles form. These lines are projected forward 100 bars and tend to be reliable support and resistance areas. These areas are typically hidden from view.
In addition to the Show Lines option, the indicator (by default) creates boxes around trading zones that are created when an engulfing candle is formed. (There is an option to hide these from view if desired).
As seen in the screenshot below, these areas / zones are wider than a line and encompass a resistance / support zone rather than a specific price. Liquidity is usually high in these areas and a lot of selling / buying occurs here. These zones are drawn in advance out into the future giving the trader an idea of where price will revert to eventually.
A combination of LINES and AREAS can be used giving the user a better idea of where within the zone price will go.
As seen on the screenshot below, this combination provides a pretty accurate indication of the reversal point well in advance.
As seen in the screenshot below, when a ZONE / AREA has been fully breached (crossed) by price, the area is deactivated an no longer continues forward on the chart. Until price breaches an area, it remains valid and continues on the chart until and only if it is breached by price.
The Indicator is fully customizable.
The use can change the color of the engulfing candles, the color of the zones, transparency etc. You can turn OFF or ON any of the features such as lines, zones, bar coloring, and plotted arrows.
I really hope you get value from this indicator and... HAPPY TRADING!!

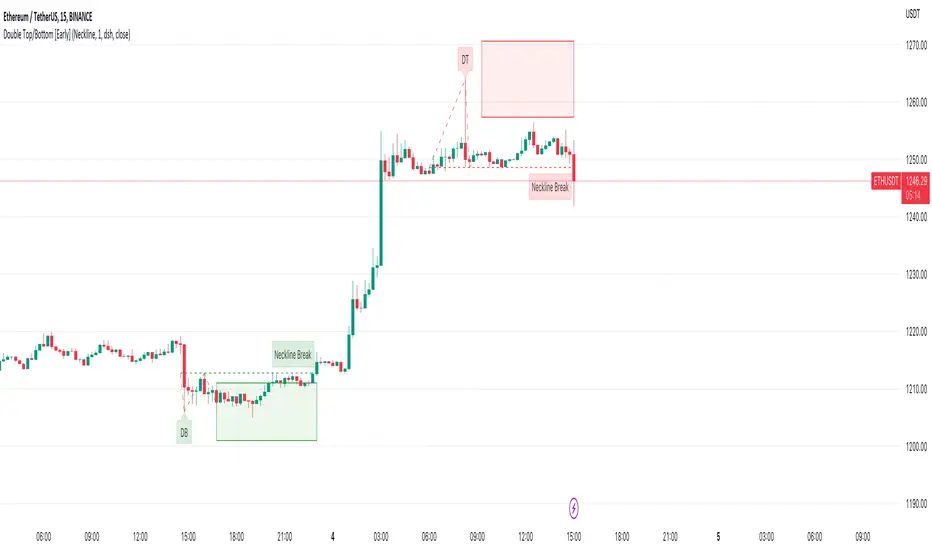
Double Top/Bottom [Early]Early Double Top & Bottoms
This script will scan pivot highs/lows as well as the macro highs/lows to determine whether it thinks there could be a potential double top or double bottom.
This does not mean there definitely will be but the indicator from this point will display the proposed pattern and set out a box where you could look for reversal signals.
The simple premise is rather than having to wait like most pattern scripts this will identify the pattern much sooner and set you up so you can decide how you would like to take action.
Settings
You have the option to choose what type of alert you would like to receive, one option is for an alert soon as the pattern is detected, the 2nd is for when price break the neckline.
below in the settings you have an option to determine what classifies a break. Either the price has to close over the neckline or it can be just a wick, up to you.
You can change all colours of the patterns, labels and line styles.
There are extra labels which can help explain when the pattern is spotted or point out when the neckline is broken depending on your choices
You can also change the frequency in which the patterns will be spotted where 1 is the lowest. We currently believe that 1 spots enough patterns however if you want more feel free to change this.
Use Cases
One is to simply try DCA into the Box if the DB / DT lines up with your support or resistance,.
Another way you can use this on the neckline breaks to confirm the pattern, in the settings you have an option to decide whether you want the close or the wick to trigger the neckline break.
Thirdly, one which we have had the most success with is lining the box plays up with divergence signals.
Feel free to leave any suggestions, happy for the feedback!
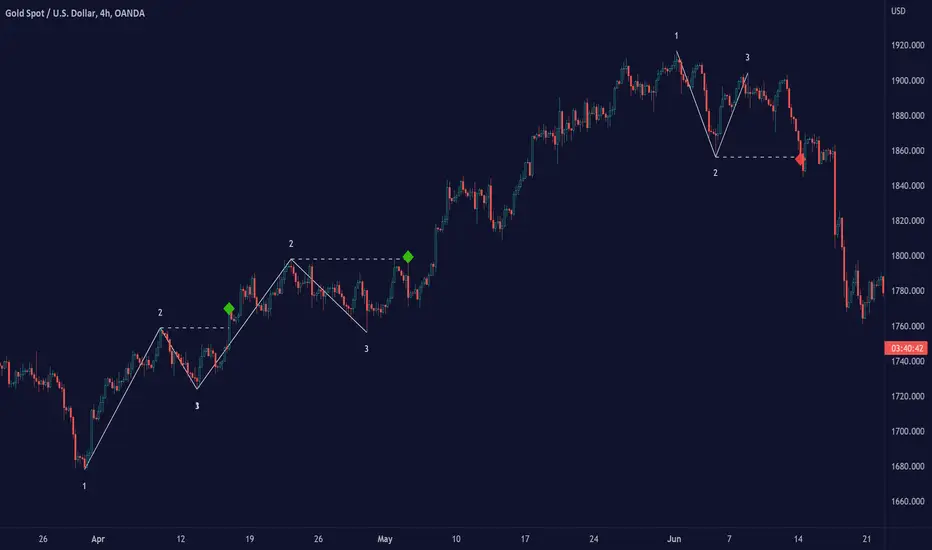
1-2-3 Pattern (Expo)█ Overview
The 1-2-3 pattern is the most basic and important formation in the market. Almost every great market move has started with this formation. That is why you must use this pattern to detect the next big trend. In fact, every trader has used the 1-2-3 formation to detect a trend change without realizing it.
Our 1-2-3 Pattern (Expo) indicator helps traders quickly identify the 1-2-3 Reversal Pattern automatically. By analyzing the price action data, the indicator shows the pattern in real-time. When the pattern is discovered, the 1-2-3 Pattern (Expo) Indicator notifies you via its built-in alert feature! Catching the upcoming big move can't be that much simpler.
█ How to use
The 1-2-3 pattern is used to spot trend reversals. The pattern indicates that a trend is coming to an end and a new one is forming.
-----------------
Disclaimer
The information contained in my Scripts/Indicators/Ideas/Algos/Systems does not constitute financial advice or a solicitation to buy or sell any securities of any type. I will not accept liability for any loss or damage, including without limitation any loss of profit, which may arise directly or indirectly from the use of or reliance on such information.
All investments involve risk, and the past performance of a security, industry, sector, market, financial product, trading strategy, backtest, or individual's trading does not guarantee future results or returns. Investors are fully responsible for any investment decisions they make. Such decisions should be based solely on an evaluation of their financial circumstances, investment objectives, risk tolerance, and liquidity needs.
My Scripts/Indicators/Ideas/Algos/Systems are only for educational purposes!
FunctionPatternFrequencyLibrary "FunctionPatternFrequency"
Counts the word or integer number pattern frequency on a array.
reference:
rosettacode.org
count(pattern)
counts the number a pattern is repeated.
Parameters:
pattern : : array : array with patterns to be counted.
Returns:
array : list of unique patterns.
array : list of counters per pattern.
usage:
count(array.from('a','b','c','a','b','a'))
count(pattern)
counts the number a pattern is repeated.
Parameters:
pattern : : array : array with patterns to be counted.
Returns:
array : list of unique patterns.
array : list of counters per pattern.
usage:
count(array.from(1,2,3,1,2,1))

FunctionDynamicTimeWarpingLibrary "FunctionDynamicTimeWarping"
"In time series analysis, dynamic time warping (DTW) is an algorithm for
measuring similarity between two temporal sequences, which may vary in
speed. For instance, similarities in walking could be detected using DTW,
even if one person was walking faster than the other, or if there were
accelerations and decelerations during the course of an observation.
DTW has been applied to temporal sequences of video, audio, and graphics
data — indeed, any data that can be turned into a linear sequence can be
analyzed with DTW. A well-known application has been automatic speech
recognition, to cope with different speaking speeds. Other applications
include speaker recognition and online signature recognition.
It can also be used in partial shape matching applications."
"Dynamic time warping is used in finance and econometrics to assess the
quality of the prediction versus real-world data."
~~ wikipedia
reference:
en.wikipedia.org
towardsdatascience.com
github.com
cost_matrix(a, b, w)
Dynamic Time Warping procedure.
Parameters:
a : array, data series.
b : array, data series.
w : int , minimum window size.
Returns: matrix optimum match matrix.
traceback(M)
perform a backtrace on the cost matrix and retrieve optimal paths and cost between arrays.
Parameters:
M : matrix, cost matrix.
Returns: tuple:
array aligned 1st array of indices.
array aligned 2nd array of indices.
float final cost.
reference:
github.com
report(a, b, w)
report ordered arrays, cost and cost matrix.
Parameters:
a : array, data series.
b : array, data series.
w : int , minimum window size.
Returns: string report.

Fake breakHi Traders,
I've developed an indicator which can detect fake-breaks on the chart.
In the following you'll find the definition of the fake break candles and also you will find how to recognize it on the chart with practical examples.
What is the fake break pattern?
Sometimes support and resistance lines broke with a full body and strong candles that gives us the idea of sharp movements on the chart but suddenly the next candle returns all the path of the previous candle. in this case we can say fake break is happening on the chart.
This indicator detect fake break patterns based on two criteria:
1. It uses AverageTrueRange indicator to measure the strength of the pattern.
2. The returning candle should engulf minimum 75% of the break candle.
This indicator plot 2 terms in the name of "FB-D" and "FB-U" that are abbreviations of the "Fake Break Down" and "Fake Break Up".
You can also set alerts to get notified when fake breakout happens on the chart.
Notice: This pattern is only acceptable in valid support and resistance zones and you can not rely on it everywhere on the chart (specially in the middle of the waves).
Notice: The source code of this indicator is open and you are allowed to use it on your scripts by mentioning the name of author.
Disclaimer: This is not a financial advice or any signal to buy or sell, the goal of developing such an indicator is to use for educational purposes.

VWAP/EMA50/EMA200We script this one for combining VWAP , EMA50 and EMA200. The tool is fantastic if traders know how VWAP , EMA work? Just adding this script in your favorite and work like charm:
VWAP: How to trade with that
- One of the simplest uses of the VWAP is gauging support and/or resistance.
- A trader who is long a stock can use the VWAP as a target exit if its trading below.
- A stock trading over intraday VWAP may be bullish , while a stock trading under may be bearish .
EMA 50/EMA200: How to trade with that timeframe 50-day or 200-day period
- Identify the trend of market in longterm
- Golden-cross (short term EMA cross above longterm EMA ) is call golden-cross signals. It is opportunity for buying.
- Deal-cross ( short term EMA cross below longterm EMA ) is call dead-cross signals. It is opportunity for selling.
- Identify support levels
- Identify resistance levels
Let me know if you see anything else that should be added/changed.

Fibonacci Timing PatternThe Fibonacci Timing Pattern is a price-based counter that seeks to determine short-term and medium-term reversals in price action. It is based on the following set of conditions:
* For a bullish Fibonacci timing signal: The market must shape 8 consecutive close prices where each close price is lower than the close prices from 3 and 5 periods ago.
* For a bearish Fibonacci timing signal: The market must shape 8 consecutive close prices where each close price is higher than the close prices from 3 and 5 periods ago.
The signals of the pattern are ideally used in a sideways market or used in tandem with the trend (bullish signals are taken in a bullish market and bearish signals are taken in a bearish market).

K's Reversal Indicator IK's reversal indicator I is a special combination between Bollinger bands and the MACD oscillator. It is a contrarian indicator that depends on the following conditions:
• A buy signal is generated whenever the current market price is below the 100-period lower Bollinger band while simultaneously, the MACD value must be above its signal line. At the same time, the previous MACD value must be below its previous signal line.
• A sell (short) signal is generated whenever the current market price is above the 100-period upper Bollinger band while simultaneously, the MACD value must be below its signal line. At the same time, the previous MACD value must be above its previous signal line.
The way to use K's reversal indicator is to combine it with your already long/short bias in a sideways/range market in order to maximize the probability of success.
Limitations of the indicator include the following:
• There are no clear exit rules that work well on average across the markets. Even though K’s reversal indicator gives contrarian signals, it does not show when to exit the positions.
• As with other indicators, it underperforms on some markets and is not to be used everywhere.
• False signals tend to occur during trending markets but there is no proven way to detect a false signal.

SpyGuyTrendTrackerWorking on official documentation at the moment!
As soon as I have that ready I will update this description to incorporate that information.
Basic knowledge:
The clouds are differentiated by EMA lengths and distortion values
Yellow: Short Term
Red: Mid Term
Blue Long Term
I will get finalized documentation ASAP, until then, have fun backtesting and creating your own strategies / ideas while using this indicator!

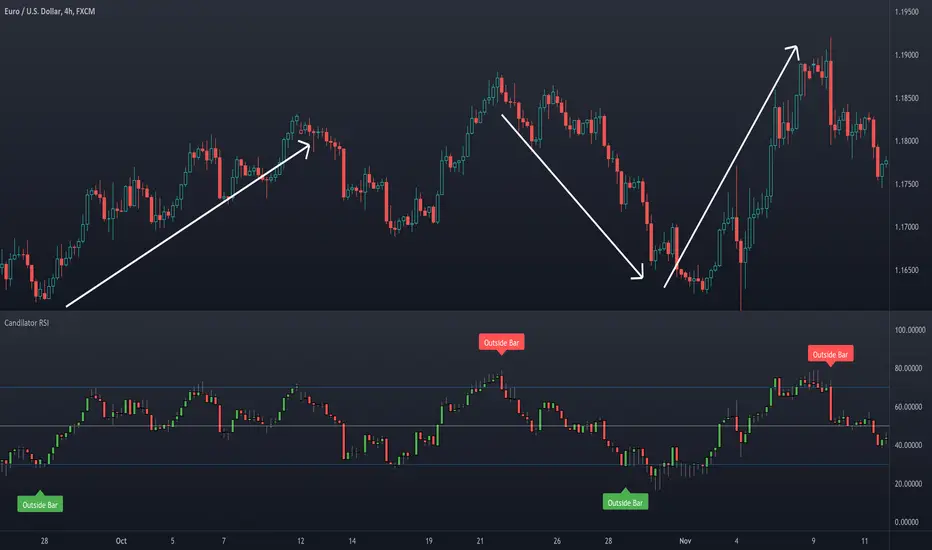
Candilator RSI [AstrideUnicorn]OVERVIEW
The name Candilator comes from blending the words "candlestick" and "oscillator". And as the name suggests, this indicator is a good old RSI plotted as a candlestick chart. To produce a candlestick chart, Candilator RSI calculates four RSI's based on the open, high, low, and close time series. It also has a candlestick patterns detection feature.
HOW TO USE
You can use Candilator RSI as a normal RSI to analyze momentum, detect overbought and oversold markets, and find the oscillator's divergences with the price. You can also get creative and apply all sorts of technical analysis to the RSI candlestick chart, including candlestick patterns analysis.
Candilator RSI can automatically scan the price for some candlestick patterns in the overbought and oversold zones. This feature can help detect price reversals early.
SETTINGS
The indicator settings are divided into two groups: Main Settings and Pattern Detection. In the Main Settings, you can find standard RSI settings. In the Pattern Detection part, you can turn on and off the automatic search for a particular candlestick pattern.
FunctionPatternDecompositionLibrary "FunctionPatternDecomposition"
Methods for decomposing price into common grid/matrix patterns.
series_to_array(source, length) Helper for converting series to array.
Parameters:
source : float, data series.
length : int, size.
Returns: float array.
smooth_data_2d(data, rate) Smooth data sample into 2d points.
Parameters:
data : float array, source data.
rate : float, default=0.25, the rate of smoothness to apply.
Returns: tuple with 2 float arrays.
thin_points(data_x, data_y, rate) Thin the number of points.
Parameters:
data_x : float array, points x value.
data_y : float array, points y value.
rate : float, default=2.0, minimum threshold rate of sample stdev to accept points.
Returns: tuple with 2 float arrays.
extract_point_direction(data_x, data_y) Extract the direction each point faces.
Parameters:
data_x : float array, points x value.
data_y : float array, points y value.
Returns: float array.
find_corners(data_x, data_y, rate) ...
Parameters:
data_x : float array, points x value.
data_y : float array, points y value.
rate : float, minimum threshold rate of data y stdev.
Returns: tuple with 2 float arrays.
grid_coordinates(data_x, data_y, m_size) transforms points data to a constrained sized matrix format.
Parameters:
data_x : float array, points x value.
data_y : float array, points y value.
m_size : int, default=10, size of the matrix.
Returns: flat 2d pseudo matrix.

Manual Backtest - Flat the ChartThis script is an utility tool for manual backtesting.
The main problem in backtesting a discretionary strategy is the bias of knowing the future result of the market, in this way all the market will be crushed into a flat line, this way you can avoid bias.
The way to use this indicator is easy and made by 4 step:
Step 1 : add to an asset you won't backtest and put the auto scale on
Step 2 : go to the asset you will backtest and scroll left until the date you want to start
Step 3 : use the replay function of tradingview (15 min chart won't go back more than 18 month)
Step 4: toggle off the indicator or remove from the chart (untill next asset to backtest)
That's not a complex indicator but is what you need to do a fair backtesting
