Trend #2 - BB+EMAWhat is the Trend #2 - BB+EMA?
This strategy uses a combination of Bollinger Bands and Exponential Moving Averages, and adds the position management skills.
When a position is established, if the price moves in the wrong direction, EMA will move the stop price closer to the opening price, which will reduce losses during the shocks.
If the price moves in the right direction, EMA will be close to the latest price to try to keep the profit.
Once a trend starts to emerge, the strategy is bound to capture the opportunity. I think this is a very smart way to do it.
This strategy performs well in almost all cryptocurrencies, it's mean the strategy has good generalizability.
Stop dan Berbalik Parabolik / Parabolic Stop and Reverse (PSAR)

BT-SAR Ema, Squeeze, Volatility
Esse script foi criado para estudo de Backtest.
Ele usa o SAR PARABÓLICO como indicador de sinal de entrada, você também pode combinar 3 indicadores para filtrar as entradas: Média Móvel, Squeeze Momentum e Volatility Oscilator .
Existe duas entradas, quando o SAR Parabólico vira ou pelo Breakout (usando o último preço) do SAR Parabólico antes dele virar.
As Os filtros podem ser usados de forma combinada ou individual.
O Script também pode ser usado com algum serviço de bot como 3commas.io, basta colocar as mensagens de entrada e saída para o bot.
This script was created for Backtest study.
It uses PARABOLIC SAR as input signal indicator, you can also combine 3 indicators to filter inputs: Moving Average, Squeeze Momentum and Volatility Oscillator .
There are two entries, when the Parabolic SAR turns or by Breakout (using the last price) of the Parabolic SAR before it turns.
The Filters can be used in combination or individually.
The Script can also be used with some bot service like 3commas.io, just put the input and output messages to the bot.

Ultimate Custom MTF ScreenerThis indicator will allow you to make your custom TradingView MTF screener without coding. Add it to the chart, select up to 10 instruments, 4 timeframes, and 4 indicators, and the screener will do the rest for you. The indicator will form a lovely table with all values and highlighted signals.
The screener is highly customizable, and you can choose its position on the chart, sorting, order of the columns, and colors for the tables. You can easily change parameters for all supported indicators and their signals.
Currently, there are 21 different custom indicators available. Current list of indicators:
Average Directional Index (ADX) - displaying the value of ADX and checking if it's higher than the threshold
Average True Range (ATR) - showing the value of ATR
Awesome Oscillator (AO) - displaying the value of AO and highlighting positive/negative values.
Bollinger Bands (BB) - showing if the price is above/below/in the channel.
Breakout Pivots - Displaying when the price is below/above the most recent pivot low/high.
Commodity Channel Index (CCI) - shows the last CCI value and highlights overbought/oversold values.
Directional Movement Index (DMI) - Up/Down signal (+DI above or below -DI)
Donchian Channel (DC) - showing if the price is above/below/in the channel.
Heikin Ashi Count (HAC) - What is the current Heikin Ashi candle color and for how long was this color?
Historical Volatility (HV) - Current value of Historical Volatility
Keltner Channel (KC) -showing if the price is above/below/in the channel.
Moving Average Convergence Divergence (MACD) - Up/Down signal (MACD above / below signal)
Moving Average Crossover (MA Cross) - Displaying MA crosses signals (SMA, EMA, WMA, HMA, VWMA, SMMA, DEMA, VWAP supported)
Moving Average Distance (MA DIST) - Displaying distance to the MA (SMA, EMA, WMA, HMA, VWMA, SMMA, DEMA, VWAP supported)
Parabolic Stop and Reverse (PSAR) - Up or Down
Relative Strength Index (RSI) - Displaying the last RSI value and highlighting overbought/oversold values.
Stochastic (STOCH) - Displaying the last Stochastic value and highlighting overbought/oversold values.
Stochastic RSI (STOCH RSI) - Displaying the last Stochastic RSI value and highlighting overbought/oversold values.
SuperTrend - Current state of the SuperTrend.
Trailing Stop-Loss (TSL) - Up or Down
True Strength Index (TSI) - Displaying the last TSI value and highlighting overbought/oversold values.
We're already working on adding a few more supported indicators. If you have any ideas about the indicators you want to see in our screener, contact us, and we'll consider them.
Disclaimer
Please remember that past performance may not be indicative of future results.
Due to various factors, including changing market conditions, the strategy may no longer perform as well as in historical backtesting.
This post and the script don’t provide any financial advice.

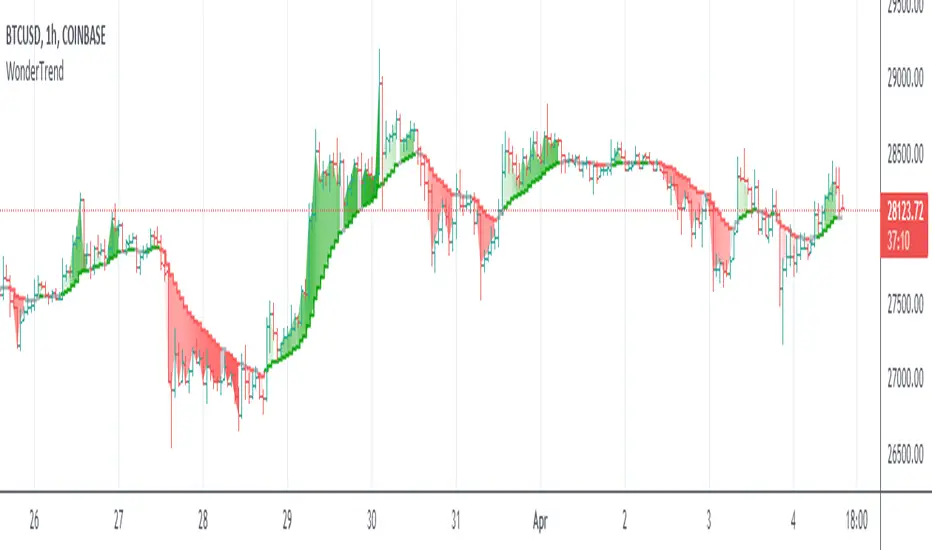
WonderTrend IndicatorDetermining trends and reversals are the keys to trading, yet very difficult. Parabolic SAR is hard to trade during choppy price action. SuperTrend is a bit late in determining changes of trend and not great and exit signals.
So WonderTrend is a bit of both, a more stubborn PSAR, also a faster SuperTrend. The green is up, red is down, and yellow is caution helps traders read the chart patterns to enter and exit.
Enjoy!
Parabolic SAR Oscillator [LuxAlgo]This indicator is a detrended price series using the Parabolic Stop and Reverse (SAR) trailing stop, resulting in a bounded oscillator in the range (-100, 100). The SAR output is also normalized to obtain a noiseless oscillator which can complement the detrended price.
Settings
Start: Initial value of the convergence factor used when a new trend is detected by the SAR
Increment: Increment value of the convergence factor
Maximum: Maximum value of the convergence factor
Usage
The price is detrended by subtracting the closing price to the SAR, this result is then normalized.
An up-trending market is indicated once the normalized SAR reaches -100, while a value of 100 indicates a down-trending market. One can anticipate trends when the normalized SAR crosses above/under 0.
The converging nature of the SAR trailing stop allows for the trader to obtain a very apparent leading oscillator.

Market First - Relative Strength/Weakness (the ZenBot strategy)This market-first trading strategy gives BUY, SHORT, and CLOSE signals based on volume, trend, and relative strength or weakness to the market (SPY by default, can be customized). This indicator is useful for signaling day-trade entries and exits for tickers that are strong (or weak) against the market.
Stocks that are showing relative strength (or weakness) to the market, are trending, and have decent movement generate a buy (or short) signal. When the trend runs out, a CLOSE signal is fired.
Potential profit (based on ATR) and actual profit is calculated, predicting the type of move expected
Unique 'stay in trade' logic helps prevent unnecessary CLOSE signals if a trend is likely to continue
A colored plot indicates the strength of the current trend and turns orange/red when the strength is weakened.
Crypto traders can uncheck 'Trade during market hours' for 24-hour trading, and should change the comparison ticker from SPY to BTCUSD or something similar for their market.
Enjoy!
KEY CONCEPTS
The three- and five-minute timeframes are used to establish and verify trend ( ADX /DI with custom logic)
Entries and exits are based on Parabolic SAR and confirmed on multiple timeframes, trend, and relative volume
Relative strength /weakness to the market compares ticker to SPY
Chop is avoided at all costs. I've experimented with choppiness indicator below 38, but found that the ADX DI+/- readings work even better.
Trend is established using ADX DI+/- readings over 20, confirmed by EMA 5/13 crossover and EMA5 slope
Signals will fire only if the average volume for the current 5-min bar is above normal
Only tickers with a five-bar / 13 period ATR of 1% the ticker's price generate signal.
Only longs above daily-anchored VWAP , shorts below daily-anchored VWAP
Signals fire on bar close to prevent repainting / look-ahead bias
Indicator labels and alerts generated
SIGNALS
BUY: up-trending tickers showing relative strength are bought on the three-minute PSAR
SELL: when the close price falls below the 1, 3, and 5-minute PSAR, or the ADX DI- falls below 20
SHORT: down-trending tickers with relative weakness are shorted on the three-minute PSAR
COVER: when the close price moves above the 1, 3, and 5-minute PSAR, or the ADX DI- falls below 20
ALERTS
Alerts are generated on BUY, SELL, SHORT, and COVER signals, as well as optional LOST RELATIVE STRENGTH and LOST RELATIVE WEAKNESS
INPUTS
Use relative strength /weakness comparison with the market : trigger trades based on the ticker's strength or weakness to the selected comparison ticker (usually SPY for equities or BTCUSD for crypto)
[* ]Comparison Ticker for relative strength /weakness : Ticker to compare against for relative strength /weakness
Trade during market hours only : Take buy/sells during specified hours. Disable this for crypto trading.
[* ]Market hours (market time) : Customize market hours - defaults to 9:30 to 16:00 EST
[* ]"Only trade very strong trends" : take trades only if an established trend is very strong ( ADX over 40 ) (DEFAULT = ON)
"Limit trade direction to VWAP" : Long trades only above VWAP , shorts below (DEFAULT = ON)
"Limit trade direction to Market direction" : Long trades only if SPY (or selected comparison ticker) is up, shorts if the market is down. (DEFAULT= ON)
"Limit trades based on a ticker's green/red status for the day" : Long trades if the ticker is green for the day, shorts if red. (DEFAULT = ON)

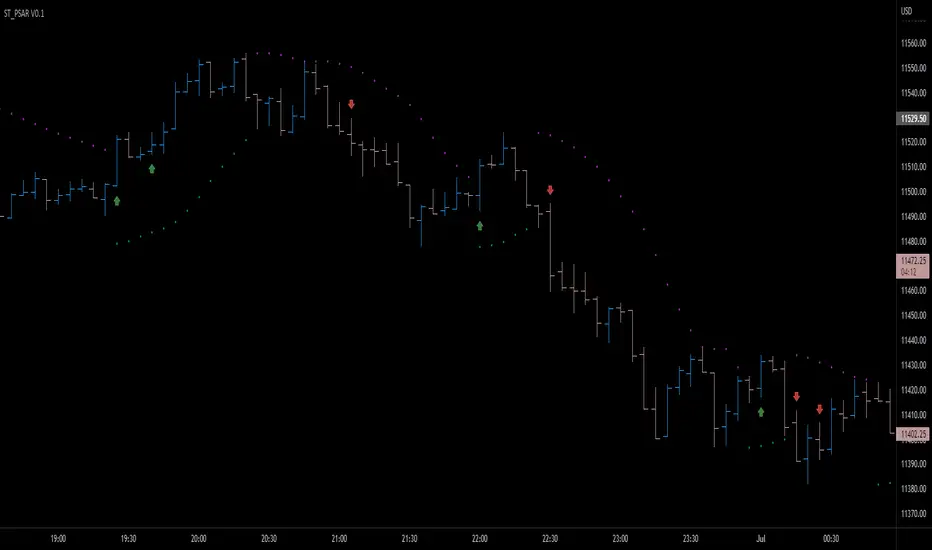
Parabolic SAR breakout [SugarTrader77]Parabolic SAR with:
- On chart visuals
- Alarms
to notify when price breaks up/down the SAR flipping point level
Created only for community testing only. Trade at your own risk.
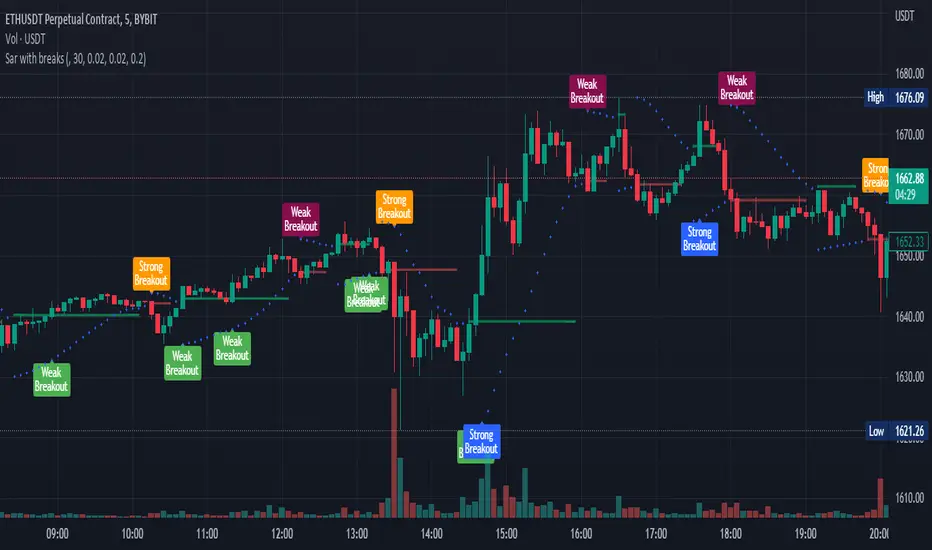
Parabolic sar with breaksThis plots a Parabolic sar and a break line on the previous sar point before the parabolic sar flips.
This is looking to be a very popular entry signal for lots of strats.
How to use:
In conjunction with other confirmation indicators;
Long : Enter long when the Parabolic sar is below the price and the price breaks above (and closes) the break line.
Short : Enter short when the Parabolic sar is above the price and the price breaks below (and closes) the break line.
A great indicator combination for this is to use a 200 ema for price trend and volume flow.
Adaptive Parabolic SAR (PSAR) [Loxx]Adaptive Parabolic SAR (PSAR) is an advanced Parabolic SAR with adaptive adjustments using either a Kaufman or an Ehlers smoothing algorithms.
What is the Parabolic SAR?
The parabolic SAR attempts to give traders an edge by highlighting the direction an asset is moving, as well as providing entry and exit points. In this article, we'll look at the basics of this indicator and show you how you can incorporate it into your trading strategy. We'll also look at some of the drawbacks of the indicator.
The parabolic SAR is a technical indicator used to determine the price direction of an asset, as well as draw attention to when the price direction is changing. Sometimes known as the "stop and reversal system," the parabolic SAR was developed by J. Welles Wilder Jr., creator of the relative strength index (RSI).1
On a chart, the indicator appears as a series of dots placed either above or below the price bars. A dot below the price is deemed to be a bullish signal. Conversely, a dot above the price is used to illustrate that the bears are in control and that the momentum is likely to remain downward. When the dots flip, it indicates that a potential change in price direction is under way. For example, if the dots are above the price, when they flip below the price, it could signal a further rise in price.
Additional Options
Toggle signals on/off
HiLo mode
Kaufman adaptive, Ehlers adaptive, or non adaptive
Filter by Pips
Minimum Change by Pips
Color bars
Enjoy!
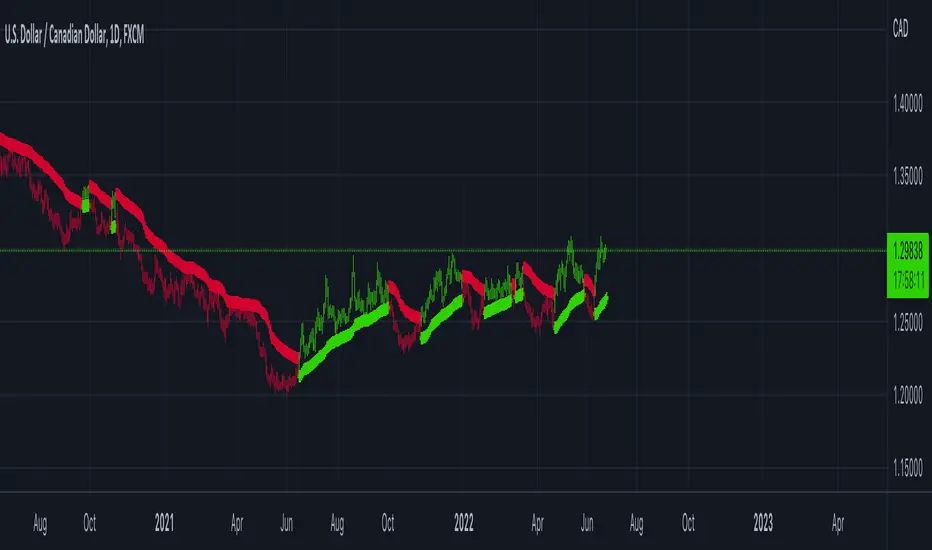
Parabolic SAR with the ADX overlayThe following indicator and chart pattern is based on a twist from Welles Wilder's parabolic stop and reverse . This is a trend following system which is essentially a dynamic trailing stop loss for longs and shorts. The system is often criticized for it's poor performance in choppy rangebound markets so people often combine it with other signals that attempt to identify a "trend" the ADX is a popular indicator with three indicators, the DI+ "Positive Directional Indicator" the DI- "Negative Directional Indicator" and then a combination of the two, the ADX "Average Directional Indicator". Generally speaking, if the DI+ is above the DI- and the ADX is greater than 25 then we are in a positive trending market. If the DI+ is less than the DI- and the ADX is greater than 25 then we are in a negative trending market. If the ADX is less than 25 then there is no trend in place and we are in a range bound "choppy market".
So, I created this chart to show when the ADX is > 25 (or you can enter your own number) and the DI+ is > DI- then the background will be green. Vice versa, when the ADX is >25 and the DI+ is < DI- then we are in a negative trending market and the background color will be red. If the ADX is < 25 (or whatever you choose) then we are in a choppy 'range-bound" market.
Regarding the ParSAR. Pay attention to the "+" marks. they indicate whether we are bullish or bearish. When we cross through a + then we revert to the opposite. "Stop And Reverse". They are a simple calculation of a starting percentage, an incremental increase in that percentage, and a max percentage increase. If you want your system to trade less, decrease the "maximum" If you want it to trade more, increase the maximum.
Tinker around with these and you might find a healthy strategy you can trade on.
If you add Take Profit Targets and Stop Loss Targets, this is an even more productive strategy. Try it out on BINANCE:ETHUSDT with a 2hr time horizon and 0.02, 0.023, 0.2.

Parabolic SAR of KAMA [Loxx]Parabolic SAR of KAMA attempts to reduce noise and volatility from regular Parabolic SAR in order to derive more accurate trends. In addition, and to further reduce noise and enhance trend identification, PSAR of KAMA includes two calculations of efficiency ratio: 1) price change adjusted for the daily volatility; or, 2) Jurik Fractal Dimension Adaptive (explained below)
What is PSAR?
The parabolic SAR indicator, developed by J. Wells Wilder, is used by traders to determine trend direction and potential reversals in price. The indicator uses a trailing stop and reverse method called "SAR," or stop and reverse, to identify suitable exit and entry points. Traders also refer to the indicator as to the parabolic stop and reverse, parabolic SAR, or PSAR.
What is KAMA?
Developed by Perry Kaufman, Kaufman's Adaptive Moving Average (KAMA) is a moving average designed to account for market noise or volatility. KAMA will closely follow prices when the price swings are relatively small and the noise is low. KAMA will adjust when the price swings widen and follow prices from a greater distance. This trend-following indicator can be used to identify the overall trend, time turning points and filter price movements.
What is the efficiency ratio?
In statistical terms, the Efficiency Ratio tells us the fractal efficiency of price changes. ER fluctuates between 1 and 0, but these extremes are the exception, not the norm. ER would be 1 if prices moved up 10 consecutive periods or down 10 consecutive periods. ER would be zero if price is unchanged over the 10 periods.
What is Jurik Fractal Dimension?
There is a weak and a strong way to measure the random quality of a time series.
The weak way is to use the random walk index (RWI). You can download it from the Omega web site. It makes the assumption that the market is moving randomly with an average distance D per move and proposes an amount the market should have changed over N bars of time. If the market has traveled less, then the action is considered random, otherwise it's considered trending.
The problem with this method is that taking the average distance is valid for a Normal (Gaussian) distribution of price activity. However, price action is rarely Normal, with large price jumps occuring much more frequently than a Normal distribution would expect. Consequently, big jumps throw the RWI way off, producing invalid results.
The strong way is to not make any assumption regarding the distribution of price changes and, instead, measure the fractal dimension of the time series. Fractal Dimension requires a lot of data to be accurate. If you are trading 30 minute bars, use a multi-chart where this indicator is running on 5 minute bars and you are trading on 30 minute bars.
Conclusion from the combined efforts explained above:
-PSAR is a tool that identifies trends
-To reduce noise and identify trends during periods of low volatility, we calculate a PSAR on KAMA
-To enhance noise and reduction and trend identification, we attempt to derive an efficiency ratio that is less reliant on a Normal (Gaussian) distribution of price
Included:
-Customization of all variables
-Select from two different ER calculation styles
-Multiple timeframe enabled

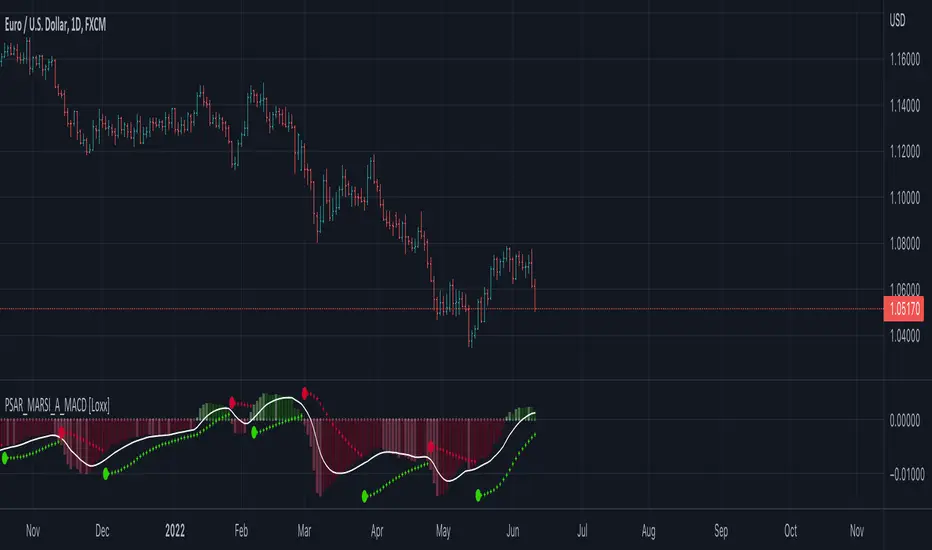
Parabolic SAR MARSI, Adaptive MACD [Loxx]Parabolic SAR MARSI, Adaptive MACD is a trend following indicator that combines MACD, Parabolic SAR, and RSI into a signal indicator.
What is Parabolic SAR?
The parabolic stop and reverse, more commonly known as the "Parabolic SAR," or "PSAR" is a trend-following indicator developed by J. Welles Wilder. It is displayed as a single parabolic line (or dots) underneath the price bars in an uptrend, and above the price bars in a downtrend.
What is MACD?
Moving average convergence divergence (MACD) is a trend-following momentum indicator that shows the relationship between two moving averages of a security’s price. The MACD is calculated by subtracting the 26-period exponential moving average (EMA) from the 12-period EMA.
What is RSI?
The relative strength index (RSI) is a momentum indicator used in technical analysis that measures the magnitude of recent price changes to evaluate overbought or oversold conditions in the price of a stock or other asset. The RSI is displayed as an oscillator (a line graph that moves between two extremes) and can have a reading from 0 to 100. The indicator was originally developed by J. Welles Wilder Jr. and introduced in his seminal 1978 book, “New Concepts in Technical Trading Systems.”
How to combine PSAR, MACD, and RSI into one:
1. Create a new type of moving average called MARSI. MARSI is like a typical moving average but it flexes to RSI sensitivities
2. Calculate MACD for the MARSI of High/Low values
3. Calculate the midpoint MACD between the High/Low MACDs created in step 2
4. Create a final MACD by calculating the MARSI for the midpoint MACD created in step 3
5. Finally, Inject these values into a customized Parabolic SAR function
Results:
-A unique spin on three different indicators that identifies trends of both RSI, MACD, and price of the underlying asset
-Entry, exit, and reversal points in price, RSI, and MACD
-A MACD that adapts to RSI
What's Included?
-Customization of all variables
-A variety of moving averages to smooth the signal line
-Customizable colors
-Alerts for MACD zero-line and signal crosses, and PSAR trend direction changes
Things to know:
-The histogram in this indicator is NOT the normal histogram found in the classic MACD indicator. The histogram here is a histogram of MACD itself. The classic histogram has questionable utility but the histogram in this indicator is very important and useful
-Parabolic SAR is calculated on the MARSI of High/Low values
Future releases:
-Divergences
-Regular, continuation, and exit signals
Happy trading!
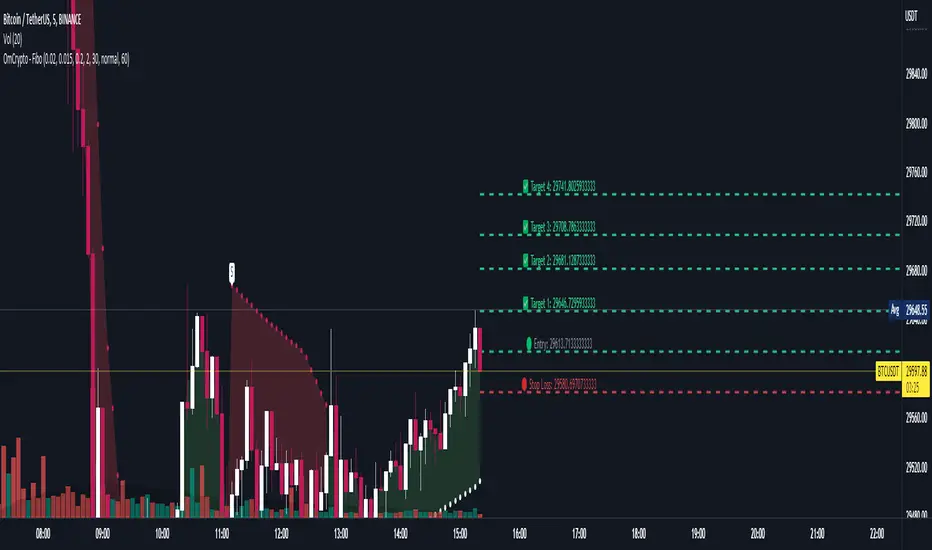
OmCrypto - PSAR with TargetOmCrypto - PSAR with Target
This script uses PSAR as it's main buy and sell signal with automatic target to take profit, entry and stop loss
It also supports alert so you can use it for bots
You can set your own period (timeframe) for the target lines in settings, default is 60 minutes (1h)
parabolic sar with ema and rsi, this strategy includes 3 free trading view indicators, with HIGH ken ashee candles , now lets go ahead and add them to our chart ,
the 1st indicator is parabolic saarr and the 2nd indicator is E M A , and the final one is R S I , and we have to change some settings , change this E M A length from 9 to 200 ,
and change some settings on R S I indicator , so lets remove all options except for , the R S I , and the R S I middle band , and parabolic saarr on default sittings , now our strategy is ready , lets go into trading rules .
for a long signal to be valid , the price must be above 200 E M A ,with NEW buy signal from parabolic saarr, if , R S I above the middle 50 line
for a short signal to be valid , the price must be below 200 E M A , with NEW SELL signal from parabolic saarr ,if ,R S I BELOW 50 line
now we can go ahead and take a SHORT position
our stoploss must be above the recent higher high
and the risk to reward ratio will be 2

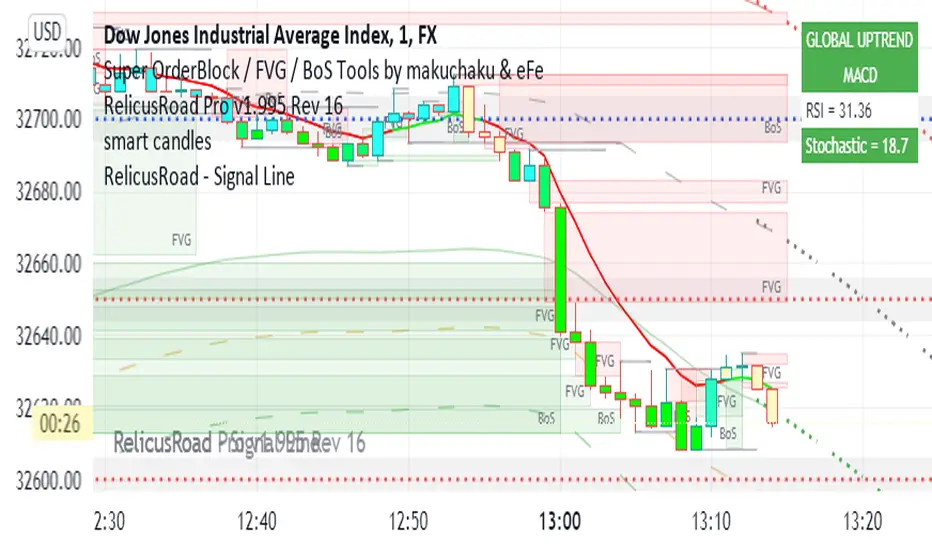
RelicusRoad - Signal LineWhen you have charts full of too many indicators, it can mess up with your analysis and cause analysis paralysis. Use RelicusRoad Signal Line to simply your charts with a beautiful color changing moving average line as per the strategies selected.
4 different strategies to choose from:
1) MACD
2) PMACD (Price Action + MACD)
3) Parabolic SAR
4) Momentum
GREEN: BUY ZONE
RED: SELL ZONE
FUNCTIONS OVERVIEW
MACD: Moving average convergence divergence ( MACD ) is a trend-following momentum indicator that shows the relationship between two moving averages of a security’s price. The MACD is calculated by subtracting the 26-period exponential moving average ( EMA ) from the 12-period EMA .
The result of that calculation is the MACD line. A 9 EMA of the MACD called the "signal line," is then plotted on top of the MACD line, which can function as a trigger for buy and sell signals. Traders may buy the security when the MACD crosses above its signal line and sell—or short—the security when the MACD crosses below the signal line. Moving average convergence divergence ( MACD ) indicators can be interpreted in several ways, but the more common methods are crossovers, divergences, and rapid rises/falls.
Moving average convergence divergence ( MACD ) is calculated by subtracting the 26-period exponential moving average ( EMA ) from the 12-period EMA .
MACD triggers technical signals when it crosses above (to buy) or below (to sell) its signal line.
The speed of crossovers is also taken as a signal of a market is overbought or oversold.
MACD helps investors understand whether the bullish or bearish movement in the price is strengthening or weakening.
PMACD: It's an improvement to MACD that you can use the Red/Green indications to make better decisions.
Parabolic SAR: The parabolic SAR indicator, developed by J. Wells Wilder, is used by traders to determine trend direction and potential reversals in price. The indicator uses a trailing stop and reverse method called "SAR," or stop and reverse, to identify suitable exit and entry points. Traders also refer to the indicator as the parabolic stop and reverse , parabolic SAR , or PSAR.
The parabolic SAR indicator appears on a chart as a series of dots, either above or below an asset's price, depending on the direction the price is moving. A dot is placed below the price when it is trending upward, and above the price when it is trending downward.
The parabolic SAR (stop and reverse) indicator is used by technical traders to spot trends and reversals.
The indicator utilizes a system of dots superimposed onto a price chart.
A reversal occurs when these dots flip, but a reversal signal in the SAR does not necessarily mean a reversal in the price. A PSAR reversal only means that the price and indicator have crossed.
Momentum: On paper, momentum investing seems less like an investing strategy and more like a knee-jerk reaction to market information. The idea of selling losers and buying winners is seductive, but it flies in the face of the tried and true Wall Street adage, "buy low, sell high."
Momentum investing is a trading strategy in which investors buy securities that are rising and sell them when they look to have peaked.
The goal is to work with volatility by finding buying opportunities in short-term uptrends and then sell when the securities start to lose momentum.
Then, the investor takes the cash and looks for the next short-term uptrend, or buying opportunity, and repeats the process.
Skilled traders understand when to enter into a position, how long to hold it for, and when to exit; they can also react to short-term, news-driven spikes or selloffs.
Risks of momentum trading include moving into a position too early, closing out too late, and getting distracted and missing key trends and technical deviations.
Parabolic SAR Heikin Ashi MTF Candle ScalperThis is scalper strategy designed around parabolic sar indicator, where as an input candle value it uses the heikinashi from a higher timeframe.
This example has been adapted to SPY/SPX chart
In this case ,we are using a 5 min chart, but the calculations are made on a 15 min heikin ashi chart for the PSAR and then on 5 min chart we plot the results.
At the same time we are conditioning the entry to be base on a time/session for daytrading/scalper mentality
In this case we only enter within the first 30 min of SPY opening session , and then we exit after 3-4 hours of staying in the position ( unless we hit a reverse condition).
For long condition we enter when the mtf ha candle close is above the mtf psar and for short condition we enter when the mtf ha candle close is below the mtf psar
This script is made with an educational purpose to show the power of multiple time frame approach compared to a single chart.
If you have any questions, let me know !

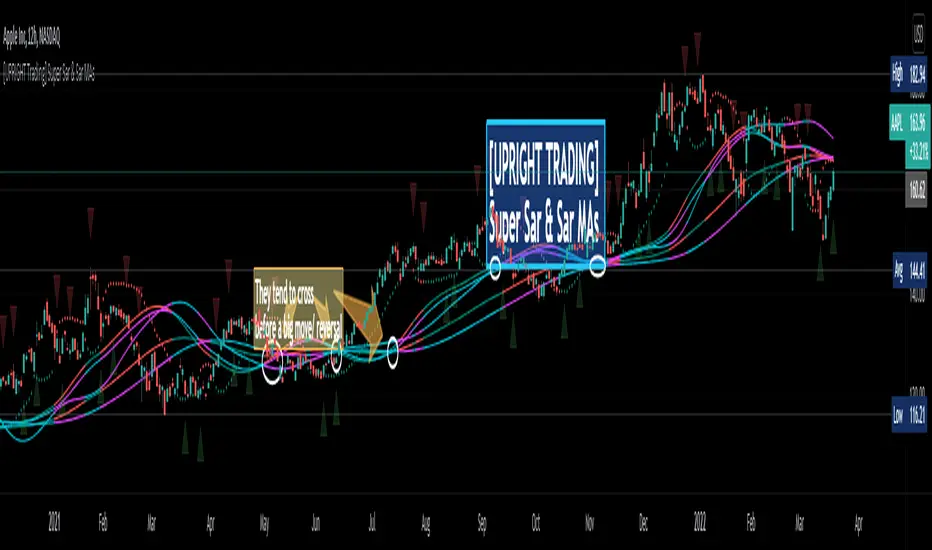
[UPRIGHT Trading] Super Sar & (New) Sar Moving Averages (cc)Hello Traders,
(This is an original creation and a proof of concept.)
As most of you know the PSAR, parabolic SAR indicator, was developed by J. Welles Wilder Jr. and used to determine trend direction and potential reversals in price. This technical indicator uses a trailing stop and reverse method, 'SAR,' or "stop and reverse," to find potential exit and entry points.
My question was: Is it possible to create meaningful Moving Averages by using PSAR?
Turns out, the answer is yes.
As you can see on the above chart, not only is it possible, it does work.
Features:
I've created buy/sell signals, which act as early indication of a potential reversal.
5 original MAs.
My Super Sar
Customizability: For now, the ability to adjust the length and turn on/off the MAs (maybe more features to come).
Enjoy!
As always, please: Like, Follow, Support, etc...
Cheers,
Mike
(UPRIGHT Trading)
Measure Volume, Momentum, Trend, VolatilityThis script displays the following indicators in one pane to quickly determine several important factors regarding price action. It allows the user to quickly see all of most important factors surrounding price action in one pane with one quick glance. This should be incredibly helpful and allow things like double divergence and trend confirmation to be spotted much more quickly. I personally use the data in this indicator to replace four separate indicators and it has brought my win rate and profit factor significantly higher. I hadn't seen any place where all of the best J. Welles Wilder indicators such as RSI, Parabolic SAR, and DMI/ADX were brought into one easy to use interface. This is my attempt at fixing that gap. For a much deeper understanding of how to use these indicators, I recommend reading New Concepts in Technical Trading Systems written by J. Welles Wilder.
Momentum via RSI (Relative Strength Index)
Volume via MFI (Money Flow Index)
Volatility via DMI/ADX (Direction Movement Index/Average Directional Index)
Trend via Parabolic SAR (Parabolic Stop and Reverse)
It is worth noting that DMI/ADX and Parabolic SAR can both help determine trend strength and volatility.
The Volatility mechanism is measured by DMI and ADX and displayed at the top of the pane using circles. The top, tiny circles reflect if show if positive DI or negative DI has a higher value. The small circles directly underneath indicate whether or not the ADX is above 20 (configurable, some may choose to increase this to 25 or even 30).
The Momentum mechanism is shown as standard RSI with the default being a white line and default period of 14, which is all configurable.
The Volume mechanism is shown as standard MFI with the default being a fuchsia line and default period of 14, which is also configurable.
The momentum and volume oscillators should be used in conjunction to help spot whether the trend is strong or weak using divergences and the middle, overbought, and oversold levels. These levels are also configurable.
The Trend mechanism is measured by Parabolic SAR and displayed at the bottom of the pane using diamonds. The default is red diamonds when in a bear trend, green when in an uptrend which is configurable. When price is above the Parabolic SAR, it is considered to be an uptrend. When price is below the Parabolic SAR, it is considered to be a downtrend. The way price is measured is also configurable (i.e. open, close, ohlc4, hlc3, etc.). When price crossed above or below the Parabolic SAR, the diamonds will change colors.
All the indicators displayed should be used in a well rounded strategy. For instance, I only trade when ADX is above 20 and rarely trade against the trend shown via PSAR. When trend shifts and divergences helped indicate a trend shift would occur using the RSI and MFI, it can be a great spot to take an entry. RSI/MFI can also confirm the trend is strong when they are not showing divergences and inline with price action. All of this data should be used in conjunction with good fundamental data and technical levels. Divergences with RSI and MFI on double tops or bottoms can also be incredibly powerful. There is no right or wrong way to use all the data displayed in this indicator, however using all four pillars of trading (Momentum, Volume, Trend, Volatility) will help ensure only the best trades are taken.

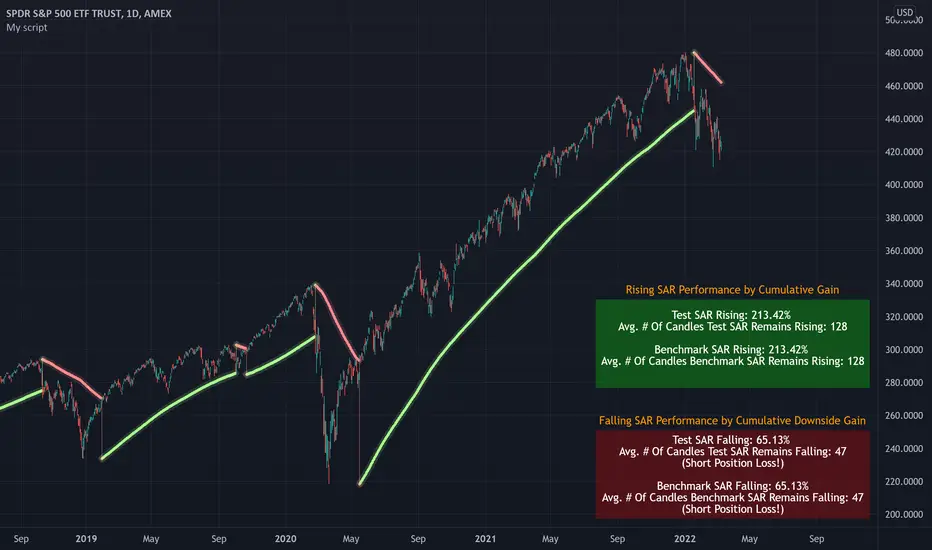
PSAR Optimization ScriptHello!
User @henryph24 suggested I make this script!
This script calculates the cumulative and average gain/Loss of rising SAR following a price crossover of SAR.
The cumulative and average gain/Loss of falling SAR following a price crossunder is also measured.
Changes to the parameters of SAR will return the requisite calculations for evaluating performance.
Benchmark SAR can be used to compare performance against test SAR.
When changing the SAR parameters the script will recalculate and display the rising SAR and falling SAR performance of the modified parameters. The script works for any asset on any timeframe.
Essentially, this script allows you to optimize SAR parameters, and quickly ascertain what can/cannot work for an asset.
The script automatically plots the best performing SAR between a benchmark SAR (SAR #1) and a test SAR (SAR #2). Both benchmark SAR and test SAR works the same. The two are used to compare performance between different SAR parameters. If you would like the script not to plot the best performing SAR you can select "On" for the "Override SAR" input box. Doing so will plot the SAR parameters of your choice while still allowing you to compare the performance of benchmark SAR and test SAR.
There are tooltips available in the user input tab that explain the SAR parameters, in addition to what your modifications of the parameters will do, should you be unfamiliar with the indicator!
Enjoy!
8X Trend ATR SAR Dingue V58X Trend ATR SAR Dingue V5 - This is the updated version for Pine Script 5.
8x indicator into 1 :
2x ATR indicator - 3x Trend indicator - 3x SAR indicator
Trends are helpful to spot reversal and support resistance, especially on bigger time frames.
This indicator gives you a global view of various trends all at once. You can easily turn them On or Off as to not clog the screen.
Each trend is also color-coded to visualize quickly the position of the price compared to it.
You can customize lengths, adjust line sizes, have the start of a new trend marked with a circle, fill in colors.
'Tool tips' explain other settings and if you have any questions, feel free to ask in the comments below.
Thank you for the feedback and check all my ‘Dingue’ indicators.

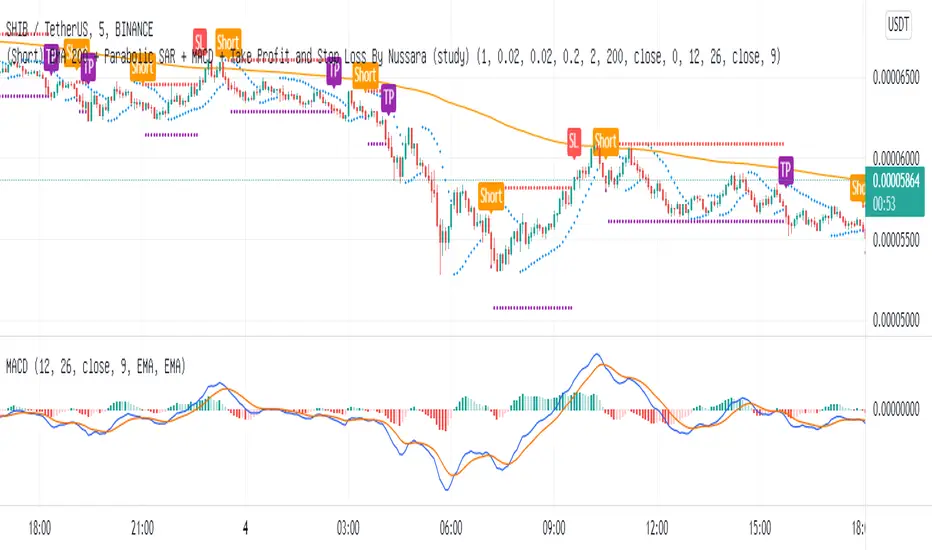
(Short) EMA200+Parabolic SAR+MACD+TP&SL By Nussara (strategy)This indicator is backtest of “ (Short) EMA 200 + Parabolic SAR + MACD + Take Profit and Stop Loss”
You can simulate trading by setting your own funds and trading fees. And you can adjust various parameter settings to get the results you want.
Exponential Moving Average
Moving averages smooth the price data to form a trend following indicator. They do not predict price direction, but rather define the current direction, though they lag due to being based on past prices. Despite this, moving averages help smooth price action and filter out the noise.
EMA=Price(t)×k+EMA(y)×(1−k)
where:
t=today
y=yesterday
N=number of days in EMA
k=2÷(N+1)
Parabolic SAR
The Parabolic SAR is a technical indicator developed by J. Welles Wilder to determine the direction that an asset is moving. The indicator is also referred to as a stop and reverse system, which is abbreviated as SAR . It aims to identify potential reversals in the price movement of traded assets.
MACD
Moving average convergence divergence ( MACD ) is a trend-following momentum indicator that shows the relationship between two moving averages of a security’s price. The MACD is calculated by subtracting the 26-period exponential moving average ( EMA ) from the 12-period EMA . The result of that calculation is the MACD line. A nine-day EMA of the MACD called the "signal line," is then plotted on top of the MACD line, which can function as a trigger for buy and sell signals. Traders may buy the security when the MACD crosses above its signal line and sell—or short—the security when the MACD crosses below the signal line.
EMA 200 + Parabolic SAR + MACD (Short) formula
1. The price closes below the ema200 line.
2. MACD Line cross down Signal Line"
3. Parabolic SAR above the bar means that it is a downtrend.
If all three are true, the indicator will have a Short signal.
Risk to Reward Ratio = 1:1
Stop loss = Parabolic SAR point.
This indicator is just a tool for technical analysis . It shouldn't be used as the only indication of trade because it causes you to lose your money. You should use other indicators to analyze together.

(Short) EMA200 + Parabolic SAR + MACD + TP&SL By Nussara (study)This strategy, I call it “ (Short) EMA 200 + Parabolic SAR + MACD + Take Profit and Stop Loss”
It’s a combination of three strategies: EMA 200, Parabolic SAR , and MACD together
Exponential Moving Average
Moving averages smooth the price data to form a trend following indicator. They do not predict price direction, but rather define the current direction, though they lag due to being based on past prices. Despite this, moving averages help smooth price action and filter out the noise.
EMA=Price(t)×k+EMA(y)×(1−k)
where:
t=today
y=yesterday
N=number of days in EMA
k=2÷(N+1)
Parabolic SAR
The Parabolic SAR is a technical indicator developed by J. Welles Wilder to determine the direction that an asset is moving. The indicator is also referred to as a stop and reverse system, which is abbreviated as SAR . It aims to identify potential reversals in the price movement of traded assets.
MACD
Moving average convergence divergence ( MACD ) is a trend-following momentum indicator that shows the relationship between two moving averages of a security’s price. The MACD is calculated by subtracting the 26-period exponential moving average ( EMA ) from the 12-period EMA . The result of that calculation is the MACD line. A nine-day EMA of the MACD called the "signal line," is then plotted on top of the MACD line, which can function as a trigger for buy and sell signals. Traders may buy the security when the MACD crosses above its signal line and sell—or short—the security when the MACD crosses below the signal line.
EMA 200 + Parabolic SAR + MACD (Short) formula
1. The price closes below the ema200 line.
2. MACD Line cross down Signal Line"
3. Parabolic SAR above the bar means that it is a downtrend.
If all three are true, the indicator will have a Short signal.
Risk to Reward Ratio = 1:1
Stop loss = Parabolic SAR point.
This indicator is just a tool for technical analysis . It shouldn't be used as the only indication of trade because it causes you to lose your money. You should use other indicators to analyze together.
พ.ย. 4
(Long) EMA 200 + Parabolic SAR + MACD By Nussara (strategy)This indicator is backtest of “ (Long) EMA 200 + Parabolic SAR + MACD + Take Profit and Stop Loss”
You can simulate trading by setting your own funds and trading fees. And you can adjust various parameter settings to get the results you want.
Exponential Moving Average
Moving averages smooth the price data to form a trend following indicator. They do not predict price direction, but rather define the current direction, though they lag due to being based on past prices. Despite this, moving averages help smooth price action and filter out the noise.
EMA=Price(t)×k+EMA(y)×(1−k)
where:
t=today
y=yesterday
N=number of days in EMA
k=2÷(N+1)
Parabolic SAR
The Parabolic SAR is a technical indicator developed by J. Welles Wilder to determine the direction that an asset is moving. The indicator is also referred to as a stop and reverse system, which is abbreviated as SAR. It aims to identify potential reversals in the price movement of traded assets.
MACD
Moving average convergence divergence (MACD) is a trend-following momentum indicator that shows the relationship between two moving averages of a security’s price. The MACD is calculated by subtracting the 26-period exponential moving average (EMA) from the 12-period EMA. The result of that calculation is the MACD line. A nine-day EMA of the MACD called the "signal line," is then plotted on top of the MACD line, which can function as a trigger for buy and sell signals. Traders may buy the security when the MACD crosses above its signal line and sell—or short—the security when the MACD crosses below the signal line.
EMA 200 + Parabolic SAR + MACD (Long) formula
1. The price closes above the ema200 line.
2. MACD Line above Signal Line
3. Parabolic SAR below the bar means that it is an uptrend.
If all three are true, the indicator will have a buy signal.
Risk to Reward Ratio = 1:1
Stop loss = Parabolic SAR point.
This indicator is just a tool for technical analysis. It shouldn't be used as the only indication of trade because it causes you to lose your money. You should use other indicators to analyze together.
