Heiken Ashi Trend w/vol Signals**Heiken Ashi Trend Signals**
⚠️ **DISCLAIMER: Trading involves extreme risk. This is for educational purposes only.**
**What This Indicator Does:**
This indicator identifies potential entry and exit points for trending moves by analyzing Heiken Ashi candle patterns combined with moving average confirmation and trend visualization. It provides visual signals based on specific candle characteristics and momentum shifts, along with volume. This can help spot reversals, pullback/continuations, take profit signals, and other trading opportunities.
**IMPORTANT:** It is recommended to use along with Heiken Ashi style candles, but the signals will still plot on other chart types. It's important to know it's always using Heiken Ashi calculations regardless of which chart style you prefer. Intended to use with Weekly/Daily chart, Daily/4hr chart, or 4hr/1hr chart combinations.
**Turn off all sell signals to reduce clutter if you're trading Longs
**Alert Functionality:**
Choose which signals matter most to your trading strategy or which entry you're waiting for on a specific chart. Set up individual alerts for:
- Long Entry - Get notified when bullish signal criteria are met
- Long Entry High Volume - Get notified only when bullish signals occur with above average volume
- Exit Long - Know when long exit conditions trigger
- Short Entry - Catch bearish signal opportunities
- Short Entry High Volume - Get notified only when bearish signals occur with above average volume.
- Exit Short - Exit alerts for short positions
Monitor opportunities across multiple symbols without watching charts constantly. Each alert type can be enabled or disabled independently based on your specific setup. They can also be added to entire watchlists at once, depending on the TV plan you have.
**Key Features:**
📢 Flexible Alert System: Select only the signal types you want to be notified about - perfect for traders who focus exclusively on longs, shorts, or both
🟢 Long Entry Signals: Identifies strong bullish candles (no lower wick) that close above both EMAs with recent "red bar" in the previous 4 bars
🔴 Short Entry Signals: Identifies strong bearish candles (no upper wick) that close below both EMAs with recent "green bar" in the previous 4 bars
🚪 Exit Signals: Flags when opposing candle color appears (orange X for long exits, purple X for short exits) - this can be a take profit, stop loss adjustment, etc., depending on your target or other confluence such as support/resistance, 200 SMA, etc.
📊 Volume Confirmation: Small colored circles appear on signal bars to indicate volume strength (green = above average, yellow = below average)**
☁️ Dynamic EMA Cloud: Visual trend indicator based on EMA alignment
📊 Customizable Moving Averages: Two EMAs (default 8 & 30) and two SMAs (default 50 & 200), all fully adjustable
🎨 Full Customization: All colors, transparencies, and line weights are adjustable in the Style tab
**Understanding Heiken Ashi Candles:**
Regular candlesticks display raw price action, including every minor fluctuation and moment of indecision. Heiken Ashi candles take a different approach - they average price data from the current and previous periods, creating a smoothed representation of price movement.
Think of it like this: if regular candles show every ripple in the ocean, Heiken Ashi candles are the overall movement of the ocean.
This smoothing process filters out market noise and makes genuine trend changes easier to identify.
**Benefits of Using Heiken Ashi:**
✅ Clearer Trend Visualization - Sustained color runs indicate strong trends
✅ Reduced Noise - Smoothing removes choppy, indecisive price action
✅ Momentum Identification - Helps spot potential shifts in market direction
✅ Easier to Read - Less cognitive load analyzing price action
**Moving Averages & Trend Context:**
The indicator includes a comprehensive moving average system to provide trend context:
**Simple Moving Averages:**
- SMA 1 (default 50) - Intermediate trend reference
- SMA 2 (default 200) - Long-term trend reference
- Both lengths are fully customizable
- Toggle on/off independently
- Use for additional support/resistance context and confluence
**Volume Confirmation:**
The indicator includes volume analysis to help assess signal stength:
- Green circle = strong volume
- Orange circle = weak volume
**High volume alerts available** - set alerts specifically for signals that occur with strong volume
**Why This Matters:**
- Breakouts with high volume tend to be more reliable
- Low volume signals may indicate weak participation or false moves
- Allows you to prioritize high-conviction setups
- Can filter out low-volume signals entirely using the "High Volume" alert options
**Benefits of This Approach:**
✅ Additional Confirmation - Requires breaking through resistance/support
✅ Filtered Signals - Reduces signals on weak bounces
✅ Quality Focus - Fewer but more structured setups
✅ Clear Criteria - Objective rules for signal generation
**Using This Indicator in Confluence:**
This indicator is designed to be one component of a comprehensive trading strategy. Always use it in conjunction with other analysis methods:
**Potential Confluence Factors:**
✅ Volume Confirmation - Higher volume breakouts are typically more reliable
✅ Longer-Term Moving Averages (50ma & 200ma), Support & Resistance, Fibonacci levels, etc
✅ Market Structure - Identify higher highs/lows (uptrend) or lower highs/lows (downtrend)
✅ Time Frame Alignment - Confirm signals on your trading timeframe align with higher timeframe trends
**Important Considerations:**
This indicator provides signals based on mathematical criteria, but does not guarantee trading success. All trading involves risk, and you should:
- Never rely on a single indicator for trading decisions
- Always do your own analysis and due diligence
- Use proper risk management and position sizing
- Practice on paper/demo accounts
- Understand that past performance does not indicate future results
**What Makes This Indicator Useful:**
This indicator combines multiple confirmation factors:
- No bottom wick (for longs) = buyers controlled the entire session, no lower rejection
- No top wick (for shorts) = sellers controlled the entire session, no upper rejection
- Volume confirmation = visual indicator of participation strength
- Visual trend context = cloud color shows EMA alignment at a glance
**Best Used For:**
- Swing trading on daily/weekly timeframes. Some prefer to enter on 4hr confirmation.
- Identifying potential trend changes for further analysis
- Visual confirmation of EMA alignment and trend structure
- Combining with volume, support/resistance, and other technical factors
- Filtering for high-probability setups with volume confirmation
- Systematic, rules-based approach to reduce emotional decisions
- Spotting reversals, pullbacks/continuations, and take profit opportunities
All visual elements are fully customizable to match your charting preferences while maintaining the core signal logic.
**Educational Tool:**
This indicator is intended as an educational and analytical tool to help traders identify potential setups based on specific technical criteria. It should be used as part of a broader trading education and strategy development process, not as standalone trading advice.
---
Indikator dan strategi

Renko BandsThis is renko without the candles, just the endpoint plotted as a line with bands around it that represent the brick size. The idea came from thinking about what renko actually gives you once you strip away the visual brick format. At its core, renko is a filtered price series that only updates when price moves a fixed amount, which means it's inherently a trend-following mechanism with built-in noise reduction. By plotting just the renko price level and surrounding it with bands at the brick threshold distances, you get something that works like regular volatility bands while still behaving as a trend indicator.
The center line is the current renko price, which trails actual price based on whichever brick sizing method you've selected. When price moves enough to complete a brick in the renko calculation, the center line jumps to the new brick level. The bands sit at plus and minus one brick size from that center line, showing you exactly how far price needs to move before the next brick would form. This makes the bands function as dynamic breakout levels. When price touches or crosses a band, you know a new renko brick is forming and the trend calculation is updating.
What makes this cool is the dual-purpose nature. You can use it like traditional volatility bands where the outer edges represent boundaries of normal price movement, and breaks beyond those boundaries signal potential trend continuation or exhaustion. But because the underlying calculation is renko rather than standard deviation or ATR around a moving average, the bands also give you direct insight into trend state. When the center line is rising consistently and price stays near the upper band, you're in a clean uptrend. When it's falling and price hugs the lower band, downtrend. When the center line is flat and price is bouncing between both bands, you're ranging.
The three brick sizing methods work the same way as standard renko implementations. Traditional sizing uses a fixed price range, so your bands are always the same absolute distance from the center line. ATR-based sizing calculates brick range from historical volatility, which makes the bands expand and contract based on the ATR measurement you chose at startup. Percentage-based sizing scales the brick size with price level, so the bands naturally widen as price increases and narrow as it decreases. This automatic scaling is particularly useful for instruments that move proportionally rather than in fixed increments.
The visual simplicity compared to full renko bricks makes this more practical for overlay use on your main chart. Instead of trying to read brick patterns in a separate pane or cluttering your price chart with boxes and lines, you get a single smoothed line with two bands that convey the same information about trend state and momentum. The center line shows you the filtered trend direction, the bands show you the threshold levels, and the relationship between price and the bands tells you whether the current move has legs or is stalling out.
From a trend-following perspective, the renko line naturally stays flat during consolidation and only moves when directional momentum is strong enough to complete bricks. This built-in filter removes a lot of the whipsaw that affects moving averages during choppy periods. Traditional moving averages continue updating with every bar regardless of whether meaningful directional movement is happening, which leads to false signals when price is just oscillating. The renko line only responds to sustained moves that meet the brick size threshold, so it tends to stay quiet when price is going nowhere and only signals when something is actually happening.
The bands also serve as natural stop-loss or profit-target references since they represent the distance price needs to move before the trend calculation changes. If you're long and the renko line is rising, you might place stops below the lower band on the theory that if price falls far enough to reverse the renko trend, your thesis is probably invalidated. Conversely, the upper band can mark levels where you'd expect the current brick to complete and potentially see some consolidation or pullback before the next brick forms.
What this really highlights is that renko's value isn't just in the brick visualization, it's in the underlying filtering mechanism. By extracting that mechanism and presenting it in a more traditional band format, you get access to renko's trend-following properties without needing to commit to the brick chart aesthetic or deal with the complications of overlaying brick drawings on a time-based chart. It's renko after all, so you get the trend filtering and directional clarity that makes renko useful, but packaged in a way that integrates more naturally with standard technical analysis workflows.

Advanced Multi-Timeframe Trend & Signal System═══════════════════════════════════════════════════════════════
ADVANCED MULTI-TIMEFRAME TREND & SIGNAL SYSTEM v1.0
═══════════════════════════════════════════════════════════════
Created by: Zakaria Safri
License: Mozilla Public License 2.0
A comprehensive technical analysis tool designed for traders seeking
multi-dimensional market insights. This indicator combines proven
technical analysis methods with modern visualization techniques.
═══════════════════════════════════════════════════════════════
KEY FEATURES
═══════════════════════════════════════════════════════════════
✓ SUPERTREND SIGNAL GENERATION
- Customizable sensitivity settings
- Clear long/short entry signals
- Automatic trend direction detection
- ATR-based dynamic calculations
✓ MULTI-TIMEFRAME DASHBOARD
- Real-time trend analysis across 6 timeframes
- Synchronized trend confirmation
- Customizable table position and size
- Current: 1M, 5M, 15M, 1H, 1D coverage
✓ QQE REVERSAL DETECTION
- Quantitative Qualitative Estimation algorithm
- Early reversal signal identification
- Adjustable RSI and smoothing parameters
- Confirmation-based plotting
✓ DYNAMIC SUPPORT & RESISTANCE
- Pivot-based level calculation
- Quick and standard pivot detection
- Color-coded zones (8 levels)
- Automatic level updates
✓ MOMENTUM BREAKOUT SIGNALS
- Ichimoku-inspired calculations
- Bullish and bearish breakout detection
- Visual zone highlighting
- Trend confirmation filters
✓ RISK MANAGEMENT SYSTEM
- ATR-based stop loss calculation
- Multiple take profit targets (TP1, TP2, TP3)
- Customizable risk-to-reward ratios
- Dynamic price level tracking
- Hit detection markers
✓ VOLATILITY BANDS
- Keltner Channel implementation
- Multiple band layers (3 levels)
- EMA-based calculations
- Adaptive to market conditions
✓ TREND CLOUD VISUALIZATION
- Dual moving average cloud
- Clear trend direction indication
- Customizable color scheme
- Trend bar coloring
═══════════════════════════════════════════════════════════════
HOW TO USE
═══════════════════════════════════════════════════════════════
SETUP:
1. Add indicator to your chart
2. Configure sensitivity in Core Signals section
3. Enable desired features (signals, reversals, breakouts)
4. Set up risk management levels if trading
5. Position MTF dashboard to preference
SIGNAL INTERPRETATION:
• LONG Signal: Price crosses above Supertrend
• SHORT Signal: Price crosses below Supertrend
• REV (Reversal): QQE indicates potential trend change
• Diamond Breakouts: Momentum shift confirmation
• T1/T2/T3: Take profit level hits
MULTI-TIMEFRAME ANALYSIS:
• Green (BULL): Higher timeframe supports uptrend
• Red (BEAR): Higher timeframe supports downtrend
• Use for trend alignment and confirmation
• Best results when multiple timeframes align
RISK MANAGEMENT:
• Enable Stop Loss for automatic SL calculation
• Activate TP levels based on trading style
• Adjust Risk-to-Reward ratio (1:1 to 1:10)
• Monitor hit detection circles for exits
═══════════════════════════════════════════════════════════════
TECHNICAL SPECIFICATIONS
═══════════════════════════════════════════════════════════════
CALCULATIONS:
• Supertrend: ATR-based with customizable multiplier
• QQE: Modified RSI with Wilders smoothing
• Keltner Channels: EMA basis with ATR bands
• Pivots: Standard left/right bar methodology
• Support/Resistance: Multi-level pivot analysis
PARAMETERS:
• Supertrend Sensitivity: 0.5 to 10.0 (default: 2.0)
• RSI Period: 5 to 50 (default: 14)
• QQE Multiplier: 1.0 to 10.0 (default: 4.238)
• Risk-to-Reward: 1 to 10 (default: 4)
TIMEFRAMES:
Compatible with all timeframes. MTF dashboard displays:
• 1 Minute (1M)
• 5 Minutes (5M)
• 15 Minutes (15M)
• 1 Hour (1H)
• 1 Day (1D)
• Current chart timeframe
═══════════════════════════════════════════════════════════════
CUSTOMIZATION OPTIONS
═══════════════════════════════════════════════════════════════
VISUAL:
• Professional color scheme (Cyan/Orange)
• Adjustable table position (9 positions)
• Table size options (tiny/small/normal/large)
• Transparent zone highlighting
• Clean, modern label design
TOGGLES:
• Enable/disable any feature independently
• Show/hide signals, reversals, breakouts
• Toggle S/R levels and zones
• Control trend cloud and bands
• Master trend line optional
ALERTS:
The indicator provides visual signals that can be used with
TradingView's alert system by setting alerts on the indicator.
═══════════════════════════════════════════════════════════════
BEST PRACTICES
═══════════════════════════════════════════════════════════════
✓ Combine signals for higher probability setups
✓ Use MTF dashboard for trend confirmation
✓ Respect S/R levels for entry/exit planning
✓ Monitor QQE reversals at key price levels
✓ Adjust sensitivity based on asset volatility
✓ Test on demo/paper trading first
✓ Use proper risk management always
═══════════════════════════════════════════════════════════════
IMPORTANT DISCLAIMER
═══════════════════════════════════════════════════════════════
This indicator is a technical analysis tool and does NOT:
• Guarantee profitable trades
• Provide financial advice
• Predict future price movements with certainty
• Replace proper risk management
• Substitute for personal due diligence
Past performance does not indicate future results. All trading
involves risk. Users should:
- Understand the indicator's logic
- Test thoroughly before live trading
- Use appropriate position sizing
- Never risk more than they can afford to lose
- Consult financial advisors if needed
═══════════════════════════════════════════════════════════════
CODING STANDARDS
═══════════════════════════════════════════════════════════════
This indicator follows PineCoders Coding Conventions:
✓ Proper variable naming (prefixes: i_, f_, c_)
✓ Clear function documentation
✓ Organized code structure
✓ Type declarations
✓ Efficient calculations
✓ No repainting (confirmed signals)
✓ Proper use of request.security
═══════════════════════════════════════════════════════════════
SUPPORT & UPDATES
═══════════════════════════════════════════════════════════════
Version: 1.0
Author: Zakaria Safri
License: MPL 2.0
Last Updated: 2024
For questions, feedback, or suggestions, please comment below.
═══════════════════════════════════════════════════════════════
#trading #signals #supertrend #multiTimeframe #QQE #reversals
#supportResistance #riskManagement #trendAnalysis #momentum

RSI Breakout Zones█ OVERVIEW
“RSI Breakout Zones” is a technical analysis tool that identifies significant zones on the chart based on the Relative Strength Index (RSI). The indicator maps overbought (OB) and oversold (OS) zones using boxes, then extends them until the next zone of the same type is detected, highlighting breakout points to aid in trade entry decisions. These zones often serve as areas of consolidation, support, or resistance.
█ CONCEPTS
The indicator identifies overbought (above 70) and oversold (below 30) zones, drawing boxes that extend until the next zone of the same type (OB for OB, OS for OS) is detected. Breakout signals are generated when the price crosses the zone boundaries, indicating potential shifts in market momentum.
Why are RSI zones important? These zones represent areas of extreme market sentiment, often leading to corrections or reversals. Overbought zones suggest potential selling pressure, while oversold zones indicate buying opportunities. After a breakout, a zone may switch roles, e.g., from support to resistance or vice versa, making it a key element in price action analysis. Larger zones, formed during high volatility, may attract price for retests due to stronger imbalances in buyer/seller dynamics. Consolidation often occurs within these zones as the market seeks equilibrium before further moves. However, in strong trends, zones may be decisively broken without immediate pullbacks, and their significance depends on their position relative to key support and resistance levels.
█ FEATURES
- RSI Zone Detection: Calculates RSI with a customizable length (default 14) and identifies overbought/oversold zones based on user-defined levels (default 70/30), drawing boxes that dynamically adjust to price action within the zone.
- Customizable Boxes: Zones extend until the next zone of the same type is detected. The indicator draws zones with adjustable colors for overbought (red) and oversold (green) areas, with options for box and zone transparency.
- Breakout Signals: Generates upward (green triangle) and downward (red triangle) breakout signals when the price crosses the top or bottom of a zone. Signals appear below or above the bar, indicating potential trade entry points.
- Midline: Automatically draws a dashed line at the midpoint of each zone, helping traders assess price behavior within the zone and potential halfway retests.
- Box Management: Option to remove outdated boxes.
- Alerts: Built-in support for alerts on breakout signals, enabling traders to receive notifications for key zone crossings.
█ HOW TO USE
Add to Chart: Apply the indicator to your TradingView chart via the Pine Editor or Indicators menu.
Configure Settings:
- RSI Settings: Adjust RSI Length (default 14), Overbought Level (default 70), and Oversold Level (default 30) to tailor zone detection sensitivity—higher lengths smooth signals for longer-term analysis.
- Box Settings: Configure colors and transparency for overbought (red) and oversold (green) zones, including box transparency (default 90) and zone transparency (default 90).
- Signal Settings: Customize breakout signal colors (green for upward, red for downward) and enable/disable keeping boxes after RSI normalization.
Interpreting Signals:
- Upward Breakout Signal: A green triangle below the bar indicates a breakout, suggesting potential bullish momentum and trend continuation or reversal.
- Downward Breakout Signal: A red triangle above the bar indicates a breakout, suggesting potential bearish momentum.
- RSI Zones: If the price re-enters a zone after a breakout, it may signal a false breakout or consolidation; persistent zones can act as future support/resistance levels. Consolidation often occurs within these zones as the market seeks equilibrium.
- Use signals alongside other technical analysis tools for confirmation, such as moving averages (to confirm trend direction), Fibonacci levels (to identify key price zones), or volume indicators (to validate breakout strength). Analyze RSI zones on higher timeframes for stronger signals due to broader market context.
█ APPLICATIONS
- Momentum Trading: Use RSI zones as overbought/oversold filters. In an uptrend, look for buying opportunities on upward breakouts, and in a downtrend, on downward breakouts. Combining with MACD crossovers, Fibonacci levels, or pivot points enhances zone significance.
- Inter-Zone Trading: Utilize breakouts from one RSI zone and hold the position until reaching the next zone, which may act as a target level or reversal point.
█ NOTES
- Test the indicator across different timeframes and markets (stocks, forex, crypto) to optimize RSI length and levels for your trading style.
- For best results, use in trending markets where RSI extremes are more predictive; in ranging markets, additional filters are recommended to reduce false signals.
- Always combine with risk management; RSI zones alone do not guarantee reversals, and false breakouts may occur in low-liquidity environments.

Adaptive Volatility Bands | AlphaNattAdaptive Volatility Bands (AVB) | AlphaNatt
Professional-grade dynamic bands that adapt to market volatility and trend strength, featuring smooth gradient visualization for enhanced chart clarity.
🎯 CORE CONCEPT
AVB creates self-adjusting bands around a customizable basis line, expanding during trending markets and contracting during consolidation. The gradient fill provides instant visual feedback on price position within the volatility envelope.
✨ KEY FEATURES
5 Basis Types: Choose between SMA, EMA, ALMA, KAMA, or VWMA for the centerline calculation
Adaptive Band Width: Bands automatically widen in strong trends and tighten in ranging markets
Smooth Gradient Fills: 10-layer gradient on each side for professional depth visualization
Multiple Volatility Metrics: ATR, Standard Deviation, or Range-based calculations
Squeeze Detection: Identifies Bollinger/Keltner squeeze conditions for breakout anticipation
Dynamic Color States: Cyan (#00F1FF) for bullish, Magenta (#FF019A) for bearish conditions
📊 HOW IT WORKS
The basis line is calculated using your selected moving average type
Volatility is measured using ATR, StDev, or Range
Trend strength is quantified via linear regression
Band width adapts based on normalized trend strength (when enabled)
Gradient layers create smooth visual transitions from bands to basis
Color state changes based on price position and basis direction
🔧 PARAMETER GROUPS
Basis Configuration:
Basis Type: Moving average calculation method
Basis Length (20): Period for centerline calculation
ALMA Settings: Offset (0.85) and Sigma (6) for ALMA basis
Volatility Settings:
Volatility Method: ATR, Standard Deviation, or Range
Volatility Length (14): Lookback for volatility calculation
Band Multiplier (2.0): Distance of bands from basis
Adaptive Settings:
Enable Adaptive (true): Toggle dynamic band adjustment
Adaptation Period (50): Trend strength measurement window
Squeeze Detection:
BB/KC Parameters: Settings for squeeze identification
Expansion Threshold: Multiplier for expansion signals
📈 TRADING SIGNALS
Long Conditions:
Price crosses above basis
Basis line is rising
Band color shifts to cyan
Short Conditions:
Price crosses below basis
Basis line is falling
Band color shifts to magenta
💡 USAGE STRATEGIES
Trend Following: Trade with the basis direction when bands are expanding
Mean Reversion: Fade moves to outer bands during squeeze conditions
Breakout Trading: Enter on expansion signals after squeeze periods
Support/Resistance: Use bands as dynamic S/R levels
Position Sizing: Wider bands suggest higher volatility - adjust size accordingly
🎨 VISUAL ELEMENTS
Gradient Fills: 10 opacity layers creating smooth band transitions
Dynamic Colors: State-dependent coloring for instant trend recognition
Basis Line: Bold centerline changes color with trend state
Band Lines: Outer boundaries with matching state colors
⚡ BEST PRACTICES
The AVB indicator works optimally on liquid instruments with consistent volume. The adaptive feature performs best in trending markets but can generate false signals during choppy conditions. Consider using alongside momentum indicators for confirmation. The gradient visualization helps identify price position within the volatility envelope at a glance.
🔔 ALERTS INCLUDED
Long/Short Signals
Squeeze Conditions
Expansion Breakouts
Band Touch Events
Version 6 | Pine Script™ | © AlphaNatt

DTR & ATR with live zonesThis indicator is designed to help traders gauge the day's volatility in real-time. It compares the current Daily True Range (DTR)—the distance between the session's high and low—to the historical Average True Range (ATR).
The main purpose is to project potential price levels where the market might reach based on its average volatility. These levels (100% ATR, 150%, 200%, etc.) can be used as price targets. For instance, if you're in a long trade, you might consider taking partial or full profits as the price approaches these upper ATR extension levels. The indicator is highly customisable, allowing you to control the appearance of the ATR lines, zones, and labels to fit your charting preferences.
Core Concepts: ATR and DTR
To use this indicator effectively, it's important to understand its two main components:
Average True Range (ATR): This is a classic technical analysis indicator that measures market volatility. It calculates the average range of price movement over a specific period (e.g., 14 days). A higher ATR means the price is, on average, moving more, while a low ATR indicates less volatility. This script uses a higher timeframe ATR (e.g., Daily) to establish a stable volatility baseline for the current trading day.
Daily True Range (DTR): This is simply the difference between the current trading session's highest high and lowest low (session high - session low). It tells you how much the price has actually moved so far today.
The indicator's logic revolves around comparing the live, unfolding DTR to the historical, baseline ATR. An on-screen table conveniently shows this comparison as a percentage, to show how volatile the day has been.
How It Works: The Dynamic & Locked Mechanism
The most clever part of this indicator is how it draws the ATR levels. It operates in two distinct phases during the trading session:
Phase 1: Dynamic Expansion (Before DTR meets ATR)
At the start of the session, the DTR is small. The indicator calculates the remaining range needed to "complete" the 100% ATR level (difference = avg_atr - dtr). It then adds this remaining amount to the session high and subtracts it from the session low. This creates a "floating" 100% ATR range that expands dynamically as the session high or low is extended.
Phase 2: The Lock-in (After DTR meets or exceeds ATR)
Once the day's range (DTR) becomes equal to or greater than the avg_atr, the day has met its "expected" volatility. At this point, the levels lock in place. The indicator intelligently determines the anchor point for the locked range.
Once this primary 100% ATR range is established (either dynamically or locked), the script projects the other levels (150%, 200%, 250%, and 300%) by adding or subtracting multiples of the avg_atr from this base.
How to Use It for Trading
The primary use of this indicator is to set logical, volatility-based price targets.
Setting Profit Targets: If you enter a long position, the upper ATR levels (100%, 150%, 200%) serve as excellent areas to consider taking profits. A move to the 200% or 250% level often signifies an overextended or "exhaustion" move, making it a high-probability exit zone. For short positions, the lower ATR levels serve the same purpose.
Assessing Intraday Momentum: The on-screen table tells you how much of the expected daily range has been used. If it's early in the session and the DTR is only at 30% of the ATR, you can anticipate more significant price movement is likely to come. Conversely, if the DTR is already at 150% of ATR, the bulk of the day's move may already be complete.
Mean Reversion Signals: If the price pushes to an extreme level (e.g., 250% ATR) and shows signs of stalling (e.g., bearish divergence on an oscillator), it could signal a potential reversal or pullback, offering an opportunity for a counter-trend trade.
Key Settings
ATR Length & Smoothing Type: These settings control how the baseline ATR is calculated. The default 14 period and RMA smoothing are standard, but you can adjust them to your preference.
Session Settings: This is crucial. You must set the Market Session and Time Zone to match the primary trading hours of the asset you are analysing (e.g., "0930-1600" for the NYSE session).
Show Lines / Show Labels / Show Zones: The script gives you full control over the visual display. You can toggle each ATR level's lines, labels, and background zones individually to avoid a cluttered chart and focus only on the levels that matter to your strategy.

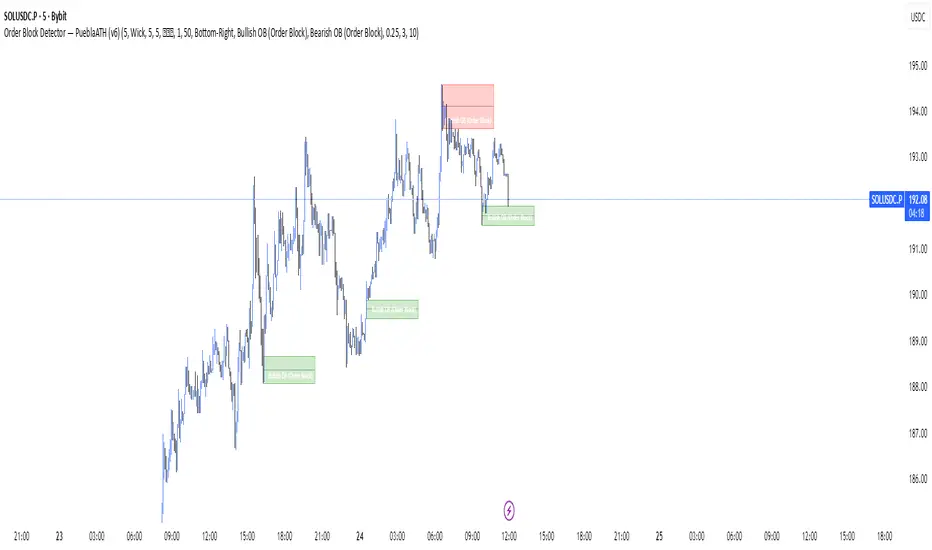
Order Blocks — Smart Mitigation & OB Labels (SMC/ICT)Order Blocks — Smart Mitigation & OB Labels (SMC/ICT) — TradingATH
Precision. Stability. Execution.
This refined indicator automatically detects and draws bullish and bearish Order Blocks , perfectly anchored to the candle that created them. Each zone remains fixed, never drifting as you move the chart, ensuring absolute spatial accuracy.
ATR-based filters remove insignificant blocks, and optional live extensions allow active OBs to project forward until price delivers mitigation.
What You’ll See
Bullish Order Blocks in subtle green tones, with a fine mid-line and a small label reading “Bullish OB (Order Block)”.
Bearish Order Blocks in elegant red tones, equally marked and labeled.
Compact, controlled-length zones extending only for the defined number of bars.
Optional dynamic extension for unmitigated blocks until price returns.
Real-time alerts when price enters the most recent bullish or bearish OB.
Features
True anchoring : OBs are plotted in absolute time coordinates, fixed to the original source candle. No drift.
Custom length control : Adjust each block’s horizontal reach by number of bars.
ATR-based filters : Define minimum and maximum OB size (in multiples of ATR) to maintain clean and relevant zones.
Smart mitigation logic : Choose between “Wick” or “Close” for OB validation; mitigated blocks are automatically removed.
Elegant labeling : Minimalistic text inside each block, positionable in any corner for optimal readability.
Advanced alerts : Automated signals for new OB formation and price entry into the latest block.
Professional architecture : Size-safe arrays, optimized rendering, and zero performance waste.
ICT/SMC ready : Fully compatible with advanced concepts such as Fair Value Gaps, Liquidity Sweeps, and Session Timing.
Perfect For
Traders applying ICT or Smart Money Concepts who require precise OB identification and mitigation tracking.
Intraday traders seeking clarity and efficiency on fast-moving charts.
Swing traders filtering premium-quality OBs based on volatility structure.
Recommended Settings
OB Length: 10 bars (adjust to timeframe and volatility).
Label position: Bottom-Right for most clarity.
Mitigation method: “Wick” for flexible precision; “Close” for stricter validation.
ATR filter: Minimum 0.25×, Maximum 3× (balanced range for most assets).
In Short
Clean structure. Absolute precision. Professional delivery.
Order Blocks — Smart Mitigation & OB Labels (SMC/ICT) provides a stable, disciplined visualization of institutional order flow — designed for traders who demand both accuracy and aesthetic refinement.
Created by: TradingATH
DAMMU AUTOMATICAL AI ENRTY AND TARGET AND EXITMain Components
Supertrend System –
Detects market trend direction (Buy/Sell zones).
→ Green = Uptrend (Buy)
→ Red = Downtrend (Sell)
SMA Filter –
Uses 50 & 200 moving averages to confirm overall trend.
→ Price above both → Bullish
→ Price below both → Bearish
Buy/Sell Signals –
Generated when Supertrend flips direction and SMA confirms.
→ Triangle up = Buy
→ Triangle down = Sell
Take Profit / Stop Loss Levels –
Automatically calculated after Buy/Sell entry.
→ TP1, TP2, SL shown on chart
ADX (Sideways Zone Filter) –
If ADX < 25 → Market sideways → Avoid trades
Shows “No Trade Zone” area
Smart Money Concepts (SMC) Tools –
🔹 Market structure (HH, HL, LH, LL)
🔹 Order blocks (OB)
🔹 Equal highs/lows
🔹 Fair Value Gaps (FVG)
🔹 Premium & Discount zones
Helps find institutional entry points
Visual Display –
Color-coded background (trend zones)
Labels for buy/sell/structure
Optional FVG and order block boxes
Risk Management –
Input-based position sizing, SL & TP management
(to calculate profit levels and minimize loss)

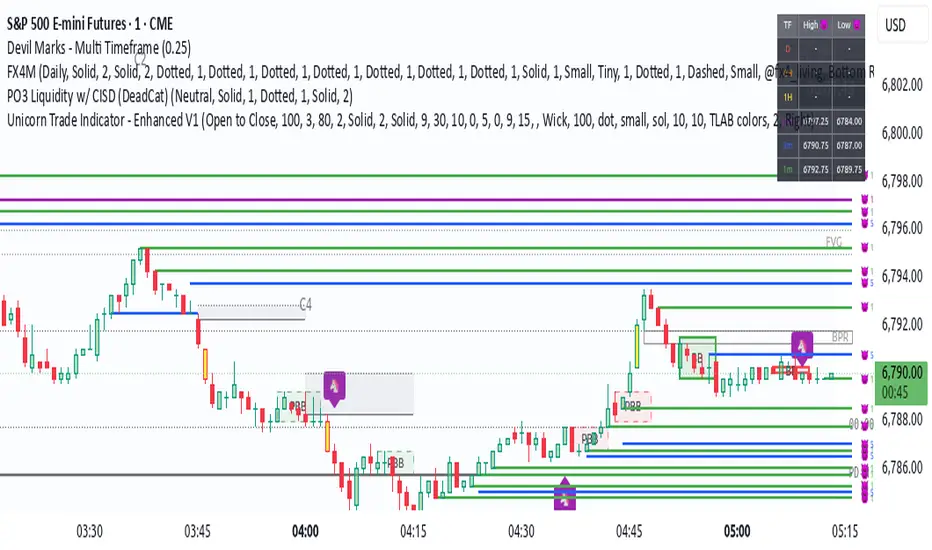
Unicorn Trade Indicator - Enhanced V1This code also contains pinescripts from iFVG (BPR) by Algorize and Visualizing displacement by tradeforopp who have kindly provided them as open source.
An ICT Unicorn is where a breaker block is traded through which incorporates a fair value gap. I decided to code this indicator as I couldn't find an existing free indicator on Trading View that performed adequately.
This indicator will highlight breaker blocks and when broken will post an Unicorn emoji and send an alert if requested. The last 3 breaker blocks are displayed, the prior boxes are labled PBB and are shown as red for bearish and green for bullish. After the main Unicorn is posted, the code continues to mark market structure shifts.
As all trading strategies work better with confluence I have added several other features which is very useful for people who are restricted on the number of indicators that can place on a single chart.
I have added iFVG (BPR) by Algoryze and Visualizing displacement by tradeforopp which have kindly been made open source by the authors. My thanks to them for their hard work.
Unicorn alerts will only be sent when a yellow displacement candle ( from the Visualizing displacement code) is present along with the Unicorn as this is the best type of Unicorn to trade.
The number of fvg's and bpr's from the code by Algoryze can be adjusted in the settings.
Also to add confluence I have used my own code to display liquidity depth boxes made popular by toodegrees.
I hope you find this indicator useful.
Range Filter Oscillator - MACD Style [DW] FIRST I want too give full credit to DonovanWall on tradingview. I simply used Grok to make a MACD version, which in my opinion makes it 2 or 3x as powerful! Although I'm not generally a fan of MACD, his indicator is hugely complimented by it. It's better than the normal MACD.
----------------------------------------------------------------------------
The **Range Filter Oscillator - MACD Style ** is a technical indicator that helps traders identify trends and potential buy or sell signals. It works by smoothing price movements to filter out noise and focuses on significant price changes.
Here's how it works in simple terms:
1. **Range Filter**: It calculates a dynamic range around the price, based on user settings (like ATR, price percentage, or ticks). Prices moving outside this range are considered significant.
2. **Oscillator**: It measures how far the current price is from the filtered price, creating a value that swings above or below zero, like an oscillator.
3. **MACD-Style**: It compares the oscillator (fast line) to its smoothed version (slow line, using a simple moving average). The difference between them forms a **histogram**, which shows momentum:
- **Positive histogram** (green): Upward momentum, suggesting a buy signal.
- **Negative histogram** (red): Downward momentum, suggesting a sell signal.
4. **Crossovers**: When the fast line crosses above the slow line, it indicates a potential buy. When it crosses below, it suggests a sell.
5. **Bar Colors**: The chart bars turn green for bullish signals, red for bearish, and gray for neutral, making it easy to spot trend changes.
This indicator is great for spotting trends while ignoring minor price fluctuations, and its MACD-style visuals make it intuitive for traders familiar with momentum indicators.

Velocity Pressure Index | AlphaNattVelocity Pressure Index (VPI) | AlphaNatt
A sophisticated momentum oscillator that combines price velocity analysis with volume pressure dynamics to identify high-probability trading opportunities.
📊 KEY FEATURES
Dual Analysis System: Merges price velocity measurement with volume pressure analysis for comprehensive market momentum assessment
Dynamic Normalization: Automatically scales values between -100 and +100 for consistent readings across all market conditions
Adaptive Zones: Self-adjusting overbought/oversold levels based on recent price history
Multi-Layer Confirmation: Combines momentum, acceleration, and crossover signals for robust trade identification
Volume-Weighted Pressure: Differentiates between bullish and bearish volume to gauge true market sentiment
📈 HOW IT WORKS
The VPI calculates price velocity using linear regression of price changes, then weights this velocity by the difference between bullish and bearish volume pressure. This creates a momentum reading that accounts for both price movement speed and the volume conviction behind it.
Signal Generation:
Price velocity is measured over the specified period
Volume is separated into bullish (close > open) and bearish (close < open) pressure
Velocity is amplified or dampened based on volume pressure differential
The resulting index is normalized to oscillate between -100 and +100
A signal line smooths the oscillator for crossover detection
🎯 TRADING SIGNALS
Long Signals (Cyan #00F1FF):
Strong Bull: VPI > Signal with positive momentum and acceleration
Crossover Bull: VPI crosses above signal while above oversold zone
Divergence: Price makes lower low while VPI makes higher low
Short Signals (Magenta #FF019A):
Strong Bear: VPI < Signal with negative momentum and deceleration
Crossover Bear: VPI crosses below signal while below overbought zone
Divergence: Price makes higher high while VPI makes lower high
⚙️ CUSTOMIZABLE PARAMETERS
Velocity Settings:
Velocity Period (14): Lookback for price velocity calculation
Pressure Period (21): Volume analysis window
Smoothing Factor (3): Final oscillator smoothing
Signal Configuration:
Signal Type: Choose between SMA, EMA, or DEMA
Signal Length (9): Signal line smoothing period
Normalization Period (50): Range calculation window
Dynamic Zones:
Zone Lookback (100): Period for adaptive overbought/oversold calculation
Percentiles: 80th/20th percentiles for dynamic zones
📐 VISUAL COMPONENTS
Main Oscillator: Color-coded line showing current momentum state
Signal Line: White line for crossover detection
Momentum Histogram: Shows velocity differential at 50% scale
Dynamic Zones: Self-adjusting overbought/oversold bands
Extreme Levels: ±50 dotted lines marking extreme conditions
Background Shading: Subtle highlighting of overbought/oversold regions
💡 USAGE TIPS
Trend Trading: Use strong bull/bear signals in trending markets for continuation entries
Range Trading: Focus on crossovers near extreme zones for reversal trades
Divergence Trading: Watch for price/oscillator divergences at market extremes
Multi-Timeframe: Combine with higher timeframe VPI for directional bias
Volume Confirmation: Stronger signals occur with aligned volume pressure
⚠️ BEST PRACTICES
The VPI works best in liquid markets with reliable volume data. For optimal results, combine with price action analysis and use appropriate risk management. The indicator is most effective during trending conditions but can identify reversals when divergences occur at extremes.
🔔 ALERTS AVAILABLE
VPI Long/Short Signals
Bullish/Bearish Crossovers
Extreme Overbought/Oversold Conditions
Version 6 | Pine Script™ | © AlphaNatt

Renko Entry Alerts Limit +0.08Simple renko 1 block reversal strategy Adds +0.08 to 1 block during pre a=market and after hours for more successful fills.

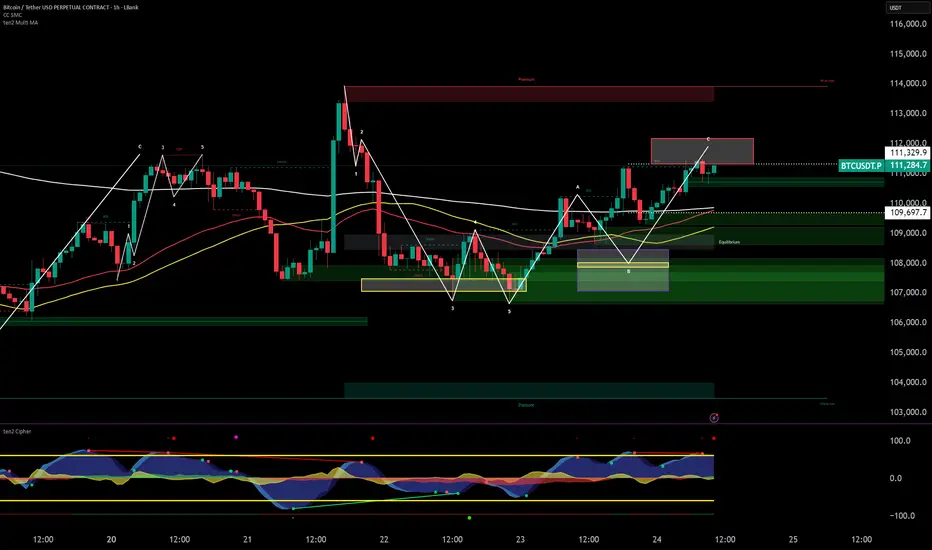
ten2 Cipher v.1Created and built by ten2crypto
This is not just another "Market Cipher" clone. This is my personal, ground-up build of a comprehensive momentum and divergence toolkit, designed to provide a deeper, more nuanced view of the market. The ten2 Cipher Divergence Engine combines the best aspects of classic momentum oscillators with a powerful, multi-layered divergence system.
This indicator was built for my own trading and is now being shared with the community.
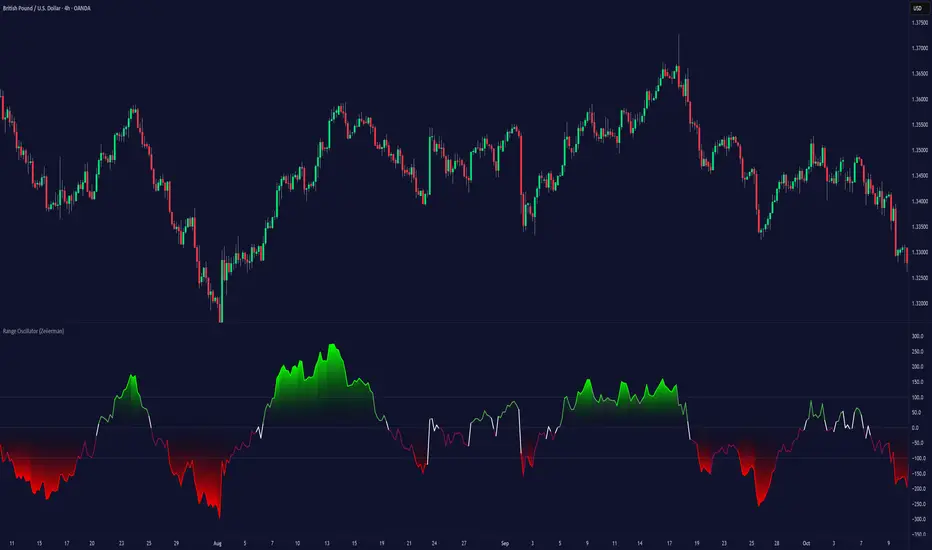
Range Oscillator (Zeiierman)█ Overview
Range Oscillator (Zeiierman) is a dynamic market oscillator designed to visualize how far the price is trading relative to its equilibrium range. Instead of relying on traditional overbought/oversold thresholds, it uses adaptive range detection and heatmap coloring to reveal where price is trading within a volatility-adjusted band.
The oscillator maps market movement as a heat zone, highlighting when the price approaches the upper or lower range boundaries and signaling potential breakout or mean-reversion conditions.
Highlights
Adaptive range detection based on ATR and weighted price movement.
Heatmap-driven coloring that visualizes volatility pressure and directional bias.
Clear transition zones for detecting trend shifts and equilibrium points.
█ How It Works
⚪ Range Detection
The indicator identifies a dynamic price range using two main parameters:
Minimum Range Length: The number of bars required to confirm that a valid range exists.
Range Width Multiplier: Expands or contracts the detected range proportionally to the ATR (Average True Range).
This approach ensures that the oscillator automatically adapts to both trending and ranging markets without manual recalibration.
⚪ Weighted Mean Calculation
Instead of a simple moving average, the script calculates a weighted equilibrium mean based on the size of consecutive candle movements:
Larger price changes are given greater weight, emphasizing recent volatility.
⚪ Oscillator Formula
Once the range and equilibrium mean are defined, the oscillator computes:
Osc = 100 * (Close - Mean) / RangeATR
This normalizes price distance relative to the dynamic range size — producing consistent readings across volatile and quiet periods.
█ Heatmap Logic
The Range Oscillator includes a built-in heatmap engine that color-codes each oscillator value based on recent price interaction intensity:
Strong Bullish Zones: Bright green — price faces little resistance upward.
Weak Bullish Zones: Muted green — uptrend continuation but with minor hesitation.
Transition Zones: Blue — areas of uncertainty or trend shift.
Weak Bearish Zones: Maroon — downtrend pressure but soft momentum.
Strong Bearish Zones: Bright red — strong downside continuation with low resistance.
Each color band adapts dynamically using:
Number of Heat Levels: Controls granularity of the heatmap.
Minimum Touches per Level: Defines how reactive or “sensitive” each color zone is.
█ How to Use
⚪ Trend & Momentum Confirmation
When the oscillator stays above +0 with green coloring, it suggests sustained bullish pressure.
Similarly, readings below –0 with red coloring, it suggests sustained bearish pressure.
⚪ Range Breakouts
When the oscillator line breaks above +100 or below –100, the price is exceeding its normal volatility range, often signaling breakout potential or exhaustion extremes.
⚪ Mean Reversion Trades
Look for the oscillator to cross back toward zero after reaching an extreme. These transitions (often marked by blue tones) can identify early reversals or range resets.
⚪ Divergence
Use oscillator peaks and troughs relative to price action to spot hidden strength or weakness before the next move.
█ Settings
Minimum Range Length: Number of bars needed to confirm a valid range.
Range Width Multiplier: Expands or contracts range width based on ATR.
Number of Heat Levels: Number of gradient bands used in the oscillator.
Minimum Touches per Level: Sensitivity threshold for when a zone becomes “hot.”
-----------------
Disclaimer
The content provided in my scripts, indicators, ideas, algorithms, and systems is for educational and informational purposes only. It does not constitute financial advice, investment recommendations, or a solicitation to buy or sell any financial instruments. I will not accept liability for any loss or damage, including without limitation any loss of profit, which may arise directly or indirectly from the use of or reliance on such information.
All investments involve risk, and the past performance of a security, industry, sector, market, financial product, trading strategy, backtest, or individual's trading does not guarantee future results or returns. Investors are fully responsible for any investment decisions they make. Such decisions should be based solely on an evaluation of their financial circumstances, investment objectives, risk tolerance, and liquidity needs.
WAD : Whale Activity Detector🐋 WAD: Whale Activity Detector
WAD (Whale Activity Detector) automatically detects periods of abnormally high trading volume compared to the average, identifying potential whale (institutional) buy or sell activity and visualizing it directly on the chart.
🔍 How It Works
1. Buy/Sell Volume Separation
Each candle’s trading volume is categorized based on its direction:
Bullish candle → Buy volume
Bearish candle → Sell volume
This separation helps distinguish the actual strength of buying vs. selling pressure, rather than looking at total volume alone.
2. Average Volume Calculation
Over a user-defined lookback period (default: 34 bars), the indicator calculates the moving average of both buy and sell volumes, establishing a baseline for what constitutes “normal” activity.
3. Whale Activity Detection
When the current volume exceeds n times the average volume (default: 4×), the indicator flags it as a Whale Zone — a potential sign of large player involvement.
Volume surge on a bullish candle → Whale Buy
Volume surge on a bearish candle → Whale Sell
4. Visual Display
🟢 Green bars: Whale buy activity
🔴 Red bars: Whale sell activity
BUY/SELL labels: Appear above the chart when an anomaly is detected
Average line toggle: Users can turn the average volume lines on or off for clarity
5. Alerts
Whenever whale buy/sell signals are detected, real-time alerts are triggered.
Example: 🐋 Whale Buy – NVDA! 🟢
⚙️ Indicator Meaning
Rather than showing raw volume, WAD tracks “abnormal volume relative to the average.”
It filters out noise and highlights the moments where large entities begin to move.
Essentially, it visualizes intentional and impactful trades hidden within standard volume activity.
🚀 Example Use Cases
Whale accumulation tracking – Repeated strong buy signals may indicate sustained institutional accumulation.
Short-term breakout confirmation – Price often rallies shortly after whale buy signals appear.
Support/resistance analysis – Whale sell zones frequently align with short-term resistance areas.
In short:
WAD identifies when trading volume exceeds its historical norm to highlight where big money enters or exits the market.
===============================================================================
🐋 WAD : 세력 매매거래 추적기
WAD(Whale Activity Detector) 는 특정 종목의 거래량 패턴 속에서
‘평균 대비 비정상적으로 큰 거래량이 발생한 구간’을 자동으로 감지해
세력(Whale)의 매수·매도 활동을 시각화하는 지표입니다.
🔍 작동 원리
매수·매도 거래량 분리
각 캔들이 양봉인지, 음봉인지에 따라 거래량을 분리합니다.
양봉 시 발생한 거래량 → 매수 거래량(buy volume)
음봉 시 발생한 거래량 → 매도 거래량(sell volume)
이렇게 분리함으로써 단순 거래량이 아닌,
실제 매수세/매도세의 힘을 구분할 수 있습니다.
평균 거래량 계산
사용자가 지정한 기간(기본 34봉)을 기준으로
매수·매도 거래량의 이동평균선을 각각 계산합니다.
이는 ‘정상적인 거래량 수준’을 판단하는 기준선으로 활용됩니다.
이상치 탐지 (Whale Activity Detection)
현재 거래량이 평균 거래량의 n배(기본 4배)를 초과할 경우,
그 구간을 세력 개입 구간(Whale Zone) 으로 판단합니다.
양봉에서 급증 → 세력 매수 (Whale Buy)
음봉에서 급증 → 세력 매도 (Whale Sell)
시각적 표시
초록색 기둥 : 세력 매수 거래량
빨간색 기둥 : 세력 매도 거래량
라벨 표시 (BUY / SELL) : 이상치 발생 시 차트 상단에 표시
평균선 표시 옵션 : 사용자가 원할 때 평균선을 켜거나 끌 수 있음
알림(Alerts)
세력의 매수·매도 신호가 감지되면,
알림 메시지를 통해 실시간으로 통보받을 수 있습니다.
(예: 🐋 Whale Buy - NVDA! 🟢)
⚙️ 지표의 의미
단순 거래량이 아니라, ‘평균 대비 비정상적 거래량’ 을 추적합니다.
즉, “세력이 본격적으로 움직이기 시작한 구간” 만 걸러내는 지표입니다.
노이즈가 많은 거래량 차트 속에서 의도 있는 거래의 흔적을 포착할 수 있습니다.
🚀 활용 예시
세력 매집 구간 포착 : 큰 매수 시그널이 반복적으로 발생하는 구간은 세력의 누적 매집 가능성을 의미함
단기 급등 신호 확인 : 매수 이상치가 발생한 직후 가격이 급등하는 경우가 많음
지지/저항 분석과 병행 활용 : 세력 매도 구간은 단기 저항으로 작용하는 경향이 있음
copyright @invest_hedgeway

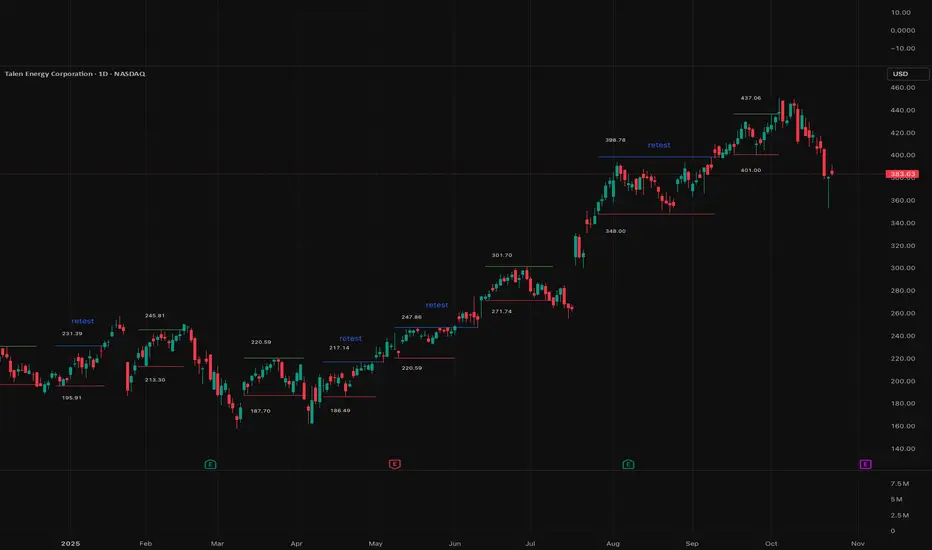
First X Days Of A YearFirst X-Day Indicator
Overview
The "First X-Day Indicator" is a powerful tool to visualize and analyze market sentiment during the crucial first trading days of each new year. It provides immediate visual feedback on whether the year is starting with positive or negative momentum compared to the previous year's close, a concept often related to market theories like the "January Effect" or the "First Five Days Rule."
The indicator is designed to be clean, intuitive, and fully customizable to fit your charting style.
Key Features
Yearly Baseline: Automatically draws a horizontal line at the previous year's closing price. This line serves as a clear 0% reference for the current year's performance.
Dynamic Background Coloring: For a user-defined number of days at the start of the year, the chart background is colored daily. Green indicates the close is above the previous year's close, while red indicates it's below.
Final Performance Symbol: At the end of the analysis period (e.g., on the 5th day), a single summary symbol (like 👍 or 👎) appears. This symbol represents the final performance outcome of the initial trading period.
Settings & Customization
You have full control over all visual elements:
Analysis Period: Define exactly how many days at the start of the year you want to analyze (e.g., 3, 5, or 10 days).
Line Customization: Fully control the yearly baseline's appearance. You can change its color, width, and style (Solid, Dashed, or Dotted) or hide it completely.
Symbol Customization: Choose any character or emoji for the positive and negative performance symbols. You can also adjust their size (Small, Normal, Large) or hide them.
Background Control: Enable or disable the daily background coloring and select your preferred custom colors for positive and negative days.

Darvas Lines/Box1. Overview
The Darvas Lines/Box (v1.0) is a dynamic trend following indicator based on the renowned method developed by Nicolas Darvas. It's designed to identify clear price consolidation ranges and detect decisive breakouts, crucial for positional and swing trading strategies.
This indicator automatically draws and adjusts the consolidation ranges, and includes modern enhancements such as Advanced Retest Confirmation and exposed alert conditions, providing reliable signals for monitoring and acting on trend continuations.
2. Core Features
Custom Display Mode (Lines/Box): Allows the user to toggle the visualization between showing just the Breakout Lines (Lines) or displaying the consolidation area with a filled background box (Box).
Source Selection (Wicks/Body): Users can choose whether the box boundaries are defined by the candlestick wicks (price extremes) or the candlestick body (open/close price). This feature is critical for adjusting sensitivity to market noise.
Dynamic Box Drawing: Draws Darvas boxes automatically by tracking price highs and lows based on user-defined parameters (Bars to Define Range, Max Box Height).
Retest Confirmation: Detects if the old resistance/support line functions effectively after a breakout. When a retest is confirmed, the line is extended and its color changes.
Price Labels (Stable Lock): Displays the highest and lowest box prices, fixed to the left outer edge of the box. This ensures stable visibility.
Progress Labels: Visualizes the current line price and the percentage distance to the closing price on the right side of the box, showing progress toward the next breakout.
3. Trading Strategy: How to Use the Indicator
This indicator is primarily used to identify trend initiation and trend continuation signals.
A. Entry Strategy (Breakout)
Long Entry Action: Consider taking a long entry when the price closes above the Upper Line (Green Line), signaled by a BULLISH BREAKOUT alert.
Signal: Use the BULLISH BREAKOUT alert.
Short Entry Action: Consider taking a short entry when the price closes below the Lower Line (Red Line), signaled by a BEARISH BREAKOUT alert.
Signal: Use the BEARISH BREAKOUT alert.
B. Retest Strategy (Add-on/Confirmation)
Action: When the price pulls back to touch the broken line (signaled by RETEST CONFIRMED), this confirms the break's validity.
Alert: The RETEST CONFIRMED alert is triggered at this moment.
C. Risk Management (General)
Stop Loss: The initial stop-loss is typically set just beyond the opposite side of the broken box. As the trend progresses and new boxes form, the lower boundary of the most recently formed box can be used as a trailing stop for managing risk.
4. Setting Parameters
Line Source (Wicks/Body): Crucial for sensitivity. 'Wicks' tracks price extremes; 'Body' tracks stronger close-to-close movements, ignoring noise.
Bars to Define Range: Defines the calculation period (in bars) for the box.
Cooldown Bars After Breakout: Sets the waiting period after a breakout before a new box can start forming.
Retest Lookback Bars (Phase 3): Sets the maximum number of bars to check for a retest during the cooldown phase.
Max Gap for Retest (%): Defines the maximum percentage distance from the line allowed to confirm a retest (Set to Zero (0.0%) for near-touch detection).
Alert Frequency (Breakout): Allows selection between Continuous and Once per Box for breakout signals.
5. Alerts: How to Set Up the Triggers
This indicator exposes several specific conditions to the TradingView alert panel, allowing you to select the exact event you want to monitor.
Step-by-Step Alert Setup:
Open the Alert Panel on the chart.
In the Condition field, select the indicator's name.
In the Alert Condition field, choose the specific event you want to monitor:
1. ANY DARVAS EVENT (Consolidated)
2. BULLISH BREAKOUT (Individual)
3. BEARISH BREAKOUT (Individual)
4. RETEST CONFIRMED (Individual)
In the Trigger field (Frequency), select your preferred native option (e.g., "Once Per Bar Close" or "Once per bar").
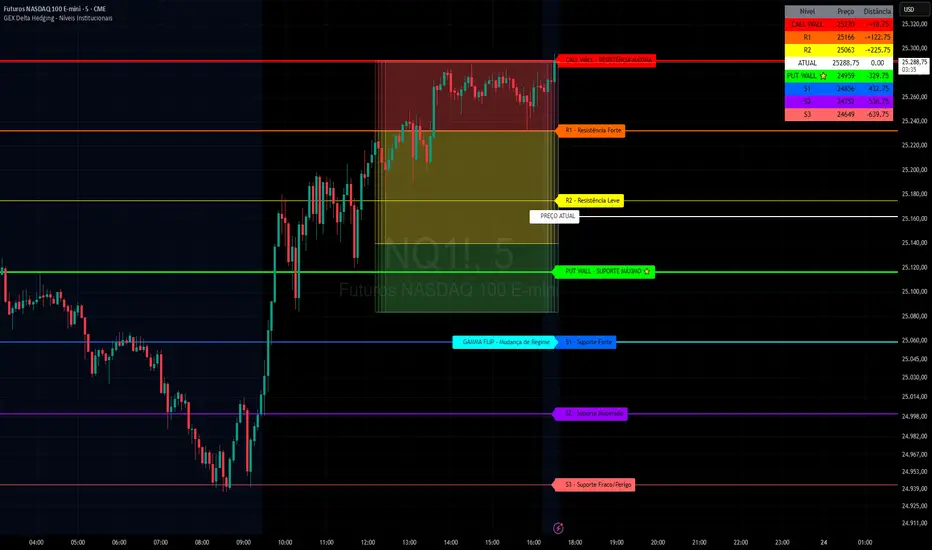
GEX Delta Hedging Lines - v.4.1GEX Delta Hedging Indicator - Institutional Levels
Introduction
This Pine Script indicator is designed to visualize Gamma Exposure (GEX) levels, Delta Hedging zones, and institutional support/resistance points on your TradingView charts. It helps traders identify key price levels where market makers and institutions might hedge their options positions, potentially leading to price reversals or continuations. The indicator overlays lines for resistances (Call Wall, R1, R2), supports (Put Wall, S1, S2, S3), a Gamma Flip zone, and customizable trading zones (Buy, Neutral, Sell). It also includes alerts for level breaches and a summary table for quick reference.
Key Features
Resistance Levels: Call Wall (maximum resistance), R1 (strong), R2 (light) – all configurable with colors, styles, and widths.
Support Levels: Put Wall (maximum support), S1 (strong), S2 (moderate), S3 (weak/danger) – fully customizable.
Gamma Flip Zone: Indicates potential regime changes in market behavior.
Trading Zones: Visual boxes for Buy (green), Neutral (yellow), and Sell (red) areas, with adjustable boundaries and colors.
Current Price Line: Dotted line for the reference price, with labels.
Alerts: Trigger notifications when levels are tested or broken.
Summary Table: Displays levels, prices, and distances from the current close, positioned customizable.
Style Options: Adjust line widths, styles (solid/dashed/dotted), label sizes, and more for a personalized view.
Kelly Wave Position Matrix 20251024 V1 ZENYOUNGA simple table is designed for use when opening a position. It applies the Kelly formula to calculate a more scientific position size based on win rate and risk–reward ratio. At the same time, it displays 1.65× ATR stop-loss levels for both long and short positions to serve as a reference for comparing with existing stop-loss placements.
Additionally, the table back-calculates the corresponding position size based on a 2% total capital loss limit, using the actual loss ratio. It also shows the current wave trend status as a pre-filtering condition.
Overall, this table integrates the core elements of trading — trend (wave confirmation), win rate, risk–reward ratio, and position sizing — making it an effective checklist before entering a trade. Its purpose is to help achieve a probabilistic edge and ensure positive expected value in trading decisions.

Power candle v5-------------------------------------------Power candle v5-------------------------------------------------------
-------------------------------------------Power candle v5--------------------------------------------------------------------------------------------------Power candle v5--------------------------------------------------------------------------------------------------Power candle v5--------------------------------------------------------------------------------------------------Power candle v5--------------------------------------------------------------------------------------------------Power candle v5--------------------------------------------------------------------------------------------------Power candle v5--------------------------------------------------------------------------------------------------Power candle v5--------------------------------------------------------------------------------------------------Power candle v5--------------------------------------------------------------------------------------------------Power candle v5--------------------------------------------------------------------------------------------------Power candle v5--------------------------------------------------------------------------------------------------Power candle v5--------------------------------------------------------------------------------------------------Power candle v5--------------------------------------------------------------------------------------------------Power candle v5--------------------------------------------------------------------------------------------------Power candle v5--------------------------------------------------------------------------------------------------Power candle v5--------------------------------------------------------------------------------------------------Power candle v5--------------------------------------------------------------------------------------------------Power candle v5-------------------------------------------------------

ten2 Multi MAThis powerful all-in-one indicator allows you to display three Exponential Moving Averages (EMAs) and three Simple Moving Averages (SMAs) on your chart from a single script. Save indicator slots and get a comprehensive view of market trends across different timeframes. Every moving average is fully customizable in length, colour, and source, giving you complete control over your technical analysis setup.
EMA Cloud + AlertsThe only EMA indicator you'll ever need.
- Flexible EMAs: Customize EMA lengths (e.g., 9, 21) to match your trading style.
- Dynamic Cloud: Auto-shades bullish (green) or bearish (red) clouds between EMAs for clear trend signals.
- Trend Change Alerts: Auto-alerts that signal when a trend change (EMA crossover) happens on the timeframe you're currently viewing.
- Timeframe Lock: Lock EMAs to a specific timeframe (e.g., 5m on a 1m chart) for consistent analysis.
- Personalized Design: Adjust EMA colors, thickness, and cloud transparency for optimal visibility.
A friendly reminder that no tool or indicator guarantees success. Integrate this into a robust trading plan.

Bitcoin Cycles Halvins/Tops/Bottoms By CrBeThis Script shows you the actual Bitcoin tops and bottoms dates.
