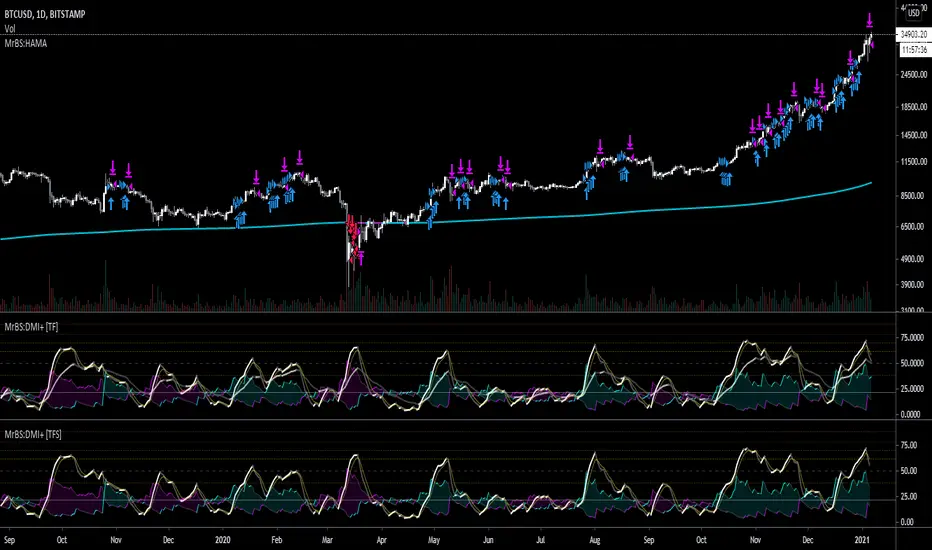
MrBS:EMA/SMA/HMA (Heikin Ashi Calc)This indicator allows you to base the MA calculation from Heikin Ashi values on normal charts and/or the real OHLC values while looking at Heikin Ashi.
There are 3 MA types you can select - EMA / SMA / HMA
The colour is based on the slope.
I made this to help me visualize my DMI+ strategy, when I was looking at taking signals from Heikin Ashi but looking at candlesticks. Turns out, I was going down the wrong road. Now I'm looking into using the real OHLC values for generating signals but watching the Heikin Ashi chart as I find it easier to see trends on it.
Hopefully its useful to some people, and if you have any suggestions for improvements I'd love to know.
Ohlc
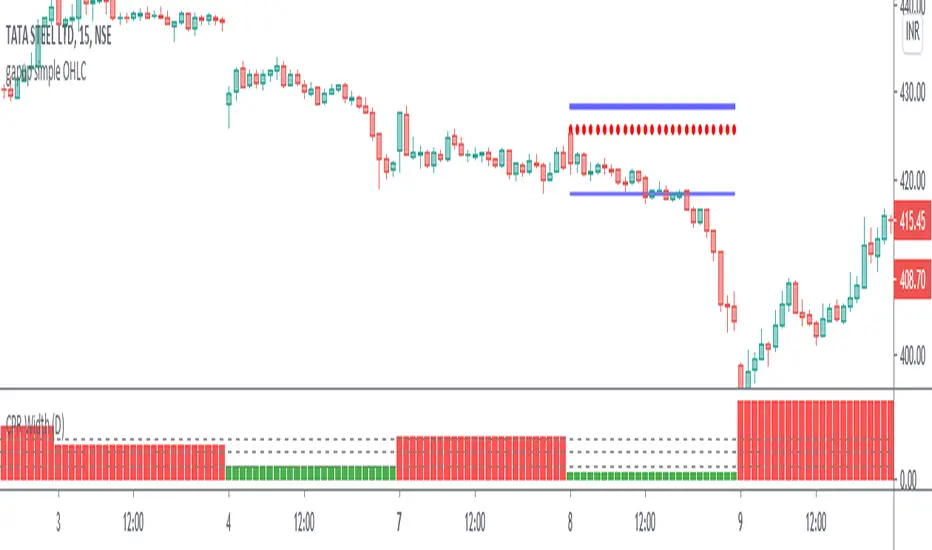
gapup simple OHLC OHLC means Open, High, Low and Close.
IFF,
Open = High. Go short. (Indicted with Red dotted line)
Open = Low. Go Long (Indicted with Green dotted line)
Using this concept with proper risk reward is the best way for intraday scalping trades with the correct time span for chart reading.
Always take a SL (stop Loss) with the previous day High & Low accordingly.
Either you go long or short,the best time to enter is 9.21-9.25am .
When you are going long,
if the candle breaks the prev day high (indicated by dark blue line) you can expect further up move.
When you are going short,
if the candle breaks the prev day low (indicated by faded blue line) you can expect further down move.
Disciplined trader :If you have missed the timings to enter please do not enter in between.wait for the next opportunity in some other day.
I want every trader to be successful for that you must be disciplined.
Enjoy the money rain.Happy Trading
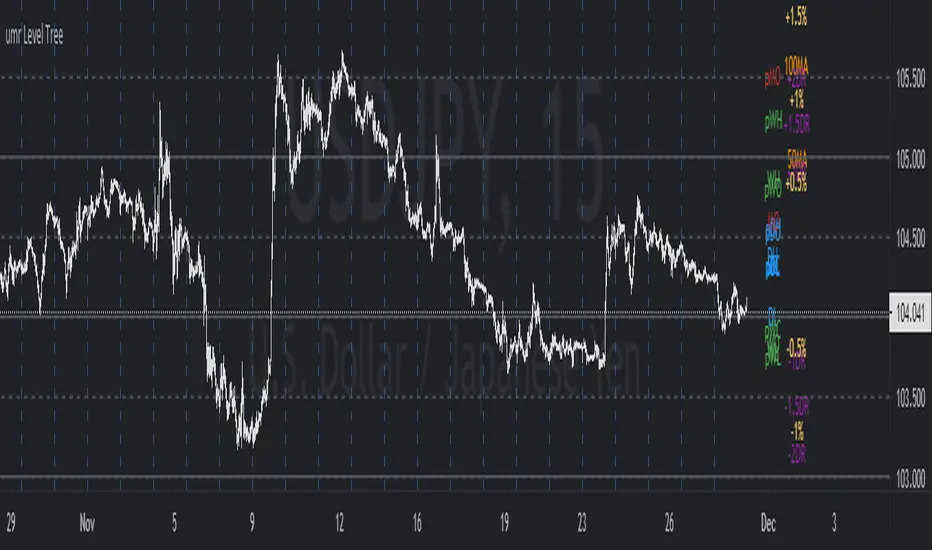
umr Level TreeShows following levels and labels (which can be individually controlled):
OHLC levels of Today, Yesterday, This week, Last week, This Month, Last Month
Daily Simple Moving Averages (50, 100, 200)
Horizontal Grid on 50, 100 pips for FX instruments.
(to do) Add ATR or Std Deviation
(to do) Add Daily Change levels % i.e. 0.5%, 1%, 2%
(to do) Add Daily change in pips levels (for fx) i.e. 50 pips, 100 pips etc
Sweet OHLCSweet OHLC is a tasteful and flexible take on displaying the OHLC data for the previous and current trading sessions.
Features include…
During Pre-Market Hours (midnight to market open)
Previous Day's High
Previous Day's Low
Previous Day's Close
During Market Hours (session hours)
Previous Day's High
Previous Day's Low
Previous Day's Close
Today's Open
Today's High
Today's Low
During Post-Market Hours (market close to midnight)
Today's Open
Today's High
Today's Low
Today's Close
Styling
Dark Mode
Adjustable line widths
Separate line styles for the previous day’s data and the current day’s data.

Yesterday's open, high, low and closeA very simple script to plot the yesterday's OHLC, to be used in an intraday graph.
There were other scripts like this, but their code was ugly, filthy, smelly, and WET, so I did this.

L1 Buy after Dump DetectorLevel: 1
Background
The so-called "Buy after Dump" refers to the phenomenon in which the stock price sometimes rebounds temporarily due to the rapid decline in the falling market. The rebound was smaller than the decline, and the downtrend resumed after the rebound.
Function
L1 Buy after Dump Detector is one of my research to see win rate of a "Buy after Dump" chance. The principle is that I use ema() and OHLC to model a whale dump behavior. After the dump wave, I use KDJ to indicate several long entry points.
Key Signal
dump --> whale dump signal
fundready --> it indicate the end of a dump and make fund ready to long entry
longentry --> long entry signal generated from KDJ resonating with dump and fundready signal
Pros and Cons
Pros:
1. it can detect obvious dump and depict the decay of dump wave
2. use resonance to generate long entry
Cons:
1. it may be risky to "buy after dump" which may require take profit method here because the opportunity may be very short
2. KDJ is too sensitive in large time frame and have many long entry signals (the closer to dump wave, the better based on experience)
Remarks
Very interesing stuff, but rare of people trade with such crazy method. I suggest this is ONLY for backtest study of market behavior.
Readme
In real life, I am a prolific inventor. I have successfully applied for more than 60 international and regional patents in the past 12 years. But in the past two years or so, I have tried to transfer my creativity to the development of trading strategies. Tradingview is the ideal platform for me. I am selecting and contributing some of the hundreds of scripts to publish in Tradingview community. Welcome everyone to interact with me to discuss these interesting pine scripts.
The scripts posted are categorized into 5 levels according to my efforts or manhours put into these works.
Level 1 : interesting script snippets or distinctive improvement from classic indicators or strategy. Level 1 scripts can usually appear in more complex indicators as a function module or element.
Level 2 : composite indicator/strategy. By selecting or combining several independent or dependent functions or sub indicators in proper way, the composite script exhibits a resonance phenomenon which can filter out noise or fake trading signal to enhance trading confidence level.
Level 3 : comprehensive indicator/strategy. They are simple trading systems based on my strategies. They are commonly containing several or all of entry signal, close signal, stop loss, take profit, re-entry, risk management, and position sizing techniques. Even some interesting fundamental and mass psychological aspects are incorporated.
Level 4 : script snippets or functions that do not disclose source code. Interesting element that can reveal market laws and work as raw material for indicators and strategies. If you find Level 1~2 scripts are helpful, Level 4 is a private version that took me far more efforts to develop.
Level 5 : indicator/strategy that do not disclose source code. private version of Level 3 script with my accumulated script processing skills or a large number of custom functions. I had a private function library built in past two years. Level 5 scripts use many of them to achieve private trading strategy.

Period ChangePeriod Change shows the percentage price change on a selected time period. This is an alternate way of looking at OHLC change.

Relative CandleThis script visualizes the relative movement of a single OHLC candle compared to an index (or another symbol). The vertical location of the candle indicates the general positive/negative comparison of the bar vs the index. The color of the candle indicates how the candle moved relative to the index. The wick indicates the closing range compared to the index (did the symbol close at lows of the bar while the index closed at highs).
The area graph in the background shows the average relative close over a 10-day simple moving average.
I use this to pop any behavior that is out of line with the market, whether positive or negative. For example, is a red bar day due to the market pullback or something specific to the stock. Or did the market pull back and the stock did the opposite, strong day!

Structures OHLCThis will mark the:
Previous month OHLC
Last week OHLC
Current week open
Yesterday OHLC
2 days ago OHLC


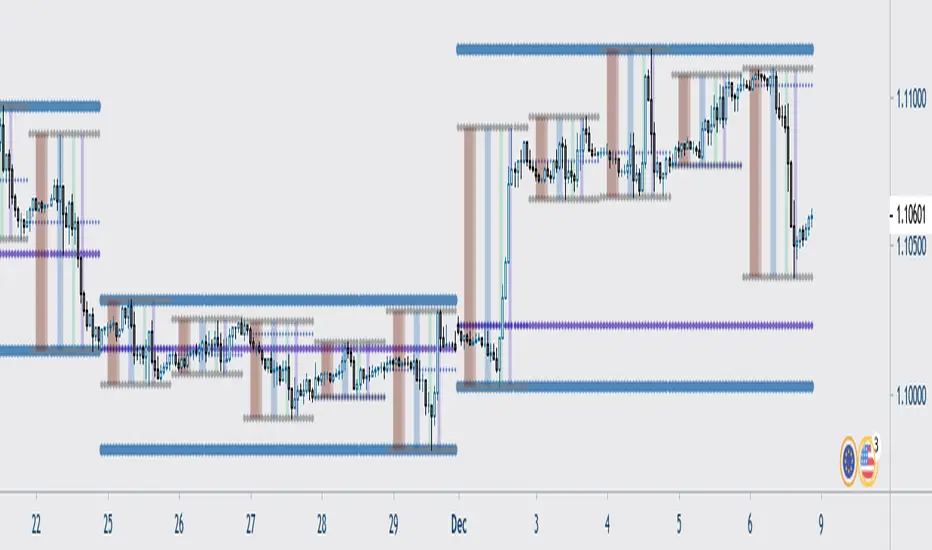
Oasis Group - VWAP / OHLC (Daily / Weekly / Monthly)
5min with the Daily overlay
4hour with the Weekly overly
This Script was influenced be Chris Moody's OHLC Script.
I have created my version of the script and used it to Overlay Daily/Weekly/Monthly Candles over any chosen Intraday Time Frame.
**Important**
The "Stepline" Line style function in pine script is defective so anyone who wants to use this must change all line
styles to "Stepline" manually except for the VWAP Line.
This gives traders a great overall candle experience and also insight into the noise of the intraday.
Intraday traders can keep watch of the highs and Lows along with open and close levels for the larger time frames chosen.
Give us a Follow and Like. This can be used on any Asset class.
I personally use this on Intraday Trading.
Helps me Identify the Prior day Highs and Lows, Closing price compared to the next mornings Opening Price, and daily, weekly, or monthly ranges.
Also included is the powerful VWAP indicator for identifying bullish or bearish pysche.

Yearly OHLplots Yearly Open, High, Low levels
Interesting interactions to note at previous yearly opens

PivotBoss Pivots & Camarilla - H,D,W, M timeframe & OHLC LabelsThis is the new pivotboss pivots calculations and also has Camarilla Pivots . User can define which time frame pivots they want to see starting from Hourly, Daily, weekly and monthly. Added labels for each levels. So that user can calculate potential profit targets. This script also includes Hourly and Daily OHLC with labels. Added Developing mid point of the current day. The script can calculate midpoint as and when new highs and lows are made through out the day
Abbrevations used in this script
yHI - Yesterday's session High
dOP - Days open
yCL - yesterday's session Close
yLO - yesterday's session Low
MP -- Developing midpoint of the day
TC - Top channel
P - Pivot Point
BC - Bottom Channel
R1 - R4 -- Resistance levels
S1 - S4 -- Support Levels

BEST Supertrend MAHello traders,
That one is an experiment
I was curious to see what a supertrend based on moving average cross could give
How does it work?
Bull event: fast moving average crossing over the slow moving average
Bear event: fast moving average crossing under the slow moving average
When the event is triggered, the script will plot the Supertrend as follow
UP Trend = ohlc4+ ATR * Factor
DOWN Trend = ohlc4- ATR * Factor
Interesting to see the results given by ohlc4 vs hl2 and hl3
Documentation: www.tradingview.com
This is an alternative of the classical Supertrend based on candle close being above/beyond the previous Supertrend level.
Hope you'll enjoy it and it will improve your trading making you a better trader
Dave

Ledger Status ToolboxI use a few things very frequently:
Multiple moving averages
OHLC on various timeframes
This allows you to use both, and toggle several settings.
You can enable multiple moving averages (up to 4) and use SMA, EMA, or ALMA styles and choose from which timeframe they show (this can be useful but also choppy).
You can enable OHLC info for daily, weekly, or monthly views.'
You can enable Bollinger Bands with a checkbox.
This script combines all of that.
I have a ton of stuff I'd like to do with this, but I've used it this way for a long time now, and figured I'd share it.
Crypto Daily-Weekly Range + KZsWeekly OHL + Daily OHL + Intraday Killzones
For markets that open the daily candle at 12AM UTC

Daily-Weekly Range + KZsWeekly OHL + Daily OHL + Intraday Kill zones
For markets that open daily candle at 10pm UTC
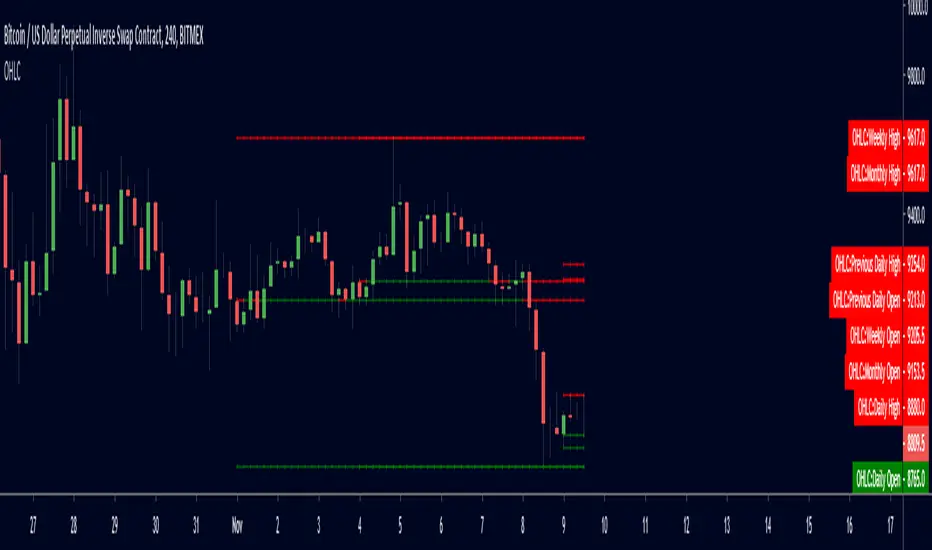
Simple OHLCSimple OHLC containing daily, previous daily, weekly and monthly levels. Hides past levels to keep chart clean.
Colors levels red if current price is below level and green if current price is above level.
Periodic CandleI have developed this indicator to be able to see the current day's candle. You can use any period that supported by TradingView. You can even shift the candle and plot the past days (period) candle.
Disclaimer: This is not financial advice
Trade safe,
Atilla

Manual Pivot Points & OHLCPresented is a simple script which allows you to input data directly from external sources manually. The lines are colour coordinated and can be suited for your own need.
Why this script? Many traders rely upon official pivot point values and close prices published on external third-party websites. This script allows you to quickly input your costs, as well as hide when analysing your chart.
You no longer have to worry about accidentally moving lines with your cursor.

Pumpenomics Price-action Levels (OHL M)Simple price-action levels in regards to the OHL and M levels.
Levels available:
Open (Orange)
High (Green)
Low (Red)
Middle [ /2] (Aqua)
Timeframes available:
1H, 4H, Daily, Weekly, Monthly, Quarterly, Yearly
Enjoy!
-
Inspired by Long Term Levels (4h, D, W, M, Q, & Y) by scarf

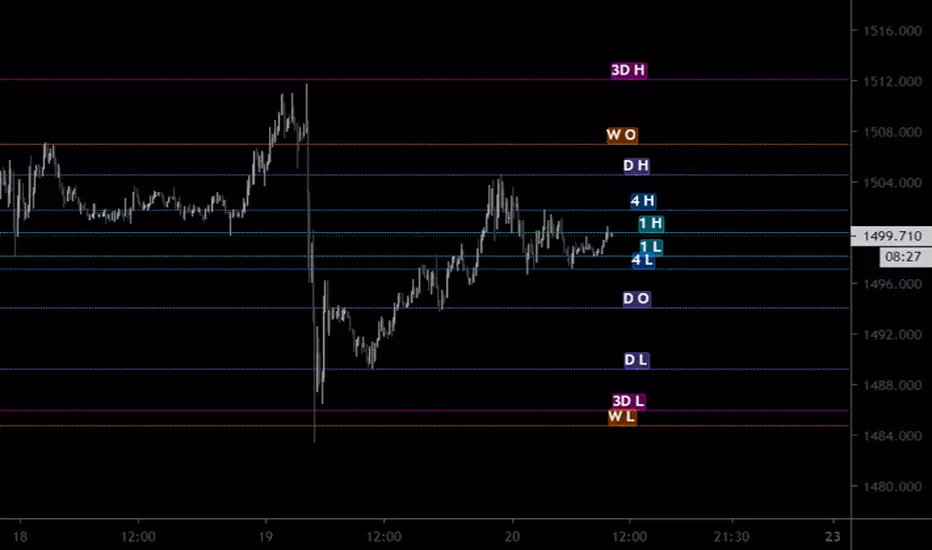
[AU] Price Action Levelsv2a
Price action levels for multiple timeframes with standard alignment and offset options using modulus for stagger and spacing
1hr, 4hr, D, 3D, W, M, Quarter, Year timeframes and levels available
Based upon Long term levels by scarf()
Candle (High/Low/Close)-MTF [Anan]
Hello Friends,,
This is just multi time frame candle plot (High / Low / Close) on your current chart resolution.
