normalize_heatmap
Description:
This was a simple indicator to indicate the heatmap area of an asset price, in a relative given time period. In default the lookback period was set to 50 bars, indicating the current state of the price within the previous lookback period. The color scheme was using the rainbow palette, which set blue as the cooling-off area, and red as the heating area. The indicator doesn't take into account momentum strategy and thus doesn't consider the future direction of the asset price. Note: cooling-off area, can be considered to entry or adding position as a DCA strategy.
Data Normalize:
norm = (x - min) / (max - min)
Feature:
Heatmap color condition
Weighted Moving average (Additional)
Normalization

Feature scalerFeature scaler | Pine Utilities series, ready to be used in "study-on-study" fashion |
Includes min-max, normalization, standardization and unit length scaling.
One and only source: en.wikipedia.org
Endpoint inputs allow to set an interval of interest for min-max scaler.
Can be (and should be) applied to other studies, or to the chart itself. In this example, I applied min-max scaling to weighted linear regression's slope values.
Unfortunately, "All data" is still "experimental" and works only on charts where less than 5000 bars are available. max_bars_back() didn't help.
Sup TV

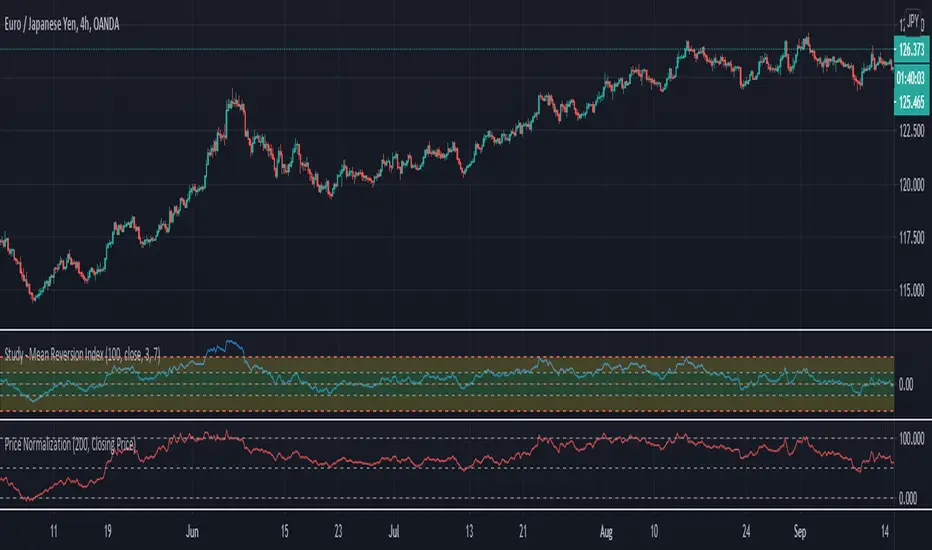
Closing Price NormalizationIndicator title : Price Normalized
Description : The indicator is a variation of %k Stochastic where it use highest/lowest closing price to define the range instead of highest high/lowest low,
the range also excluded current bar so that break above 100 or below 0 means current bar closing price breaks above highest/below lowest the closing price in the past 200 bars (default setting)
Simplest way to interpret the indicator is that as price retraced downward while indicator still above 50 value, it means the closing price still traded on the upper side of last 200 bars range
Warning: While the indicator assume similar characteristic as Stochastic Indicator, its is not meant to be used to determnine ovebought/oversold zone.
Disclaimer:
I always felt Pinescript is a very fast to type language with excellent visualization capabilities, so I've been using it as code-testing platform prior to actual coding in other platform.
Having said that, these study scripts was built only to test/visualize an idea to see its viability and if it can be used to optimize existing strategy.
While some of it are useful and most are useless, none of it should be use as main decision maker.
© fareidzulkifli
%G OscillatorIntroduction
Rescaling often involve bringing a series of values in a certain range, there have been many rescaling methods proposed in technical analysis such as the stochastic oscillator, relative strength index or the William %R to name a few. Rescaling the price allow the user to see when the security is overbought or oversold, in the case of the stochastic oscillator it can also determine the price position relative to the highest and lowest price over a user defined period window.
Computing highest and lowest over a certain period window involve calculating what is called a rolling maximum/minimum, those calculations have tried to be efficient but they can still remain relatively complex. This is why i propose a similar rescaling indicator that don't use rolling maximum/minimum for its calculation, the indicator can be interpreted like the stochastic oscillator since they are similar.
The Indicator
The indicator is based on the current price position relative to past observations, for example, if the indicator is equal to 80, this mean that the current price is greater than 80% of the k past observations, where k = 1, 2, 3...length .
The indicator offer many benefits such as a custom rescaling range, unlike the stochastic oscillator this step is directly integrated in the core calculations of the indicator, this can be done by changing the code in line 7 :
a = src > src ? Max : Min
where Max should be the maximum value of the indicator and Min the minimum value, therefore the indicator would lay in a range of (Max,Min).
here the indicator is in a range of (5,2), this mean that :
a = src > src ? 5 : 2
Conclusion
I proposed an alternative to the stochastic oscillator. Both indicators return similar results, advantages of the proposed indicators are its simple calculation and its ability to return custom ranges. I hope it find its use in the community.
Thanks for reading !

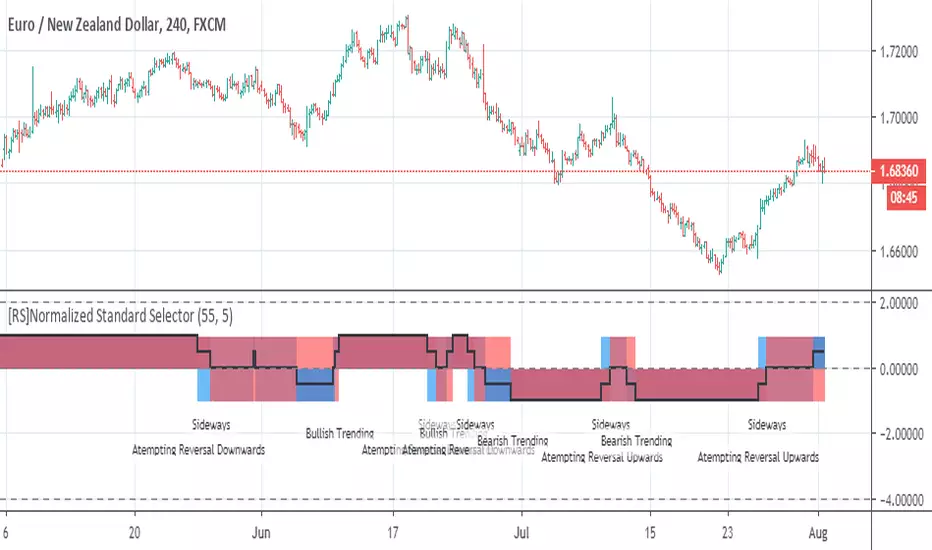
[RS]Normalized Standard SelectorEXPERIMENTAL:
market state, text says it all most of the time at least.
The Normalizer [BVCC]The Normalizer adds an indicator to your chart with the option to view regular Volume, normalized Volume or normalized price.
Normalized Volume divides the current Volume bar into a moving average and multiplies by 100. The resulting plot is a histogram showing how far above or below the moving average that volume bar was.
Normalized Price does the exact same thing, but uses the close price of the current candle.
The result of a normalized bar chart is that sometimes activities of unusually low or high patterns can be seen that are not obvious when looking at the standard data points.
Customizable Settings include;
1) Check/Uncheck the first box to set the view to Volume or Price
2) Check 'Normalize' when on Volume to toggle between standard Volume and Normalized Volume
3) Price is always Normalized
4) Normalization is calculated from the SMA and the default is set to 9 - John Bollinger suggest setting this to 50
5) Normalization period can be set with the 'Period' option
This indicator was created for members of the BVCC trading community as an example of the normalization methods described in John Bollinger's "Bollinger on Bollinger Bands". Mr. Bollinger talks extensively about normalization and specifically volume normalization. I added the price normalization as a fun bonus just because. :)

TA-CCI (Trend Denormalized CCI)The idea is to account for the trend on the CCI calculation. On trade systems it is intended to be used in the same way as the original CCI.
