Multi Straddle-Strangle ChartThis powerful indicator is designed for options traders who want to visualize and track the combined premium of multiple straddle and strangle strategies in a single, dedicated pane.
Quickly analyze and compare up to five different options strategies at a glance, directly on your chart. This tool is perfect for monitoring volatility, tracking potential profits/losses on a position, and spotting key support and resistance levels based on option premiums.
Key Features:
Plot Up to 5 Strategies: Simultaneously plot any combination of up to 5 straddles or strangles.
Real-Time Data: Fetches live data for both Call and Put options to give you an up-to-the-second view of the combined price.
Dynamic Symbol Generation: Automatically detects the underlying symbol (e.g., NIFTY, BANKNIFTY, stocks) and builds the correct option symbols based on your input.
Customizable Inputs: Easily configure the expiry date, strike prices and line colors for each of the 5 lines.
In-Chart Summary Table: A clean and clear table in the corner of your chart provides a quick summary of each enabled strategy and its current price.
Important Note on Usage:
This tool requires you to input a strike price in all fields, even if you do not plan to use all five lines. This is necessary because of a fundamental rule in the Pine Script language: every input must have a constant, non-empty default value. The indicator is optimized to only fetch data for the lines you have explicitly enabled with the "Enable Line X" checkbox.
Nifty50

Index investingThe Index Investing indicator simplifies decision-making for adding to Index ETF's Long-term investments. By utilizing a percentage discount methodology, it highlights potential opportunities to enhance portfolios. This straightforward tool aids in identifying favorable moments to invest based on calculated price discounts from selected reference points, making the process more systematic and less subjective.
🔶 SETTINGS
Reference Price: Choose between 'All-Time-High' or 'Start of the Year' as the basis for calculating discount levels. This allows for flexibility in strategy depending on market conditions or investment philosophy.
Discount 1 %, Discount 2 %, Discount 3 %: These inputs define the percentage below the reference price at which buy signals are generated. They represent strategic entry points at discounted prices.
🔶 Default Parameters
The default parameters of 4.13%, 8.26%, and 12.39% for the discount levels are chosen based on the average 5-year return of the NSE:NIFTY Index, which stands at approximately 12.39%. By dividing this return into three parts, we obtain a structured approach to capturing potential upside at varying levels of market retracement, providing a logical basis for the selected default values.
Users have the flexibility to modify these parameters, tailoring the indicator to fit their unique approach and market outlook.
🔶 How Levels Are Calculated
Discount levels are calculated using the formula: Discount Price = Reference Price * (1 - Discount %) . This succinct approach establishes specific entry points below the chosen reference, such as an all-time high or the year's start price.
🔶 How Are the Buy Labels Generated
Buy signals are generated when the market price(Low of the candle) crosses under any of the defined discount levels. Each level has a corresponding buy label ('Buy 1', 'Buy 2', 'Buy 3'), which is activated upon the price crossing below the specified discount level and is only reset at the beginning of a new year or upon reaching a new reference high, ensuring signals are not repetitive for the same price level.
🔶 Other Features
Alerts: The indicator provides alerts for each buy signal, notifying potential entry points at their defined discount levels. The alert triggers only once per candle.
Year Marker: A vertical line with an accompanying label marks the start of each trading year on the chart. This feature aids in visualizing the temporal context of buy signals and reference price adjustments.

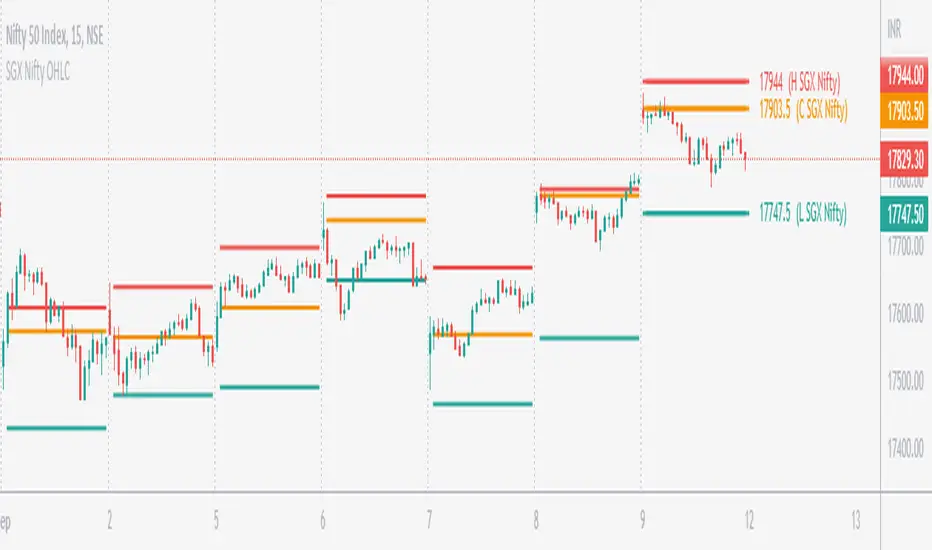
SGX Nifty OHLC for Nifty 50 IndexSGX Nifty OHLC for Nifty 50 Index
What is this Indicator?
• This indicator calculates the OHLC levels of SGX Nifty.
How does SGX Nifty impact NIFTY and the Indian Market?
• Helps in predicting NIFTY50 Index behavior.
• The closing price of today's 9.14 am (IST) SGX Nifty will be the Open of today's Nifty50 Open. This helps to determine the opening Gap of Nifty50.
• SGX Nifty OHLC levels can act as support and resistance in Nifty50.
Who to use?
• Beneficial for Day Traders, who trade in NIFTY Index.
What timeframe to use?
• Use 1 minute for better accuracy.
• Other timeframes will also work.
Important Note
• Use 1 min timeframe for accurate OHLC.
• In other timeframes OHLC will have negligible difference, it won't be huge.
• This indicator will appear only on NIFTY Index and Futures chart.
• To hide the warning label go to the indicator Menu.
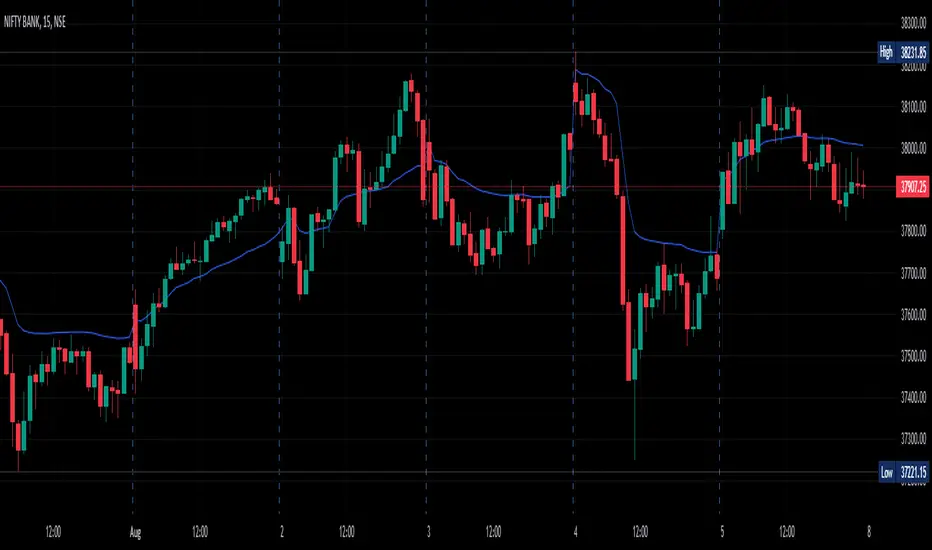
VWAP For NIFTY & BANKNIFTY [Zero54]NIFTY and BANKNIFTY Being Index do not have VWAP (because there is no volume generated). This is a simple script that displays NIFTY's future VWAP on NIFTY's Spot chart and similarly, displays BANKNIFTY's future VWAP on BANKNIFTY's sport chart. Fast and quick. Just few lines of code. No hefty un-necessary calculations.
No settings necessary. The script automatically detects NIFTY and BANKNIFTY and displays the corresponding VWAP.
Enjoy and share the knowledge. If you love this script, please boost/love this script and add a comment. Cheers!
NSE:NIFTY
NSE:BANKNIFTY
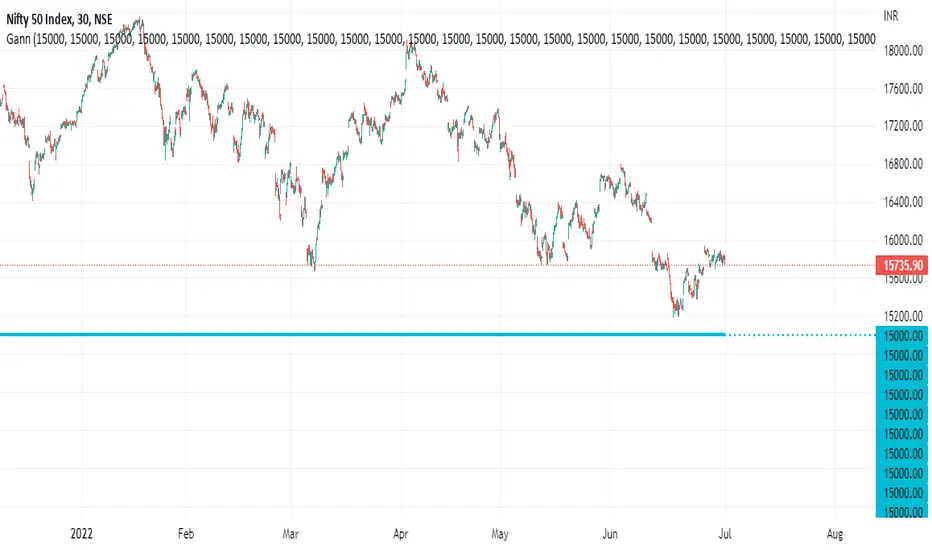
Gann Levels For Nifty Gann Levels for nifty 50 is very important to trade in options. so i create 50 gann levels for intraday trading.
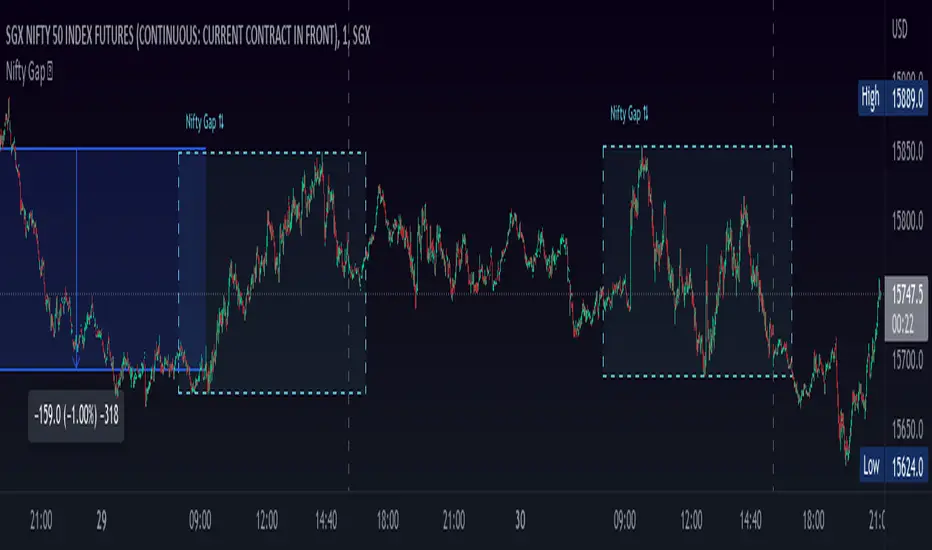
Nifty Gap ⇅This indicator help to find NIFTY gap up or gap down opening,
use this indicator on SGX NIFTY
Top 40 constituents of Nifty50Displays real-time candles of top 40 constituents of Nifty50 for a given time frame, side-by-side. This gives an overall idea of breadth and depth of market movements in the time-frame.
Please note that, this is not a standard chart rendered bar-wise and may take time to load as it requests multiple securities. You could modify the contents, from settings, to include stocks from your portfolio or indices of different sectors.
NSE:NIFTY
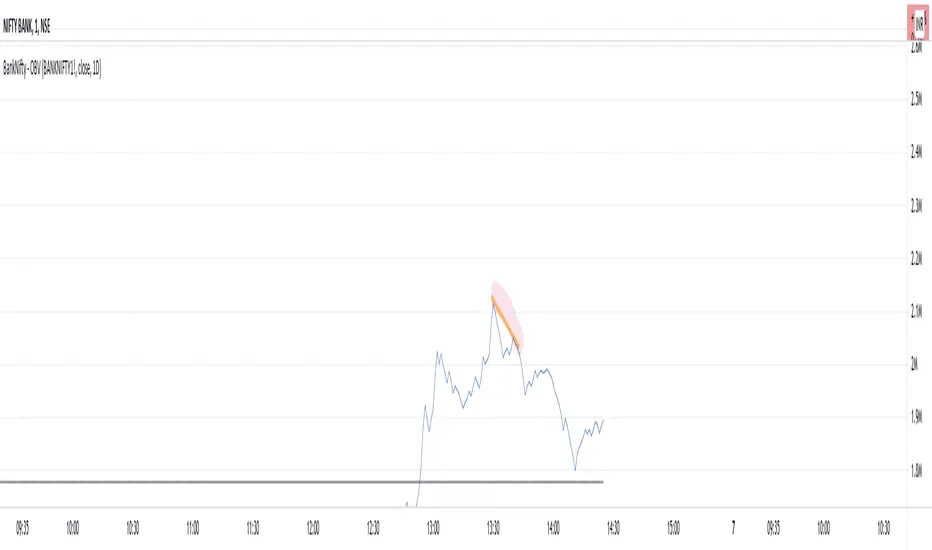
BankNifty - OBVThis script tries to draw OBV for BankNifty using Futures Volume along with Average OBV. For Nifty50 just change the Futures Volume symbol in settings. Look at devations in Price vs OBV or Average OBV breakout.
NSE:NIFTY
NSE:BANKNIFTY
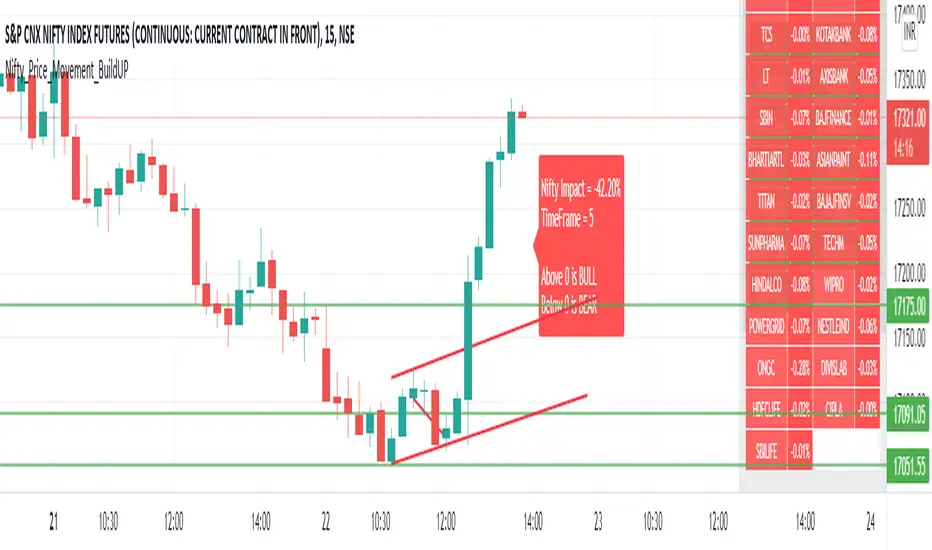
Nifty_Price_Movement_BuildUPDashboard to see Price Momentum Build-Up at Nifty.
It cumulates all prices and their respective weightage.
During initial of a candle, we are not aware of volume is High or Not, we only get it in later buildup. But Price buildup will display it at the same instant that what is going with the price of all stocks.
The logic used here is that
1) If a stock close > open at a particular instant it will add that stock multiplied with its weightage in Nifty to the list of stocks that are positive.
2) If a stock close < open at a particular instant it will add that stock multiplied with its weightage in Nifty to the list of stocks that are negative.
3) Above two will give you data that how many of them are positive and are negative at a particular instant and how they are going to affect Nifty.
In one of the many possible ways, it is superior than that of Volume buildup is that, to determine volume is higher than previous volume, we have to wait for first few seconds/minutes/hours (depending on timeframe you are in) to see volume buildup. The Volume buildup function based indicator is kind of lagging, though volume itself being instant.
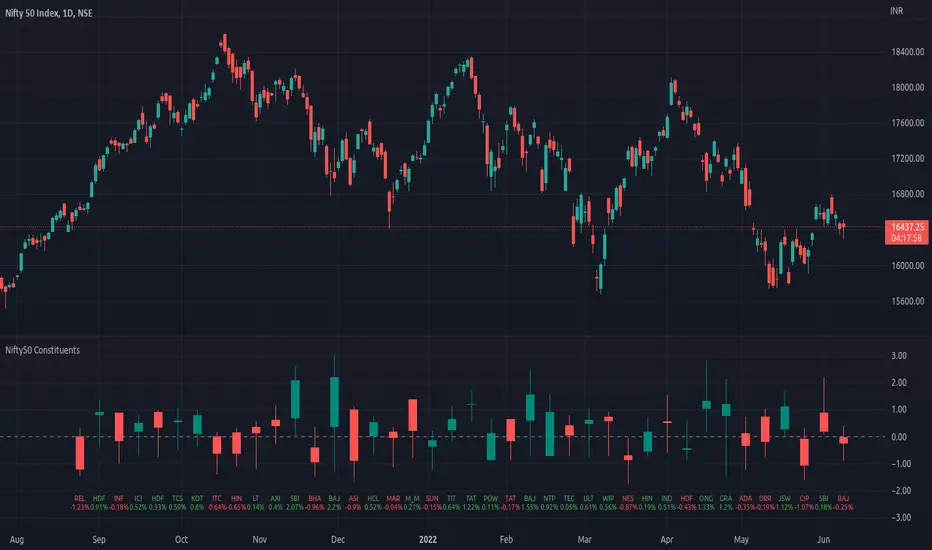
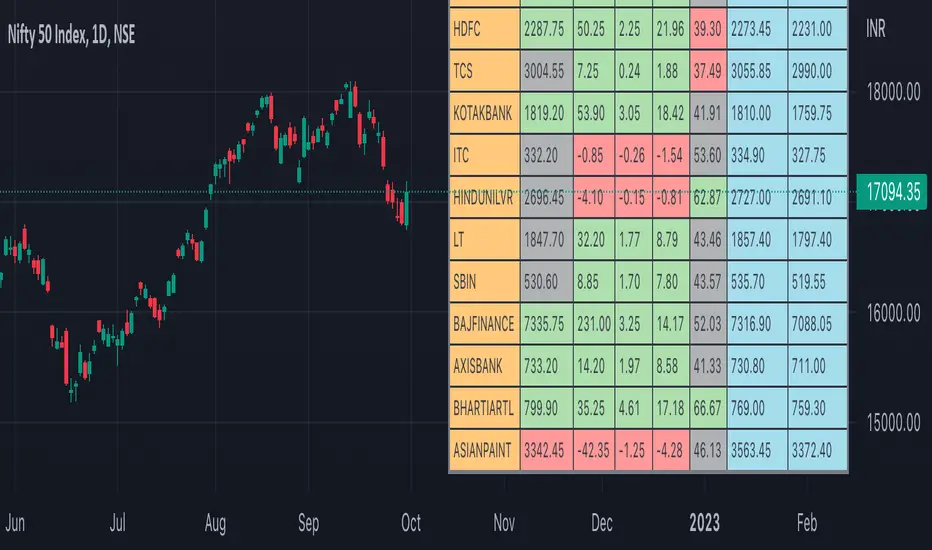
Nifty50 Participants - Top 25Nifty50 Index is calculated based on the movements of its participants. Every time you think of why is Index going up/down, who is actively dragging the index either ways, this Indicator gives you answer for the same in realtime!
This indicator will help you in pre-planning your trades based on the movements shown by different stocks of various sectors in Index calculation.
RSI column is an add-on to the participation table which will help you in getting RSI values of different stocks of Nifty 50 at a glance. You will see values getting updated in realtime in live market.
Checkout for customisations in indicator settings.
Note:
1. Participants present in this indicator and their participation percentage is taken from the official NSE website.
2. Table shows Top 25 participants by default. If you want to see less than 25 rows, you can update the input via indicator settings.
Feel free to contribute/comment changes if any! Comment in case of any suggestions :)
- Published by Soham Dixit
Bank Nifty ParticipantsBankNifty Index is calculated based on the movements of its participants. Every time you think of why is Index going up/down, who is actively dragging the index either ways, this Indicator gives you the answer for the same in realtime!
For example : You see HDFCBank and Kotak Bank significantly up while all other banks going down but index reacting in a bullish mode, the answer lies in which Bank is contributing how much to the index! This will help you in pre-planning your trades based on the movements shown by different banks in Index calculation. Or on the other hand, you see HDFCBank on verge of breakout and you have target of 10 points, this indicator will help you in identifying how much the index will react to the 10 points movement shown by HDFC Bank which is the leading participant in Bank Nifty.
RSI column is an add-on to the participation table which will help you in getting RSI values of different banks at a glance. You will see values getting updated in realtime in live market. Checkout for customisations in indicator settings.
Note : Participants present in this indicator and their participation percentage is taken from the official NSE website.
Feel free to contribute/comment changes if any!
- Published by Soham Dixit

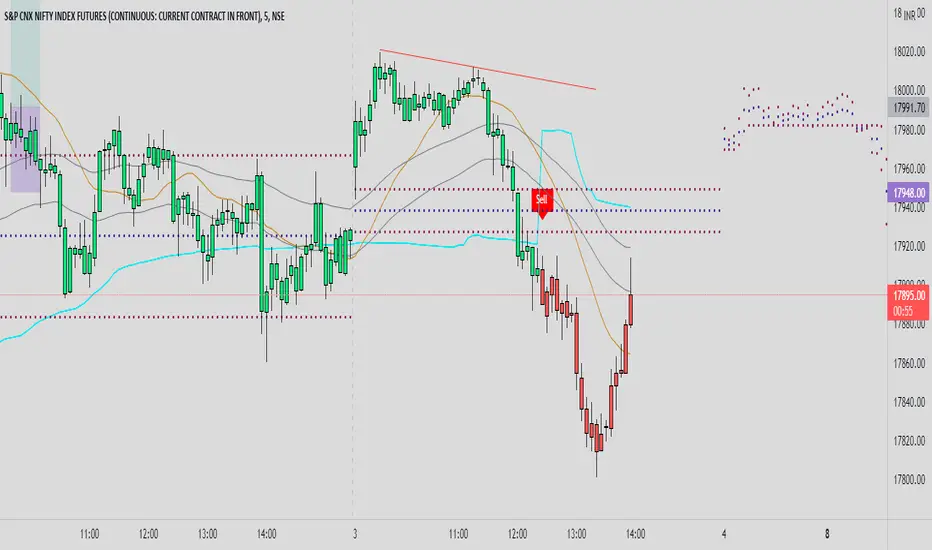
nifty_alchemistTimeframe : 5 Min
*When Indicator show Buy signal look only for buy entries at CPR and 50 EMA High and low
*When Indicator show Sell signal look only for sell entries at CPR and 50 EMA High Low
for any quieries contact on twitter @nifty_alchemist
[CP]Pivot Boss Floor Pivots with ATR Dilation and Dynamic LevelsINTRODUCTION:
Compared to all the Pivot Indicators available on Trading View Public Library, this Floor Pivots Indicator differentiates itself in two major original ways:
Dilates the Pivot Support/Resistance Levels into Support/Resistance Bands based on volatility
Displays the S/R Levels Dynamically , that is, only those levels will be shown that are close enough to the price resulting in much cleaner looking charts.
There were a few features whose logic I had figured out, but I could not implement them due Pine Script’s Limitation (they should really work on increasing Pine Script’s capacity instead of adding more and more features to the language in order to make it look ‘better’):
Showing multiple timeframe pivots at the same time (not possible due to Pine Script’s limitation on the ‘Max Number of Outputs’ )
Automatic Detection of highly profitable Double Hot Pivot Zones (DPZ), also due to the ‘Max Number of Outputs’ limit
GENERAL USER INPUTS:
Most of the settings are self-explanatory, however, a few of them need some explanation:
Show Floor Pivots Dynamically – This will turn ON the dynamic pivot levels, please note that this function will work ONLY IN INTRADAY timeframes.
Dynamic Pivot ATR Period – Period over which the ATR value is calculated to show the pivots dynamically.
ATR Threshold for Dynamic Floor Pivots – Simply put, the indicator will start displaying Pivot Levels if they fall within the 2*ATR distance (default value) of the price. You can increase this number if the volatility increases and vice-versa.
Use ATR to Dilate Intraday Pivot Levels – This will turn ON Floor Pivot Dilation, turning pivot ‘lines’ into ‘bands’ .
ATR Dilation Factor – This number decides the width of the Pivot bands. Larger this number, thicker the bands. Typically, high volatility stocks will require a higher number.
ATR Period – Same as Dynamic Pivot ATR Period, but for Pivot Level Dilation.
INDICATOR USAGE EXAMPLES:
This indicator works great in conjunction with my Pivot Boss Candlestick Scanner indicator.
There are a lot of optimizations I have done in the code, although it looks trivial at first glance, but it's fairly complex.
Feel free to use it and modify it as you wish.
Here are a few examples where the indicator has shown great entries and exits, with the default settings:
NIFTY 5m Chart
Reliance 5m Chart
Tesla 5m Chart
Bitcoin-USDT 15m Chart
FINAL WORDS:
Please understand that I have Cherry Picked the examples to showcase the capability of the indicator and its usage.
DO NOT conflate the accuracy of examples with the accuracy of this indicator.
Once you start using floor pivots, you will realize that a lot of days simply don’t give any high probability setups and you will simply sit out of the market and do nothing (which is a good thing).
If you really want to learn how to use Pivots, read the book ’Secrets of a Pivot Boss’ . This book can change your life.

Nifty strike price 2/3σ Calculates the strike prices for the Nifty50 index in steps of 50 and marks the 2 and 3 sigma price levels.

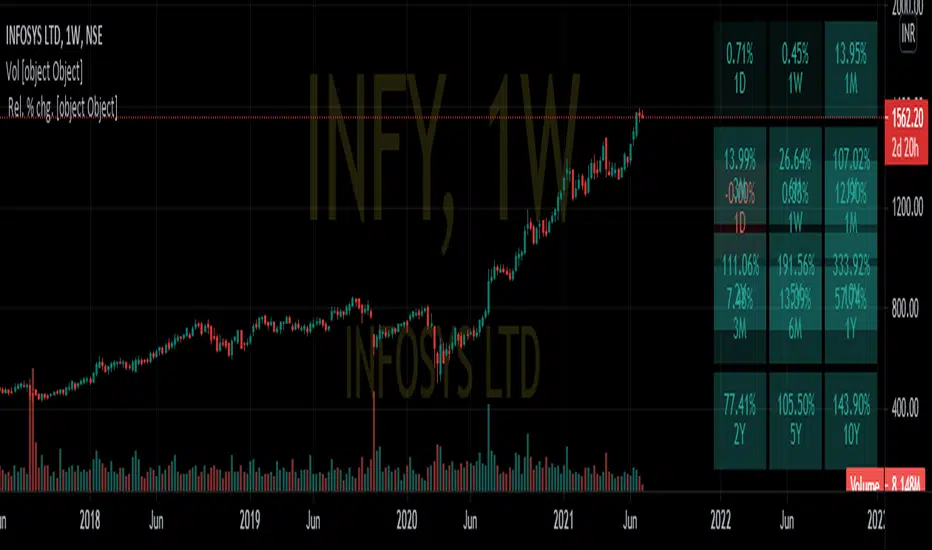
Nifty Relative PerformanceDISCRIPTION:-
This indicator is used to determine relative performance of a stock based on different time intervals as well as compared to benchmark indices as Nifty 50,Nift IT, Nifty auto etc.
USE CASE SCENARIO:-
The top right table provide performance of stock based on different interval
while the bottom table depicts its relative performance compared to an index
eg:-
INFY compared to Nifty 50
&
INFY compared to Nifty IT
DISCLAIMER:-
if using an android device kindly toggle full-screen mode and view it horizontally
In desktop full screen mode may provide better comprehensive view
BankNifty - VWAP + StdDev Bands- By Default the script draws Daily VWAP for Bank Nifty based on Futures Volume or underlying Index Stocks based on user input
- Optionally one may Anchor it to Week/Month etc or anchor it from a particular Time.
- It also draws 3 Standard Deviation Bands from the VWAP based on User Input.
- Optionally draws Previous VWAP Close for and Bullish or Bearish Move.
- It works with NIFTY 50 as well but only using Futures Volume(Pine limitation to number of security calls) . Please change the Symbol and Futures Volume symbol to "NSE:NIFTY" and "NSE:NIFTY1!" NSE:BANKNIFTY NSE:NIFTY

Screener: Alpha & Beta IndexThis is a Index Screener which can short list the major Sectors contributing to NIFTY movement that day.
This helps in sector based trading, in which we can trade in the stocks which falls under that particular sector.
No need to roam around all the stocks in the whole watchlist.
It is recommended to create sector wise watchlist of all sectors. It will be easier to concentrate in only one sector.
For example in IT sector index there are certain stocks which contribute to the movement of IT sector.
This will be available in NSE (or exchange website).
For detailed description check out the descriptions in my previous 2 Alpha and Beta indicators.
Combine and use this screener with my previous Alpha & Beta indicator.

Nifty 20 VolumeThis script computes the volume for Nifty 50 index. I am using top 20 stocks here that constitute about 75% of the Nifty 50. I had used the script created by @shijithlal as a base for this. He has used all 45-50 stocks in his script. You can look that up if you want a more accurate volume.

Alpha & BetaHow to use Alpha(α)?
If Alpha is positive the stock outperforms, if the value is negative means the stock underperforms.
α < 0: The investment has earned too little for its risk (or, was too risky for the return)
α = 0: The investment has earned a return adequate for the risk taken
α > 0: The investment has a return in excess of the reward for the assumed risk
How to use Beta(β)?
β = 1: Exactly as volatile as the index
β > 1: More volatile than the index
β < 1 > 0: Less volatile than the index
β = 0: Uncorrelated to the index
β < 0: Negatively correlated to the index
β > 2: Trending stock
Higher the β higher risk/reward
Example: If the beta is 1.1, the share price is like to move by 10% more than the index
Trading Tip
Choose a stock with Alpha greater than 0 and Beta greater than 1.9 for intraday in 5min timeframe for long positions
Remember that such stocks will have high risk and high reward
Shortlist stocks with Beta greater than 1.9 for next day in 5min timeframe

Custom GAP UP scanner for NIFTY StocksThe security function can be called 40 times in a codescript. We can therefore scan about 40 stocks out of NIFTY 50 stocks with a single script.
This code can be modified to search for other scripts by changing the condition function
condition() => open > (close * 1.0025)
Only stocks which have gap up of 0.25% or more will be reported.

BNF VWAP & MAThe script picks up Bank nifty stocks with their current respective weights and plots a Volume Weighted Average Price ( VWAP ) line along with 2 EMAs of your choice and an alert when the EMAs cross over and also when price crosses VWAP .
You can customize the script for MA type and lengths and to remove alert. Basic utility of the script is to analyse volumes driving the Bank Nifty index.
Credits to @daytraderph and his script (Custom Volume ) who's code I used to build this script. Also thanks to my friend @Varun who helped me code it.

Custom VolumeIdea : Idea of script is getting the volume of index BNF and NIFTY50 ( as Tradingview don't provide the volume information of the indexes )
How it works : Script works on getting the weighted volume of underlying stocks and the plotting them by weight in volume
Benefits:
1. Can server as example how, once can plot the mixed volume of symbols
2. Will help the traders who consider volume also as decision making factor while trading BNF from tradingview chart
3. Can give volume information on any TF **in my knowledge only available for premium users
Important factor to note: Weight of stocks may change time to time depending on Exchange decision.

Adam H Grimes - Keltner Channels with Day's High & LowThe indicator shows the day's high and low along with the Keltner Channels.
Keltner Channel Period - 20
Keltner Channel Multiple - 2.25
