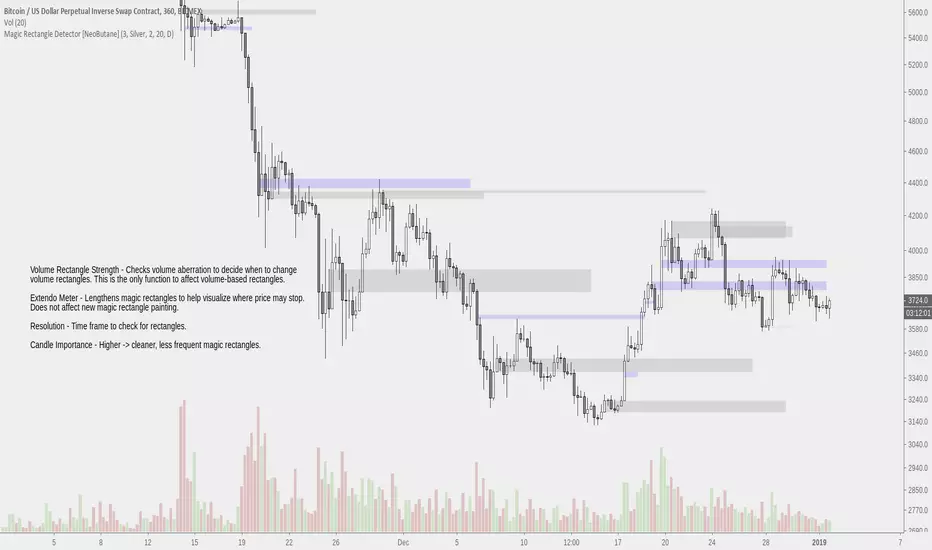
Magic Rectangle Detector [NeoButane]In the quest to make boxes, I have created the Magic Rectangle Detector.
This indicator finds essential supports and resistances, many of which may flip and become resistances and supports. Classical price action trading is best utilized in unison with this indicator.
Options to configure on the main chart.
Neobutane
HODL5 Market Cap Advance Decline Line [NeoButane]The Advance-Decline Line (AD Line) is a breadth indicator based on Net Advances, which is the number of advancing stocks less the number of declining stocks. Net Advances is positive when advances exceed declines and negative when declines exceed advances. The AD Line is a cumulative measure of Net Advances. While the shape of the AD Line is important, the actual value holds no meaning.
Currently, this version of the AD Line is based on the Net Advances of the market capitalization for the 4* coins in the Amun Crypto Basket Index. Because the cryptocurrency market moves in a homogeneous nature, there are more confirming moves than divergences compared to something like an AD Line of the NYSE.
*BCH has been removed, likely because of its split fork, but has an option to add. For accuracy, include BCH(ABC) prior to live trading of the index; 21 Nov. 2018 and before.
The current index is based on: BTC, ETH, XRP, and LTC.
Market cap is calculated as (current USD price * circulating supply).
Market cap is from TradingView's CRYPTOCAP tickers
stockcharts.com
www.amun.com

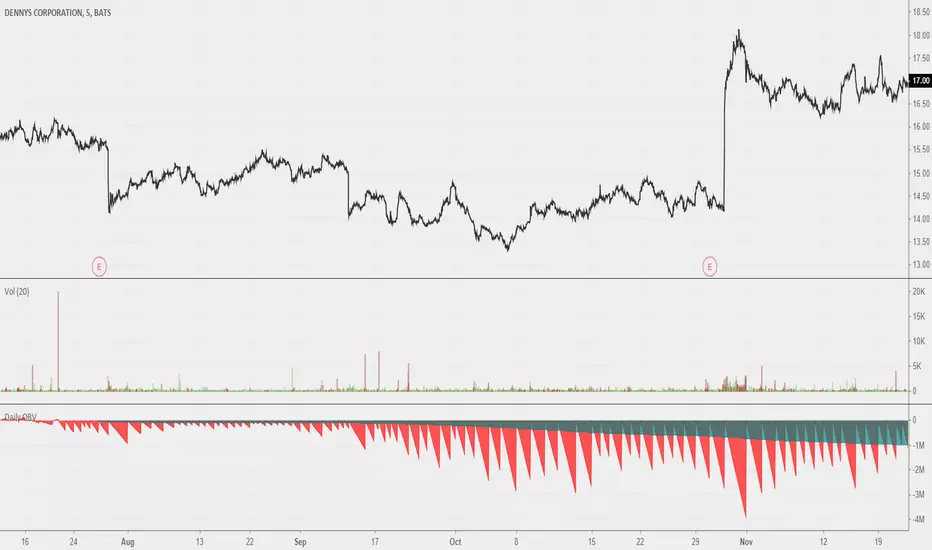
Daily OBVOBV that should reset on a daily session break. Looks neat when you scroll out all the way. Good use remains to be found; I believe this could be a useful reference for a more fleshed out idea for 'local zone' OBVs. Maybe comparing previous sessions' daily OBVs to current.
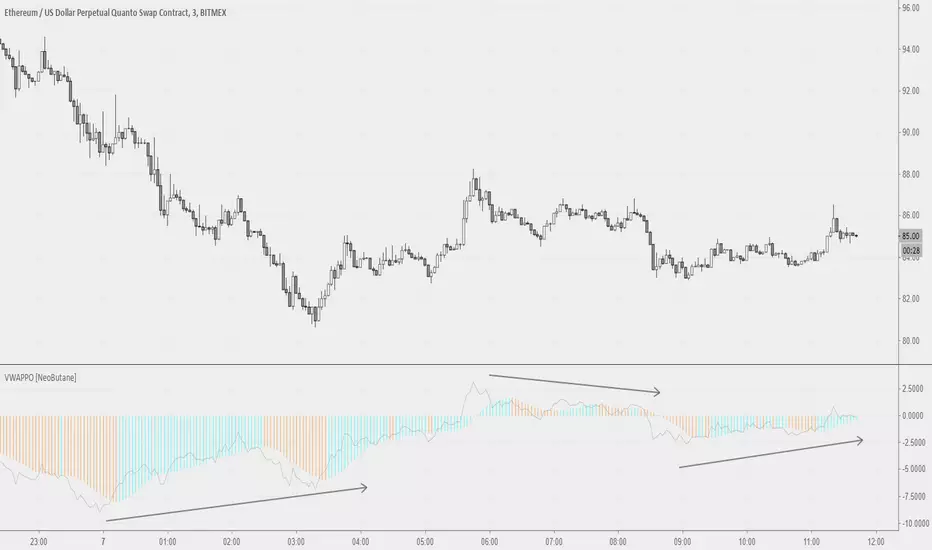
Volume Weighted Average Price Oscillator [NeoButane]VWAP on PPO but not PPO. Two histograms, with the second one being SMAs of the first and signals color/trend change.
1.0 - Release
Framework laid out
Power level readings should be within 9000
Money BoxThe inventor Of Murrey Math, T. H, Murrey, had followed in the path of W. D. Gann and deduced that the market moves in set octaves (rather than angles). Instead of 45, 888.
Money Box is an implementation of Murrey Math Lines. It takes the highs and lows of a defined trading range, which must be a multiple of 8 (64/128/256/512), and makes octaves out of that range starting from the high.
Usage
Each octave represents a support/resistance, with outer octaves being more stronger.
Frame Size: The bars back that is taken into account for calculation.
Frame Multiplier: Widens the octaves' trading range. This is useful when you don't want to include older candlestick data but need a larger range.
The other inputs are cosmetic and do not affect the formula.

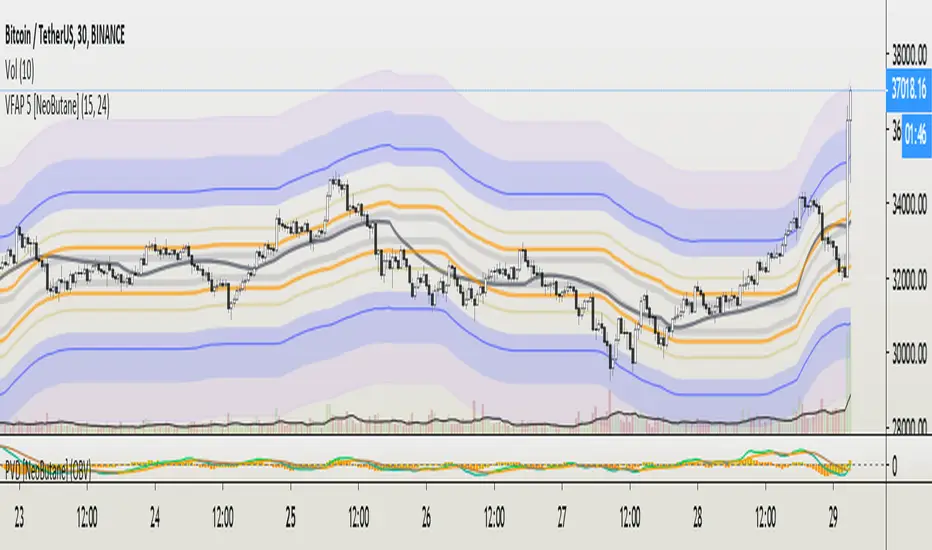
VFAP Bands: Volume Flow Aggregate Price [NeoButane]What VFAP accomplishes is finishing what VWAP started, which is to find the best liquidity for market makers to profit off the bid/ask spread. What price is the best? Of course, nobody would tell you this. Otherwise it would be easy for bigger market participants to hunt or prevent being hunted.
This is where VFAP comes in: by being able to visualize optimal liquidity zones, you will be able to enter/exit positions at the safest entries, front run the market makers, and get stopped out at the coolest prices.
The bands are consistently wicked into and provide insight to minute timeframe movements. The levels are areas of high volume where traders may be trapped or defending their position.
See here for pricing and more information: medium.com
Pictured below are the true basis bands. In a tightening/nonvolatile range, They are able to pre-define the range by having a modified formula and being sooner to update than the traditional VFAP bands.
Trial version here:
ATR Bands [NeoButane]ATR bands, smoothed with exponential moving averages.
The difference between this and other ATR bands is that high and low are used as the source for top and bottom band, resulting in more accurate ATRs. It is also calculated in log-space to aid in making the bands more "springy" when it comes to extremely volatile assets or very low timeframes.
See here for an upgraded version:

Volume Zone Oscillator and Price Zone (VZO/PZO) [NeoButane]" Volume Precedes Price is the conceptual idea for the oscillator."
"The main idea of the VZO was to try to change the OBV to look like an oscillator rather than an indicator, also to include time; primarily to identify which zone the volume is located in during a specific period "
How to read this indicator:
Positive reading -> bullish
Negative reading -> bearish
-60 or 60 is seen as the limit of the oscillator range, and a pullback should be expected from there.
Plus and minus signs have been added to the top and bottom for VZO and PZO, with an adjustable threshold to trigger.
Alert conditions have been added to this indicator for ease of use.
Volume Zone Oscillator, write-up by the author (recommended reading)
http:capitalsynergy.com/resources/IFTA09VZO.pdf
Volume Zone Oscillator, uses and formula
https:www.investopedia.com/articles/active-trading/072815/how-interpret-volume-zone-oscillator.asp
Price Zone Oscillator, uses and formula
https:www.investopedia.com/terms/p/price-zone-oscillator.asp

Daily Auto Fibonacci ToolCalculates Fibonacci retracements based on daily highs/lows, and further beyond that if specified. The main difference between this and other auto Fibbing tools is ease of visibility.
Options:
Take highs/lows from a few days back or take highs/lows from each daily candle
Hide retracements before today
Show labels for each retracement level
Hide/Show retracement levels
Change colors quickly and uniformly (in script)
Retracements used:
-0.382 / 0 / 0.236 / 0.382 / 0.5 / 0.618 / 0.786 / 1 / 1.272
