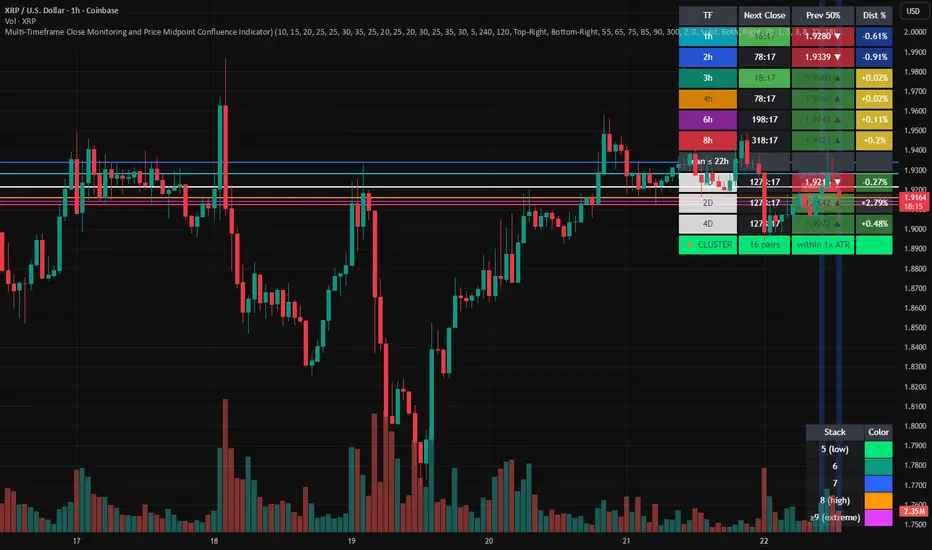
Multi-Timeframe Close and Midpoint ConfluenceMulti-Timeframe Close Monitoring and Price Midpoint Confluence Indicator
This indicator is designed to assist traders in monitoring multiple timeframe candle closes and identifying areas where price midpoints (50% levels) from different timeframes cluster together.
The tool focuses on timing awareness and structural context, helping users observe periods where multiple timeframe events occur close together, which may coincide with increased market activity.
What the Indicator Tracks
The indicator monitors candle close timing and price context across multiple timeframes, including:
Intraday timeframe closes (30m, 1h, 2h, 3h, 4h, 6h, 8h)
Higher-timeframe closes (Daily, Weekly, Monthly) when within a defined scan window
The midpoint (50%) of the previous candle for each tracked timeframe
The distance between current price and each midpoint level
This information is evaluated independently for each timeframe.
Timeframe Close Confluence
When multiple timeframes are approaching a candle close within a short window, the indicator highlights this period visually.
These moments can be useful for observing potential shifts in activity or volatility, particularly when combined with other forms of analysis.
Visual markers and optional alerts are used to draw attention to these timing clusters.
Midpoint (50%) Level Clustering
The indicator also evaluates whether multiple 50% levels from different timeframes are located within a user-defined proximity.
When several midpoints cluster closely together, the area is highlighted as a zone of interest for further observation, as overlapping price references may act as areas of interaction.
Countdown & Information Panel
An optional on-chart panel displays:
A live countdown to upcoming timeframe closes
Relative urgency based on proximity to each close
Whether current price is above or below each midpoint
Distance metrics to help gauge proximity
Color coding is used to improve readability rather than indicate trade direction.
Visual Context Tools
Additional visual options include:
Background shading when multiple timing or midpoint conditions overlap
Adjustable thresholds to control sensitivity
Customizable colors, opacity, and panel placement
These visuals are intended to provide contextual awareness, not trade signals.
Intended Use
Style: Multi-timeframe analysis and timing awareness
Markets: Forex, crypto, equities, futures
Purpose:
Monitor upcoming timeframe closes
Observe overlapping price reference zones
Improve preparation around potential activity windows
The indicator is best used as a supplementary tool alongside independent analysis.
Important Notes
This script is provided for educational and analytical purposes only.
It does not predict market outcomes and should not be used as a standalone decision-making tool. Users are encouraged to apply appropriate risk controls and confirm observations with additional analysis.
Multitimeframe
Ichimoku MTF Heatmap WITH ALERT meeting D and W conditionsThis is a version of the Ichimoku Cloud Heatmap but adds a can't miss alert when it meets Daily and Weekly conditions. The cloud metric is still being refined and the qualifier is ignoring just the cloud for now. As of 12/21/2025 GLD is meeting the conditions to set this flag.

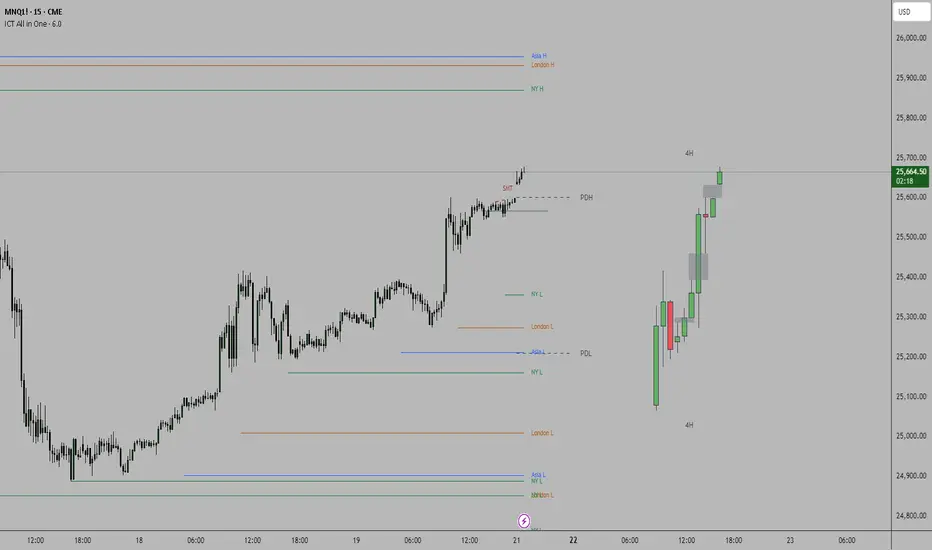
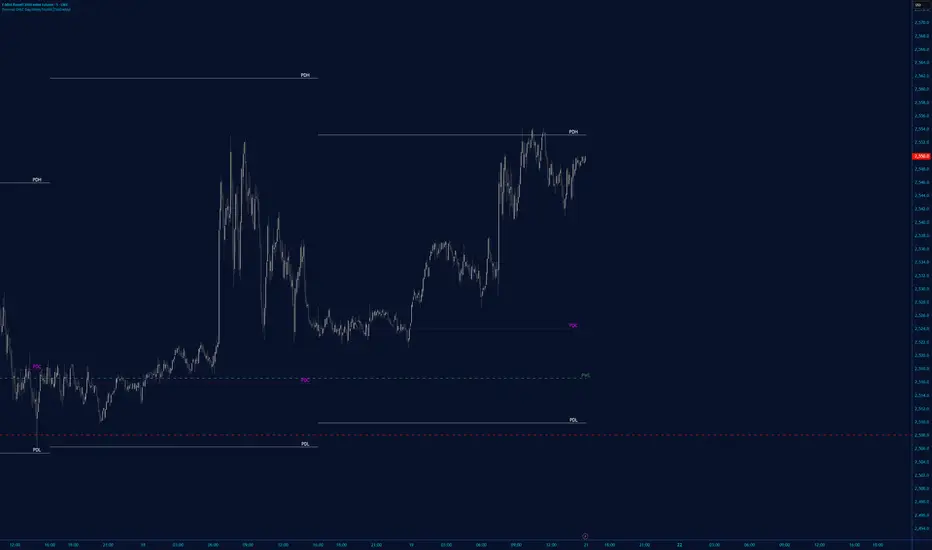
ICT all in oneSessions, PDH, PDL, High Time Frame Candles and Inversion Fair Value gap detector.
This indicator helps detect FVG's on the higher time frame for you to mark with the HTF candles.
Helps see Session sweeps, Small SMT's, Previous day high and low and one Inversion closes to price on the current time frame for possible entry.
SVEA - Smart Valuation & Analysis [Gabremoku]SVEA is a smart overbought/oversold map that paints dynamic price zones and reversal signals directly on the chart using RSI and ATR‑based volatility bands.📈✨
🧠 Smart context: Automatically adapts OB/OS levels to asset type and timeframe (equities, crypto, forex, 15m) for more realistic signals.
🎯 Actionable zones: Highlights continuous OB/OS price areas as dynamic support/resistance, helping to spot stretched moves and potential reversals at a glance.
🌡️ Volatility‑aware: Uses ATR‑driven padding so zones expand in high volatility and contract in calm markets, keeping signals relevant across regimes.
🛠️ Fully customizable: Fine‑tune OB/OS levels, lookback, padding, and visibility to match your strategy and preferred signal frequency.

Multi-Group Trend Boxes with POC Trend Line - XWiseTradeAdvanced multi-timeframe trend structure visualization.
This indicator creates three independent groups of trend boxes, each with:
• Custom bar count and lower timeframe POC calculation
• Automatic up/down/sideways coloring
• Connecting POC trend line
Perfect for:
• Multi-timeframe confluence analysis
• Identifying trend strength across scales
• Clean structural price action mapping
Features:
• 3 fully customizable groups (short/medium/long term)
• Dynamic POC-based trend lines
• Transparent colored boxes
• High performance with object management
More premium indicators and strategies coming soon at:
xwisetrade.com
Be Wise. Trade X.

Fixed Time Frame EMA [TickDaddy]Show a 50 period EMA on the 15 minute timeframe on any other timeframe like 5 min, 1 min, 1 hour, etc.. etc..
it's all customizable, you choose the timeframe, ema, color, all that good stuff.

PM/PW/PD/OVN/CD Highs & Lows with prices+ EMAsPM/PW/PD/OVN/CD Highs & Lows with prices
+
3 customizable EMAs (def 12/34/55)

ABC Pro Ultimate S/RABC Pro Ultimate is a high-precision trading tool designed to identify harmonic ABC (Zigzag) patterns and combine them with institutional Support & Resistance levels. Unlike standard indicators that clutter your chart with noise, this script filters for high-relevance pivot points from the distant past to provide truly meaningful trade setups.

The Beast (Main)This Indicator combines Trendline Break + Z-Score + Adaptive Re-Entry
🔥 Quick Start
Trade trendline breakouts only
Confirm entries with Z-Score momentum
Optional adaptive re-entries (✕) after pullbacks
Clean signals, no clutter, no repaint
Works best when paired with the Z-Score Oscillator Companion
🚀 Overview
This indicator is a clean, rule-based breakout and continuation system designed to highlight high-quality trend trades while avoiding noise and overtrading.
It combines:
Structural trendline breaks
Statistical momentum (Z-Score)
Adaptive re-entry logic based on timeframe behavior
The result is a disciplined, professional signal framework focused on clarity and confidence rather than signal quantity.
🧠 How It Works
1️⃣ Trendline Break (Structure First)
Signals are only considered after price breaks a dynamically calculated trendline based on swing highs/lows.
This ensures alignment with real market structure.
2️⃣ Z-Score Momentum Confirmation
After a break:
BUY → Z-Score ≥ positive threshold
SELL → Z-Score ≤ negative threshold
This filters out weak moves and confirms statistical momentum, not guesswork.
3️⃣ Controlled Timing Window
Signals are valid only for a limited number of bars after the break.
This avoids late entries and stale setups.
🔁 Adaptive Re-Entries (Optional)
Re-entries allow controlled continuation trades in strong trends.
Marked with a ✕ (cross) for clear distinction
Always occur after a pullback
Printed one bar after confirmation (non-repainting)
Timeframe-aware modes:
Auto (Recommended)
Low / Mid / High TF
Off
A max re-entry limit prevents overexposure.
🔄 Alternate Signal Protection
An optional filter prevents:
BUY → BUY → BUY
SELL → SELL → SELL
This enforces signal discipline and avoids overtrading.
🎨 Visual Design
Primary entries: Arrow or Label (user choice)
Re-entries: ✕ only (always discreet)
Adjustable transparency for clean charts
🛠 Best Use
Trend-focused markets
Crypto, Forex, Indices, Futures
Intraday and Swing trading
Combine with "The Beast (Adaptive Companion)" for maximum clarity.

Multi-Fractal Trading Plan [Gemini] v22Multi-Fractal Trading Plan
The Multi-Fractal Trading Plan is a quantitative market structure engine designed to filter noise and generate actionable daily strategies. Unlike standard auto-trendline indicators that clutter charts with irrelevant data, this system utilizes Fractal Geometry to categorize market liquidity into three institutional layers: Minor (Intraday), Medium (Swing), and Major (Institutional).
This tool functions as a Strategic Advisor, not just a drawing tool. It calculates the delta between price and structural pivots in real-time, alerting you when price enters high-probability "Hot Zones" and generating a live trading plan on your dashboard.
Core Features
1. Three-Tier Fractal Engine The algorithm tracks 15 distinct fractal lengths simultaneously, aggregating them into a clean hierarchy:
Minor Structure (Thin Lines): Captures high-frequency volatility for scalping.
Medium Structure (Medium Lines): Identifies significant swing points and intermediate targets.
Major Structure (Thick Lines): Maps the "Institutional" defense lines where trend reversals and major breakouts occur.
2. The Strategic Dashboard A dynamic data panel in the bottom-right eliminates analysis paralysis:
Floor & Ceiling Targets: Displays the precise price levels of the nearest Support and Resistance.
AI Logic Output: The script analyzes market conditions to generate a specific command, such as "WATCH FOR BREAKOUT", "Near Lows (Look Long?)", or "WAIT (No Setup)".
3. "Hot Zone" Detection Never miss a critical test of structure.
Dynamic Alerting: When price trades within 1% (adjustable) of a Major Trend Line, the indicator’s labels turn Bright Yellow and flash a warning (e.g., "⚠️ WATCH: MAJOR RES").
Focus: This visual cue highlights the exact moment execution is required, reducing screen fatigue.
4. The Quant Web & Markers
Pivot Validation: Deep blue fractal markers (▲/▼) identify the exact candles responsible for the structure.
Inter-Timeframe Web: Faint dotted lines connect Minor pivots directly to Major pivots, visualizing the "hidden" elasticity between short-term noise and long-term trend anchors.
5. Enterprise Stability Engine Engineered to solve the "Vertical Line" and "1970 Epoch" glitches common in Pine Script trend indicators. This engine is optimized for Futures (NQ/ES), Forex, and Crypto, ensuring stability across all timeframes (including gaps on ETH/RTH charts).
Operational Guide
Consult the Dashboard: Before executing, check the "Strategy" output. If it says "WAIT", the market is in chop. If it says "WATCH FOR BOUNCE", prepare your entry criteria.
Monitor Hot Zones: A Yellow Label indicates price is testing a major liquidity level. This is your signal to watch for a rejection wick or a high-volume breakout.
Utilize the Web: Use the faint web lines to find "confluence" where a short-term pullback aligns with a long-term trend line.
Configuration
Show History: Toggles "Ghost Lines" (Blue) to display historical structure and broken trends.
Fractal Points: Toggles the geometric pivot markers.
Hot Zone %: Adjusts the sensitivity of the Yellow Warning system (Default: 1%).
Max Line Length: A noise filter that removes stale or "spiderweb" lines that are no longer statistically relevant.


S.EQ - Macro TrackerMacro Tracker Indicator - Description
This TradingView indicator visualizes macro time windows throughout the trading day, marking specific 33-minute periods that occur hourly (from XX:42 to XX:15 of the next hour) in the America/New_York timezone.
Core Functionality
Time Windows Tracked:
The indicator monitors 24 hourly macro periods (e.g., 00:42-01:15, 01:42-02:15, etc.)
Each period spans 33 minutes, starting at 42 minutes past the hour and ending at 15 minutes past the next hour
Special periods for the last trading hour (14:42-15:15, 15:42-16:15) with an optional 15:15-15:45 window
---------------------------------------------------------------------------------
Visual Display Modes
1. On Chart Mode (Default)
Draws vertical lines at the start and end of each macro period
Displays a horizontal line at the top connecting the boundaries
Shows optional labels with time stamps at the midpoint
Midline Feature: Adds a dotted vertical line at XX:00 (the hour mark) within each macro period
Projects dotted extension lines toward current price action when enabled
Dynamically adjusts line heights based on price movement within the period
2. New Pane Mode
Displays macro periods as colored boxes in a separate indicator pane
Useful for cleaner chart visualization when tracking multiple periods
---------------------------------------------------------------------------------
Key Features
Customizable Display: Toggle individual macro periods on/off, choose colors, and control label visibility
Time Labels: Optional display of exact time ranges on each macro period
Projections: Extension lines that project from macro boundaries toward current price
Midline Markers: Dotted lines showing the hour mark (XX:00) within each macro period
Weekend Handling: Automatically adjusts for Friday closes and weekend gaps (non-crypto markets)
Memory Management: Automatically cleans up old drawing objects to maintain performance

Support Resistance + RSI + 4 EMA (Doge_SV)Overview
This comprehensive indicator is designed to provide traders with a "bird's-eye view" of the market by combining three essential technical analysis tools into a single, clean interface. It helps in identifying trend direction, key price levels, and momentum across multiple timeframes without cluttering your workspace.
Key Features
1. Dynamic Support & Resistance (S/R)
The script automatically identifies and plots significant Support and Resistance levels based on pivot points.
Dynamic Zones: It highlights areas where price has historically reacted, helping you find high-probability entry and exit points.
Strength Filtering: Includes a built-in algorithm to display only the most "significant" levels based on their historical strength.
Visual Alerts: Lines and labels change color (Lime for Support, Red for Resistance) based on the current price position.
2. Quad-EMA Trend Ribbon (The "Exponential Moving Averages")
The indicator features four of the most widely used EMAs in professional trading to identify trend hierarchy:
EMA 34 (Green): Short-term momentum and immediate support/resistance.
EMA 89 (Blue): Intermediate-term trend filter (The "Trend Core").
EMA 200 (Black): Long-term trend baseline (The "Institutional Level").
EMA 633 (Purple): Ultra-long-term trend, often used for major cycle analysis.
3. Multi-Timeframe (MTF) RSI Dashboard
Stay informed about overbought or oversold conditions across all timeframes simultaneously.
Real-time Table: A neat table in the corner of your chart displays RSI (14) values from 1 minute up to 1 day.
Heatmap Logic: The table cells automatically change color based on intensity:
Red/Orange: Overbought (RSI > 70/80)
Green/Dark Green: Oversold (RSI < 30/20)
White: Neutral zone.
How to Use
Trend Alignment: Look for the 4-EMAs to be stacked in order (34 > 89 > 200 > 633 for a Bullish trend).
S/R Confirmation: When price approaches a Red Resistance line, check the RSI Dashboard. If higher timeframes are also Overbought, it increases the probability of a reversal.
Breakout Detection: Use the Support/Resistance lines to identify potential breakouts or "Role Reversal" (where old resistance becomes new support).

MTF Fair Value GapsMTF Fair Value Gaps (MTF FVGs) plots Fair Value Gaps from up to 4 user-selectable higher timeframes directly on your chart.
Multi-timeframe support: Enable/disable each timeframe independently (e.g., 15m / 1h / 4h / 1D).
Clean chart mode: Show only the N closest bullish + bearish gaps per timeframe (reduces clutter).
Mitigation options: Choose how/when gaps are considered filled and automatically removed.
CE (0.5) midpoint line: Optional display with customizable style and width.
Per-timeframe colors: One color per timeframe (bull/bear share the same color).
Right-edge extension: Shift the right edge by X chart candles to keep gaps visible ahead of price.

Multi-TF ATR + ORB + EMA PRO ver. 3.0Multi-TF ATR + ORB + EMA PRO v3.0
Professional Trading Indicator Update - Complete Documentation
🎯 MAJOR ENHANCEMENTS OVERVIEW
1. ORB Logic Completely Redesigned
✅ Show Only Previous ORB - Extended line display of previous session's ORB
✅ Multi-Session Support - NY, EU, ASIA sessions with independent on/off toggles
✅ Dynamic Timeframe Selection - Switch between 4H, 1H, 30M, 15M, 5M in settings
✅ Previous Session Tracking - Separate variables for previous ORB highs/lows
2. Enhanced ATR Table with Color Signals
✅ Signal-Based Color Coding - Green (●) for active signals, Gray (○) for inactive
✅ Modern Design - Professional dark theme with gradient colors
✅ Quick Recognition - Color-coded cells for instant signal identification
✅ Fully Customizable - Position, size, and styling in settings
3. Full Syntax Validation & No Errors
✅ All Pine Script v6 syntax validated
✅ Proper type annotations on all variables
✅ Correct indentation (4 spaces throughout)
✅ Function declarations follow v6 standards
✅ Request.security() calls optimized

MSP Multi-Timeframe Trend & Momentum DashboardMulti-Timeframe Trend, Momentum, and Bias Dashboard
This indicator provides a multi-timeframe overview by evaluating several technical conditions across multiple timeframes simultaneously.
Its purpose is to help traders assess alignment or divergence between higher and lower timeframes before making trading decisions.
Rather than generating standalone signals, the dashboard summarizes trend, momentum, participation, and trend-strength metrics into a compact visual table.
What the Indicator Evaluates (Per Timeframe)
Each selected timeframe is analyzed independently using:
Trend context
Price position relative to fast and slow moving averages
Momentum
RSI position relative to user-defined thresholds
Directional confirmation
MACD line relative to its signal line
Participation
Current volume compared to its recent average
Trend strength
ADX value to distinguish trending from non-trending conditions
These components are combined to form a directional bias assessment for each timeframe.
Dashboard Overview
The dashboard displays:
Directional bias per timeframe
Aggregate bias across all selected timeframes
Momentum and trend readings
Relative volume strength
Trend-strength values
Alignment status when multiple timeframes agree
This allows users to quickly identify whether market conditions are aligned, mixed, or conflicting across timeframes.
Visual Encoding
Cells within the table are color-coded to improve readability:
Bullish bias
Bearish bias
Neutral or mixed conditions
Color intensity reflects relative strength, helping distinguish weak alignment from stronger confluence.
Optional chart-level visuals can highlight periods of broad alignment or disagreement across timeframes.
Customization Options
Users may adjust:
Timeframes included in the dashboard
Thresholds for momentum, volume, and trend strength
Table size, position, and visual appearance
Alert conditions based on alignment criteria
These settings allow the indicator to be adapted to different instruments, timeframes, and trading styles.
Intended Use
Style: Multi-timeframe analysis and confirmation
Markets: Forex, crypto, equities, index futures
Purpose:
Assess higher-timeframe bias
Improve directional context before entries
Avoid trades against broader trend conditions
The indicator is most useful as a contextual filter, rather than a standalone decision tool.
Important Notes
This script is provided for educational and analytical purposes only.
It does not predict price movement and should be used alongside independent analysis and appropriate risk controls.

CRT 4H-DAY (Candle Range Theory)CRT 4H-DAY (Candle Range Theory) is a clean, price-based analytical tool designed to help traders contextualize market structure across multiple time horizons.
The indicator highlights key reference levels derived from recent market ranges and visualizes them directly on the chart in a minimal, non-intrusive way.
Its purpose is to improve spatial awareness of price behavior rather than generate direct trading signals.
CRT Trading is built for discretionary traders who prefer to combine contextual levels with their own analysis, price action, and risk management rules.
Key characteristics:
Multi-timeframe contextual reference levels
Clean and customizable visual layout
Works across crypto, forex, indices, and stocks
Designed for intraday and swing analysis
No repainting
No buy/sell signals
No future data usage
This indicator does not provide financial advice and should be used strictly as a supplementary analytical tool.
This indicator is for educational and analytical purposes only.
It does not provide trading signals or investment advice.
All trading decisions remain the sole responsibility of the user.

AI Market Barometer ProAI Market Barometer Pro - Professional Trading Indicator
Overview
AI Market Barometer Pro is an advanced multi-timeframe trading system that combines artificial intelligence algorithms with proprietary technical analysis to deliver high-confidence trading signals. This professional-grade indicator analyzes market conditions across multiple timeframes simultaneously, providing traders with clear directional bias and signal strength ratings.
Core Features
🎯 Core AI Barometer System
- Multi-Timeframe Analysis: Monitors different timeframes simultaneously
- AI Confidence Score: Proprietary algorithm calculates signal confidence from 0-100%
- Three-Level Signal Strength: Basic, Medium ★, and Strong ★★ signals
- Dynamic Background Coloring: Visual market sentiment at a glance
- Real-Time Information Panel: Customizable position with live market metrics
⚡ Three AI Accelerator Systems
- Accelerator 1: Original multi-timeframe momentum system with 27 dimensions
- Accelerator 2: Five-star selection algorithm with 32 AI parameters
- Accelerator 3:
- Each accelerator provides independent AI support lines and signal zones
- Highly selective signals ensuring maximum accuracy
📊 Advanced Visualization
- Color-Coded Signals:
- Green zones indicate bullish conditions
- Red zones indicate bearish conditions
- Gray indicates neutral/ranging markets
- Smart Labels: Auto-positioned signal labels displaying confidence percentages
- Background Intensity: Three levels showing signal strength
- Customizable Display: Adjustable panel position and visibility options
Configuration Options
Display Settings
- Panel Position: 9 position options (corners, edges, center)
- Show Labels: Toggle signal labels on/off
- Show Background Color: Toggle background coloring on/off
- Show Info Panel: Toggle real-time information table on/off
- Background Display Days: Control how many days of coloring to display (1-30 days)
Channel Settings
- Enable Channel: Optional channel
- Channel Width: Adjustable deviation multiplier
Accelerator Settings
- Enable Accelerator 1: Original accelerator system
- Enable Accelerator 2: Five-star selection system
- Enable Accelerator 3: Advanced buy filtering system
- Each can be toggled independently
Alert System
Pre-configured alerts include:
- AI Long Signal activation
- AI Short Signal activation
- AI Ranging Signal activation
- Accelerator 1 Bull/Bear zones
- Accelerator 2 Bull/Bear zones
- Accelerator 3 Bull/Bear zones
Information Panel Metrics
Real-time display includes:
- Current Timeframe
- Active Signal (Long/Short/Ranging)
- AI Confidence Percentage
- Current Price
- Change Percentage
- Momentum Status (Bullish/Bearish/Mixed)
- Signal Strength Rating
Recommended Timeframes
- Scalping: 1-minute charts
- Day Trading: 5-minute, 15-minute charts
- Swing Trading: 1-hour, 4-hour, Daily charts
- Position Trading: Daily, Weekly charts
Technical Requirements
- TradingView Pro, Pro+, or Premium account (required for multi-timeframe functionality)
- Compatible with all markets: Forex, Crypto, Stocks, Indices, Commodities
- Works on all timeframes from 1-minute to Monthly
Disclaimer
This indicator is a tool to assist with trading decisions. Past performance does not guarantee future results. Trading involves substantial risk of loss. Always use proper risk management and never risk more than you can afford to lose. The AI algorithms and confidence scores are based on historical price patterns and technical analysis, not predictive guarantees.
What Makes This Different?
Unlike simple trading systems, AI Market Barometer Pro:
- ✅ Analyzes multiple timeframes simultaneously
- ✅ Calculates dynamic confidence scores
- ✅ Provides three-tier signal strength ratings
- ✅ Includes three independent accelerator systems
- ✅ Delivers highly selective, low-noise signals
- ✅ Features professional-grade visualization
- ✅ Adapts to all market conditions
Join thousands of traders using AI-powered analysis to gain their edge in the markets.
🌤️ Perfect Companion Indicator
Enhance your trading with AI Market Weather Forecast Pro
Transform complex market analysis into intuitive weather forecasts. Get instant market temperature readings from -50°C to +50°C and know whether you're trading in a heatwave or a blizzard.
Why use them together:
Barometer → Precise entry/exit signals with AI confidence scores
Weather → Overall market climate and trend temperature
Combined → Complete market picture for optimal timing
👉 Get AI Market Weather Forecast Pro
Know the market climate before you trade. Two indicators, one complete trading system.
© 2024 AI Market Barometer Pro. All rights reserved. Proprietary algorithms and methodologies protected.

SFI Follow Trend Level 1 ( SFI Academy )“SFI Trading Level 1 Indicator is a proprietary indicator used by SFI Academy for its students, in combination with SFI Academy’s exclusive capital management toolset.”

Iridescent Liquidity Prism [JOAT]Iridescent Liquidity Prism | Peer Momentum HUD
A multi-layered order-flow indicator that combines microstructure analysis, smart-money footprint detection, and intermarket momentum signals. The script uses dynamic color-shifting themes to visualize liquidity patterns, structure, and peer momentum data directly on the chart.
There is so much to choose from inside the settings, if you think it's a mess on the chart it's because you have to personally customize it based on your needs...
Core Functionality
The indicator calculates and displays several analytical layers simultaneously:
Order-Flow Imbalance (OFI): Calculates buy vs. sell volume pressure using volume-weighted price distribution within each bar. Uses an EMA filter (default: 55 periods) to smooth the signal. Values are normalized using standard deviation to identify significant imbalances.
Smart Money Footprints: Detects accumulation and distribution zones by comparing volume rate of change (ROC) against price ROC. When volume ROC exceeds a threshold (default: 65%) and price ROC is positive, accumulation is detected. When volume ROC is high but price ROC is negative, distribution is detected.
Fractal Structure Mapping: Identifies pivot highs and lows using a fractal detection algorithm (default: 5-bar period). Maintains a rolling window of recent structure points (default: 4 levels) and draws connecting lines to show trend structure.
Fair Value Gap (FVG) Detection: Automatically detects price gaps where three consecutive candles create an imbalance. Bullish FVGs occur when the current low exceeds the high two bars ago. Bearish FVGs occur when the current high is below the low two bars ago. Gaps persist for a configurable duration (default: 320 bars) and fade when price fills the gap.
Liquidity Void Detection: Identifies candles where the high-low range exceeds an ATR threshold (default: 1.7x ATR) while volume is below average (default: 65% of 20-bar average). These conditions suggest areas where liquidity may be thin.
Price/Volume Divergence: Uses linear regression to detect when price trend direction disagrees with volume trend direction. A divergence alert appears when price is trending up while volume is trending down, or vice versa.
Peer Momentum Heatmap (PMH): Calculates composite momentum scores for up to 6 symbols across 4 timeframes. Each score combines RSI (default: 14 periods) and StochRSI (default: 14 periods, 3-bar smooth) to create a momentum composite between -1 and +1. The highest absolute momentum score across all combinations is displayed in the HUD.
Custom settings using Fractal Pivots, Skeleton Structure, Pulse Liquidity Voids, Bottom Colorful HeatMaps, and Iridescent Field.
---
Visual Components
Spectrum Aura Glow: ATR-weighted bands (default: 0.25x ATR) that expand and contract around price action, indicating volatility conditions. The thickness adapts to market volatility.
Chromatic Flow Trail: A blended line combining EMA and WMA of price (default: 8-period EMA blended with WMA at 65% ratio). The trail uses gradient colors that shift based on a phase oscillator, creating an iridescent effect.
Volume Heat Projection: Creates horizontal volume profile bands at price levels (default: 14 levels). Scans recent bars (default: 150 bars) to calculate volume concentration. Each level is colored based on its volume density relative to the maximum volume level.
Structure Skeleton: Dashed lines connecting fractal pivot points. Uses two layers: a primary line (2-3px width) and an optional glow overlay (4-5px width) for enhanced visibility.
Fractal Markers: Diamond shapes placed at pivot high and low points. Color-coded: primary color for highs, secondary color for lows.
Iridescent Color Themes: Five color themes available: Iridescent (default), Pearlescent, Prismatic, ColorShift, and Metallic. Colors shift dynamically using a phase oscillator that cycles through the color spectrum based on bar index and a speed multiplier (default: 0.35).
---
HUD Console Metrics
The right-side HUD displays seven key metrics:
Flow: Shows OFI status: ▲ FLOW BUY when normalized OFI exceeds imbalance threshold (default: 2.2), ▼ FLOW SELL when below -2.2, or ◆ FLOW BAL when balanced.
Struct: Structure trend bias: ▲ STRUCT BULL when microtrend > 2, ▼ STRUCT BEAR when < -2, or ◆ STRUCT RANGE when neutral.
Smart$: Institutional activity: ◈ ACCUM when smart money index = 1, ◈ DISTRIB when = -1, or ○ IDLE when inactive.
Liquid: Liquidity state: ⚡ VOID when a liquidity void is detected, or ● NORMAL otherwise.
Diverg: Divergence status: ⚠ ALERT when price/volume divergence detected, or ✓ CLEAR when aligned.
PMH: Peer Momentum Heatmap status: Shows dominant timeframe and momentum score. Displays 🪩 for bull surge (above 0.55 threshold) or 🧨 for bear surge (below -0.55).
FVG: Fair Value Gap status: Shows active gap count or CLEAR when no gaps exist. Displays GAP LONG when bullish gap detected, GAP SHORT when bearish gap detected.
Pearlscent Color with Volume Heatmap.
Parameters and Settings
Microstructure Engine:
Analysis Depth: 20-250 bars (default: 55) - Controls OFI smoothing period
Liquidity Threshold ATR: 1.0-4.0 (default: 1.7) - Multiplier for void detection
Imbalance Ratio: 1.5-6.0 (default: 2.2) - Standard deviations for OFI significance
Smart Money Layer:
Smart Money Window: 10-150 bars (default: 24) - Period for ROC calculations
Accumulation Threshold: 40-95% (default: 65%) - Volume ROC threshold
Structural Mapping:
Fractal Pivot Period: 3-15 bars (default: 5) - Period for pivot detection
Structure Memory: 2-8 levels (default: 4) - Number of structure points to track
Volume Heat Projection:
Heat Map Lookback: 60-400 bars (default: 150) - Bars to analyze for volume profile
Heat Map Levels: 5-30 levels (default: 14) - Number of price level bands
Heat Map Opacity: 40-100% (default: 92%) - Transparency of heat map boxes
Heat Map Width Limit: 6-80 bars (default: 26) - Maximum width of heat map boxes
Heat Map Visibility Threshold: 0.0-0.5 (default: 0.08) - Minimum density to display
Iridescent Enhancements:
Visual Theme: Iridescent, Pearlescent, Prismatic, ColorShift, or Metallic
Color Shift Speed: 0.05-1.00 (default: 0.35) - Speed of color phase oscillation
Aura Thickness (ATR): 0.05-1.0 (default: 0.25) - Multiplier for aura band width
Chromatic Trail Length: 2-50 bars (default: 8) - Period for trail calculation
Trail Blend Ratio: 0.1-0.95 (default: 0.65) - EMA/WMA blend percentage
FVG Persistence: 50-600 bars (default: 320) - Bars to keep FVG boxes active
Max Active FVG Boxes: 10-200 (default: 40) - Maximum boxes on chart
FVG Base Opacity: 20-95% (default: 80%) - Transparency of FVG boxes
Peer Momentum Heatmap:
Peer Symbols: Comma-separated list of up to 6 symbols (e.g., "BTCUSD,ETHUSD")
Peer Timeframes: Comma-separated list of up to 4 timeframes (default: "60,240,D")
PMH RSI Length: 5-50 periods (default: 14)
PMH StochRSI Length: 5-50 periods (default: 14)
PMH StochRSI Smooth: 1-10 periods (default: 3)
Super Momentum Threshold: 0.2-0.95 (default: 0.55) - Threshold for surge detection
Clarity & Readability:
Liquidity Void Opacity: 5-90% (default: 30%)
Smart Money Footprint Opacity: 5-90% (default: 35%)
HUD Background Opacity: 40-95% (default: 70%)
Iridescent Field:
Field Opacity: 20-100% (default: 86%) - Background color intensity
Field Smooth Length: 10-200 bars (default: 34) - Smoothing for background gradient
---
Alerts
The indicator provides seven alert conditions:
Liquidity Void Detected - Triggers when void conditions are met
Strong Order Flow - Triggers when normalized OFI exceeds imbalance ratio
Smart Money Activity - Triggers when accumulation or distribution detected
Price/Volume Divergence - Triggers when divergence conditions occur
Structure Shift - Triggers when structure polarity changes significantly
PMH Bull Surge - Triggers when PMH exceeds positive threshold (if enabled)
PMH Bear Surge - Triggers when PMH exceeds negative threshold (if enabled)
Bull/Bear Prismatic FVG - Triggers when new FVG is detected (if FVG display enabled)
---
Usage Considerations
Performance may vary on lower timeframes due to the volume heat map calculations scanning multiple bars. Consider reducing heat map lookback or levels if experiencing slowdowns.
The PMH feature requires data requests to other symbols/timeframes, which may impact performance. Limit the number of peer symbols and timeframes for optimal performance.
FVG boxes automatically expire after the persistence period to prevent chart clutter. The maximum box limit (default: 40) prevents excessive memory usage.
Color themes affect all visual elements. Choose a theme that provides good contrast with your chart background.
The indicator is designed for overlay display. All visual elements are positioned relative to price action.
Structure lines are drawn dynamically as new pivots form. On fast-moving markets, structure may update frequently.
Volume calculations assume typical volume data availability. Symbols without volume may show incomplete data for volume-dependent features.
---
Technical Notes
Built on Pine Script v6 with dynamic request capability for PMH functionality.
Uses exponential moving averages (EMA) and weighted moving averages (WMA) for trail calculations to balance responsiveness and smoothness.
Volume profile calculation uses price level buckets. Higher levels provide finer granularity but require more computation.
Iridescent color engine uses a phase oscillator with sine wave calculations for smooth color transitions.
Box management includes automatic cleanup of expired boxes to maintain performance.
All visual elements use color gradients and transparency for smooth blending with price action.
---
Customization Examples
Intraday Scalping Setup:
Analysis Depth: 30 bars
Heat Map Lookback: 100 bars
FVG Persistence: 150 bars
PMH Window: 15 bars
Fast color shift speed: 0.5+
Macro Structure Tracking:
Analysis Depth: 100+ bars
Heat Map Lookback: 300+ bars
FVG Persistence: 500+ bars
Structure Memory: 6-8 levels
Slower color shift speed: 0.2
---
Limitations
Volume heat map calculations may be computationally intensive on lower timeframes with high lookback values.
PMH requires valid symbol names and accessible timeframes. Invalid symbols or timeframes will return no data.
FVG detection requires at least 3 bars of history. Early bars may not show FVG boxes.
Structure lines connect points but do not predict future structure. They reflect historical pivot relationships.
Color themes are aesthetic choices and do not affect calculation logic.
The indicator does not provide trading signals. All visual elements are analytical tools that require interpretation in context of market conditions.
Open Source
This indicator is open source and available for modification and distribution. The code is published with Pine Script v6 compliance. Users are free to customize parameters, modify calculations, and adapt the visual elements to their trading needs.
For questions, suggestions, or anything please talk to me in private messages or comments below!
Would love to help!
- officialjackofalltrades

cd_VW_CxOverview
The cd_VW_Cx is a sophisticated trend analysis tool designed to quantify market momentum using Multi-Period VWAP (Volume Weighted Average Price). Unlike standard indicators, this script evaluates the current price relationship across multiple historical VWAP anchors to generate a real-time "Confidence Score" ranging from -100 to +100.
💡 Key Features
• Dynamic Anchoring: Seamlessly switch between Daily, Weekly, or Monthly open anchors to align with your trading style (Scalping, Day Trading, or Swing).
• Algorithmic Scoring (The Score Box): The indicator compares the current VWAP against historical periods.
o Score > +70: Strong Bullish Momentum.
o Score < -70: Strong Bearish Momentum.
• Polyline Rendering: Utilizes Pine Script v6’s advanced polyline architecture for high-performance, sleek visual plotting that doesn't clutter your chart.
• Institutional Support/Resistance: Historical VWAP levels are color-coded, often acting as "invisible" magnetic zones where institutional orders are clustered.
🛠 How to Trade with cd_VW_Cx
1. Momentum Confirmation: Look for the Score Box to turn Teal (Bullish) or Red (Bearish). This indicates that the current trend has statistical backing from multiple previous sessions.
2. The Breakout Signal: The script tracks price crossovers of the current VWAP. A "Bullish Breakout" combined with a high score is a high-probability entry signal.
3. Visual Guidance: Use the custom labels to identify which specific day/week/month’s VWAP is currently being tested as support or resistance.
⚙️ Customizable Settings
• Anchor Selection: Choose the calculation basis (Daily, Weekly, Monthly).
• Thresholds: Adjust the sensitivity of the Bullish/Bearish alerts (Default is +/- 70).
• Visuals: Full control over table positioning, font sizes, and color palettes to match your chart theme.
📢 cd_VW_Cx: Multi-Period VWAP Scoring & Analysis Guide
🔍 Overview & Visual Logic
The labels next to the VWAP levels dynamically change based on your Anchor selection:
• Daily Open: Displays the Day Name (e.g., Monday, Tuesday).
• Weekly Open: Displays the Week Number (1 – 52).
• Monthly Open: Displays the Month Number (1 – 12).
•
General View:
________________________________________
🚦 How to Filter & Track Your Assets
You can monitor your favorite assets using two powerful methods:
1. Real-Time Alerts
Stay updated with TradingView notifications:
• Per Asset: Track a single pair.
• Watchlist Basis: Monitor your entire list at once. Alert Setup Guide:
2. Pine Screener Integration
Filter the market effortlessly using the Pine Screener. Pine Screener View:
________________________________________
⚙️ Settings & Configuration
• Timeframe Selection: Your chart timeframe must be lower than the selected Anchor timeframe. (e.g., If "Daily Open" is selected, the timeframe should be lower than 1D).
• Anchor Choice: Select Daily, Weekly, or Monthly opens.
• Source Selection: Default value is set to ohlc4. Source Settings:
Filtering Criteria Examples:
• Bullish Filtering: Find assets with high momentum scores.
• Bullish Breakout (Single Criteria): Filters assets that have closed above the current VWAP level.
• Combined Strength (Score + Breakout): Filters assets that have a Score > 70 AND a fresh VWAP Breakout simultaneously.
________________________________________
⚠️ Important Notes & Warnings
• Calculation Logic: The indicator calculates levels and scores on timeframes lower than the anchor. It is best used on timeframes that are close to but lower than the anchor.
• Avoid Extreme Gaps: Using a very low timeframe (e.g., 1m) with a very high anchor (e.g., Monthly) increases the risk of erroneous results.
• Optimization: The default score threshold of 70 is a starting point; I recommend adjusting it based on your own trading experience.
• The Power of Confluence: VWAP levels are naturally strong. Their significance increases when they coincide with institutional levels like PDH (Previous Day High), Session H/L, or HTF FVG.
• Experience Matters: A high score alone is not enough for an entry. Always combine this data with your personal strategy.
________________________________________
💬 Community & Feedback
I would love to hear your suggestions regarding the scoring logic or visual improvements! Feel free to share your thoughts in the comments.
Happy Trading! 🚀

SETUP HMTR ZONESETUP HMTR ZONE
This indicator highlights high-probability market extremes by detecting a rare alignment between independent heatmap engines.
Captures volatility squeeze, trend exhaustion, and pressure asymmetry.
🎯 What the indicator does
🔵 Cold Match (Blue)
Appears when all engines detect cooling, fear, and liquidity contraction.
Often forms near accumulation phases, oversold washes, structural resets, discount zones.
🔴 Hot Match (Red)
Appears when all components show overheating, exhaustion, and aggressive pressure.
Often precedes distribution phases, liquidity grabs, blow-off tops, or trend fatigue.
✨ Why this matters
This tool does not give buy/sell entries.
It provides contextual confirmation of:
emerging accumulation or distribution
cooling or overheating phases
liquidity-driven stress points
behavioral extremes
regime shifts in trend structure
Use it as a market overlay layer, not as a standalone entry trigger.
🔔 Alerts Included
Cold zone
Hot zone
Signals fire only on confirmed candle close.
✔️ Best for traders who value:
risk-aware positioning
cycle and regime analysis
structural confirmation
heatmap-based market context
smart-money aligned behavior
