DepthHouse RSI Grid MTFDepthHouse RSI Grid MTF is used to determine overbought and oversold levels based on the RSI across multiple time frames.
The default time frames are the 30m, 2H, 8H and 16H however these are completely adjustable.
This indicator also allows the user to select which RSI band to display based on the time frame.
The default is set to the current time frame, however the user can select any of the other four time frames.
OverBought & Oversold Levels are also entirely adjustable.
Meaning you can adjust the 30, 70 ranges, and it will alter the overbought and oversold values across ALL timeframes.
How to get:
As you can see this is an invite only script. In the coming month this indicator, along with many others will become pay to use only. (website on my profile page)
However all my indicators will be FREE until May 1, 2018 . So please try them out!
To take advantage of this free trial:
Just leave a comment!
IF you are viewing this after May 1st. Please feel free to send me a PM or visit my website.
Mtf

DepthHouse MTF Volume FlowDepthHouse MTF Volume Flow Indicator is an amazing tool used to help determine market direction on multiple time-frames based on the the traded volume.
This indicator is a superb upgrade to my original volume flow indicators.
You now how the option to adjust the displayed volume timeframe, which in turn adjusts the Volume Flow Moving Averages , along with the new Breakout Candle feature.
Additionally, the background colors represent the volume flow crossovers on the primary time-frame, along with three addition time-frames that are user adjustable.
The primary volume flow crossover is shown on the top of the grid, followed by the First Additional Time Frame and then so on down to the bottom.
I generally have this set with the lowest timeframe value at the top, followed by the next one in line.
For those of you who wish to set the current timeframe greater than the rest. I have built in a grid separator feature which will separate it from the rest of the background crossovers.
My MA Settings:
I generally have my Moving Averages set anywhere from 7-14
Breakout Factor:
I generally have the breakout factor set at 1.5 or 2.5
Note: Since volume amounts vary across the board. The background height is set to readjust based on the highest bars. This lookback amount is adjustable by the user and it does not affect calculations what so ever.
How to get:
As you can see this is an invite only script. In the coming month this indicator, along with many others will become pay to use only. (website on my profile page)
However all my indicators will be FREE until May 1, 2018 . So please try them out!
To take advantage of this FREE trial:
1. Leave comment on this indicator post! Maybe even give me a follow :D
2. Check out and take advantage of all my other indicators!
I hope you all enjoy!

NeoButane Bitfinex BTC Longs vs. Shorts Tickers Simplified (MtF)With optional overlay for high/low candle values and daily resolution close. Now with MtF to add customization .
Made because I'm too lazy to constantly re-add tickers and to reduce noise.
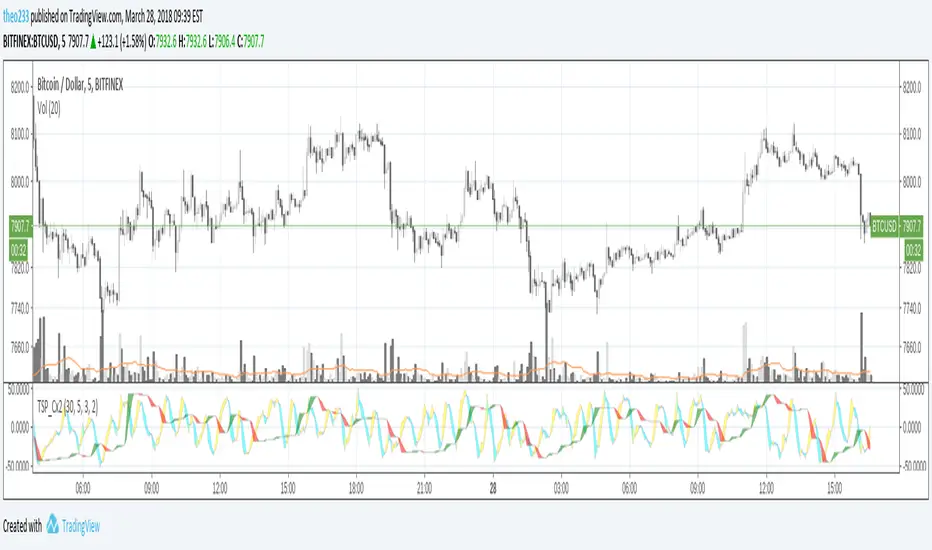
TSP Cycles DoubleDouble Cycles
You can setup higher timeframe cycle period's as argument, default is M30

Always show daily EMAThis script will always plot the daily EMA regardless of which timeframe you are on.

Bollinger/Donchian ChannelsProvides a blending of Bollinger Bands and Donchian Channels with shading criteria between.

Supertrend Grid 1.0See the current pair's Supertrend direction on 4 different timeframes at once, so you won't get caught with your pants down trading against the trend. Handy for quickly space-barring through a watchlist.
Default settings are (from top to bottom) Daily, 4H, 1H and 15M but these can be changed. Any suggestions, let me know.

Coloured Volume Grid 1.0Candles are coloured based on relative price and volume:
- If today’s closing price and volume are greater than (n) bars ago, color today’s volume bar green.
- If today’s closing price is greater than (n) bars ago but volume is not, color today’s volume bar lime.
- Similarly, if today’s closing price and volume is less than (n) bars ago, color today’s volume bar orange.
- If today’s closing price is less than (n) bars ago but volume is not, color today’s volume bar red.
The above logic in itself gives pretty remarkable considering how simple the idea is. I have added a multi-timeframe feature where the same logic is applied to 4 other timeframes. This way you can quickly be aware without having to check. There are four layers and the default settings show (from top to bottom) daily, 4h, 1h and 15m
All timeframes are adjustable in the settings.
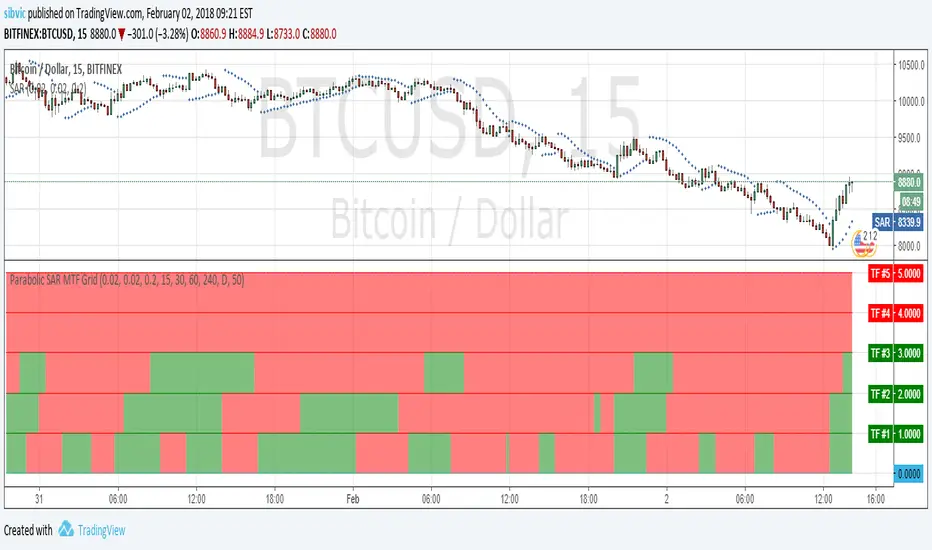
Parabolic SAR MTF GridShow a grid with Parabolic SAR in 5 timeframes. Shows an alert when the Parabolic SAR show the same direction for all 5 timeframes.
MTF Donchian Quadrants [DW]This is a simple Donchian Channel variation that separates the the channels into quadrants, and enables MTF calculation.
Average open and close plots are included for additional confirmation of a trend.

Stochastic RSI MTF - 4 REALStochastic RSI Multi-timeframes
4 simultaneous timeframes on one indicator
This indicator is invite only, if you want to try it ask for access in comments

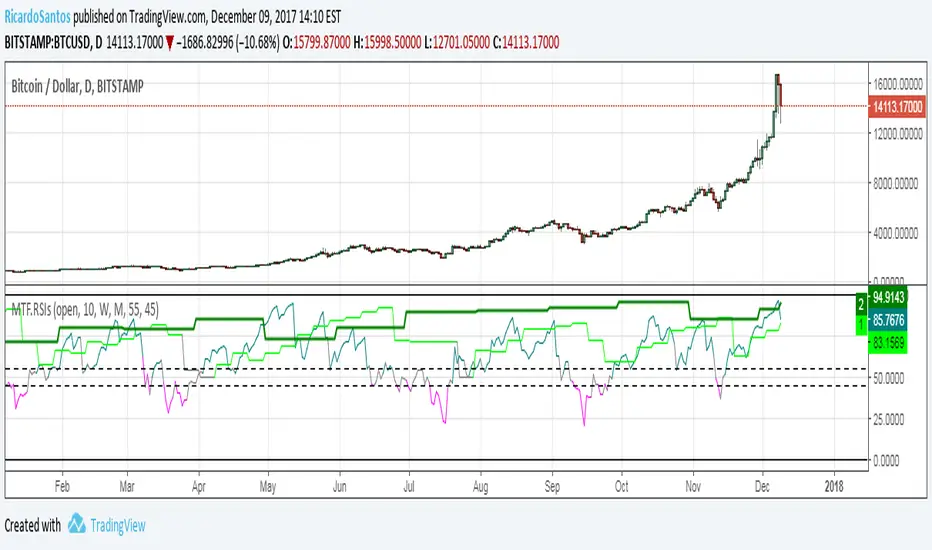
[RS]Multiple Time Frame Relative Strength IndexMultiple timeframe rsi's shows long term trend's and ideal points for entry on pull backs, also show long term exhaustion when the longer time frame rsi enters over bought/sold areas.
Multi time frame CCI34 30min on 5min ChartScript draws CCI-34 30 min on 5 min chart.
CCI-34 30 min line changes colour,Green for CCI34 > +100 and Red for CCI34 < -100.

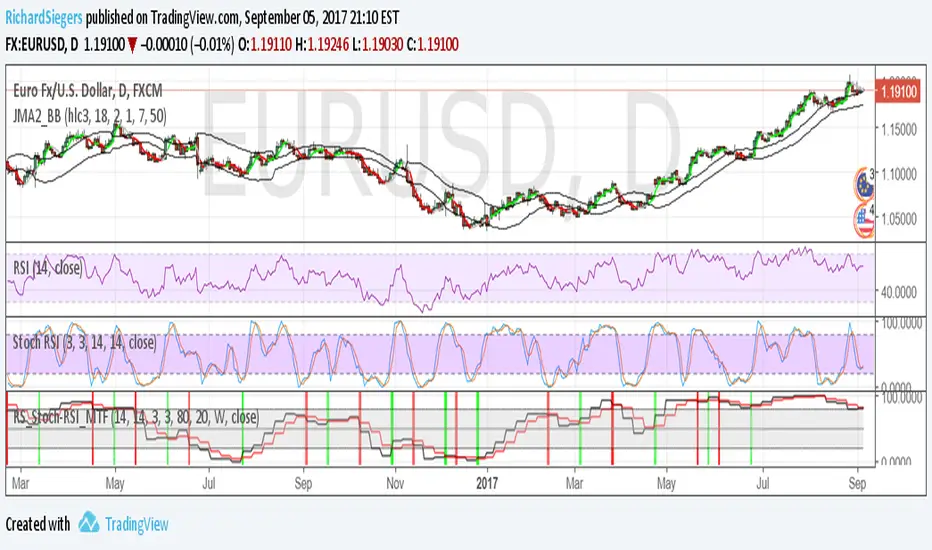
RS_Stoch-RSI_MTFmodification by Richard Siegers that turned stochastic mtf from ChrisMoody into stochastic-rsi mtf
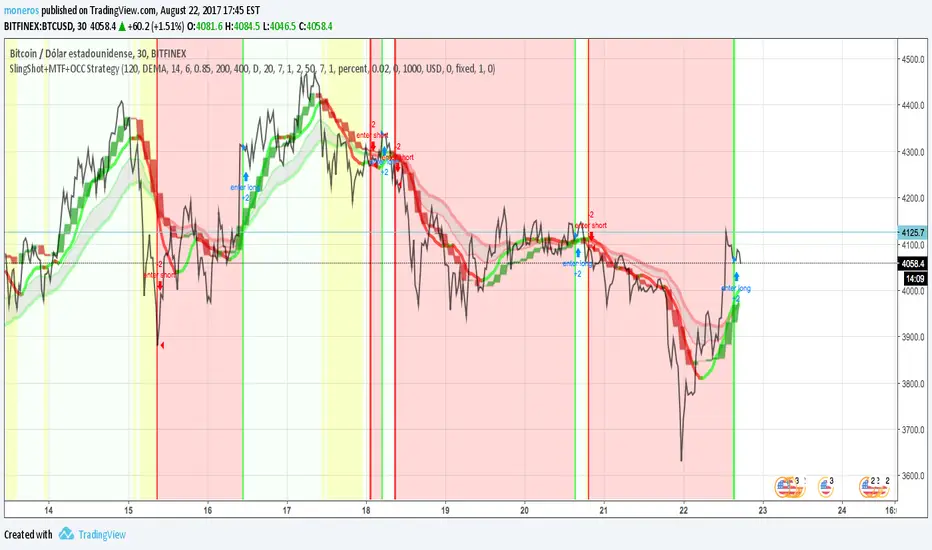
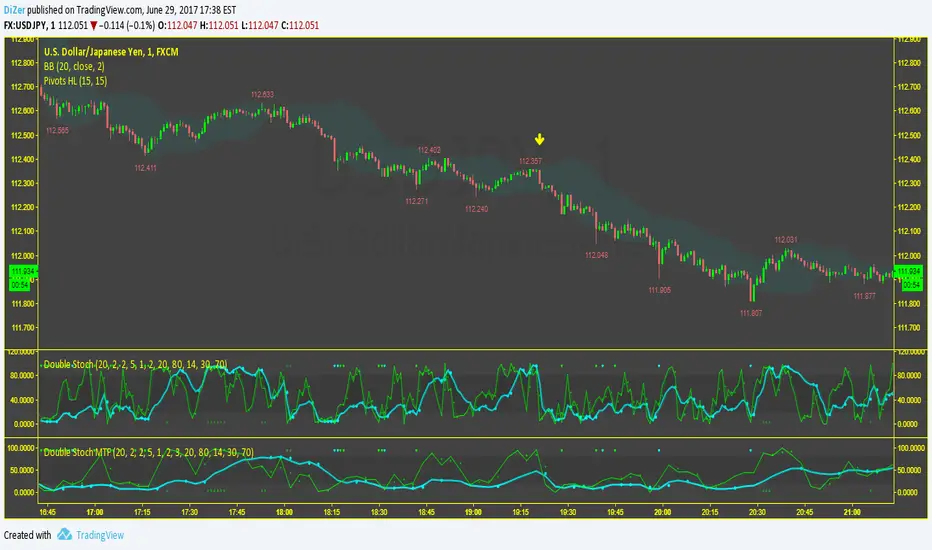
SlingShot + MTF + Open Close Cross StrategyIt's a merge of three really good scripts CM sling shot, CM MTC and Open Close Cross
Indicates open and close with Sling shot and shots after peaks by MTC and OCC.
Yellow zones before drop prices, green bar, red bar for open and close.
imgur.com

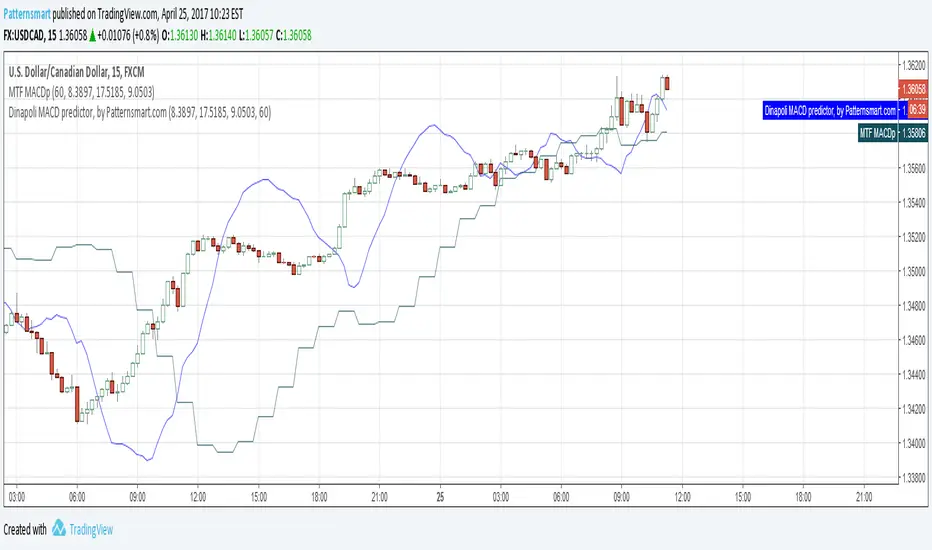
MTF Dinapoli MACD predictor V2This is the Multi Time Frame version of Dinapoli MACD predictor indicator
Fixed a bug of previous version.
Dinapoli macd predictor is a trending indicator that give you not only what direction a forex pair is moving but also how volatile the price is. When the Forex market starts giving new max or minimum level values, the Dinapoli macd predictor follows the price trend direction and pullsup the level of quit from the currency market . Stops should be applied where they are for a purpose, and in that case, should not be changed.
The whole idea behind a practical trading plan is to keep it as simple as possible.
MTF Trend 4 in 1 multi time frame consistence check indicatorPrice can be up trend and downtrend simultaneously in different timeframes.
Experienced traders know the importance of looking at Multiple Time Frames.
Analyzing multi time frame chart allows trader to have a greater view on the price action.
This MTF trend indicator shows the trend of current time frame and 3 higher time frames in a single chart. In addition, it will check the consistence of all 4 time frames. It will not repaint.
It will only work on time based charts. Tick and range charts are not supported.
The green dots represent uptrend, and the red dots represent downtrend.
The 'trend period' is used to measure the direction of price within the given number of bars.
The dots of value 1 at the bottom is the trend of 'timeframe 1'
The dots of value 2 is the trend of 'timeframe 2'
The dots of value 3 is the trend of 'timeframe 3'
The dots of value 4 is the trend of current timeframe.
If current and 3 higher time frames are in the same direction, the dots at the top will appear.
Otherwise, there will be no dots at value 6.
'timeframe1' 'timeframe2' and 'timeframe3' must be higher than current timeframe, if your chart is 15min, then 'timeframe1' 'timeframe2' and 'timeframe3' must be 15min or higher.
It will highlight bars when trends are inconsistent in different timeframes.
You can change the highlight color, or disable this feature.
The highlighted bars represent the situation where price may change its direction from previous trend, or in a short-term adjustment.