QuantMotions - TPR Sentinel LineTPR Sentinel Line is an advanced adaptive Support/Resistance system that combines multi-layered trend analysis with a directional Time-Price Ratio (TPR) engine. The indicator dynamically builds a stabilized support or resistance line that adjusts to market volatility, trend strength, ATR expansion and contraction, and real-time slope changes.
This creates a high-precision, self-adjusting trend barrier that acts as support in uptrends, resistance in downtrends, and a neutral anchor during sideways phases.
Key Features
✔ Adaptive Trend Base
- A composite trend model blending:
- Kijun-style midpoint
- Donchian midline
- SMA & EMA smoothing
This creates a stable baseline that reacts smoothly but reliably to structural trend shifts.
✔ Directional TPR Calculation
The indicator measures slope across short, medium, and long trend windows, normalizes it with ATR, and determines:
- Trend direction
- Trend strength
- Momentum quality
✔ Dynamic Support/Resistance Line
Depending on trend direction:
- In uptrends → the line becomes adaptive support
- In downtrends → the line becomes adaptive resistance
- In neutral phases → the line centers around the smoothed trend base
A built-in lag factor prevents unrealistic jumps and keeps the level stable.
✔ Automatic Support/Resistance Zones
The indicator expands the main line into upper and lower zones based on ATR and trend strength, creating a dynamic volatility envelope around the trend structure.
✔ Signals & Alerts
- Support bounce
- Resistance rejection
- Breakouts above/below the dynamic line
These events help identify high-probability continuation or reversal moments.
✔ Information Panel
A real-time status table displays:
- Trend direction
- Trend strength
- Current S/R level
🎯 Ideal For
- Precision entries on pullbacks
- Detecting trend shifts earlier
- Identifying strong or weak trend phases
- Adaptive take-profit and stop-loss zones
- Filtering false breakouts
💡 Summary
TPR Sentinel Line gives you a living, breathing support/resistance structure that evolves with the market.
Instead of relying on static levels, you get a continuously adapting trend barrier that reflects real strength, real volatility, and real momentum.
A powerful tool for traders who want structure, clarity, and trend confidence.
Rata-Rata Pergerakan / Moving Averages

EMA CrossMoving averages based trend indicator
Plots
Hull Moving average 34
Simple MA 200
Exponential MA 5
Signals on crossing and turn around points.

Trigonum ChannelThis custom indicator was created in order to analyse market movements basing on several basic methods of technical analysis

Lolo MM + nuage + extension sessions + VWAP !Moyennes mobiles avec nuages + vwap + extensions de sessions à utiliser en TF : 15 minutes

Adaptive ATR% Grid + SuperTrend + OrderFlipDescription:
This indicator combines multiple technical analysis tools to identify key price levels and trading signals:
ATR% Grid – automatic plotting of support and resistance levels based on current price and volatility (ATR). Useful for identifying potential targets and entry/exit zones.
SuperTrend – a classic trend indicator with an adaptive ATR multiplier that adjusts based on average volatility.
OrderFlip – identifies price reversal points relative to a moving average with ATR-based sensitivity, optionally filtered by OBV and DMI.
MTF Confirmation – multi-timeframe trend verification using EMA to reduce false signals.
Signal Labels – "LONG" and "SHORT" labels appear on the chart with an offset from the price for better visibility.
JSON Alerts – ready-to-use format for automated alerts, including price, SuperTrend direction, Fair Zone, and ATR%.
Features:
Fully compatible with Pine Script v6
Lines and signals are fixed on the chart, do not shift with new bars
Configurable grid, ATR, SuperTrend, and filter parameters
Works with MTF analysis and classic indicators (OBV/DMI)
Usage:
Best used with additional indicators and risk management strategies. ATR% Grid is ideal for both positional trading and intraday setups.
перевод на русский
Описание:
Этот индикатор объединяет несколько методов технического анализа для выявления ключевых уровней цены и сигналов на покупку/продажу:
Сетка ATR% (ATR% Grid) – автоматическое построение уровней поддержки и сопротивления на основе текущей цены и волатильности (ATR). Позволяет видеть потенциальные цели и зоны входа/выхода.
SuperTrend – классический трендовый индикатор с адаптивным множителем ATR, который корректируется на основе средней волатильности.
OrderFlip – определение моментов разворота цены относительно скользящей средней с учетом ATR, с возможностью фильтрации по OBV и DMI.
MTF-подтверждение – проверка направления тренда на нескольких таймфреймах с помощью EMA, чтобы снизить ложные сигналы.
Сигнальные метки – на графике появляются "LONG" и "SHORT" с отступом от цены для наглядности.
JSON Alerts – готовый формат для автоматических уведомлений, включающий цену, направление SuperTrend, Fair Zone и ATR%.
Особенности:
Поддержка Pine Script v6
Линии и сигналы закреплены на графике, не двигаются при обновлении свечей
Настраиваемые параметры сетки, ATR, SuperTrend и фильтров
Совместимость с MTF-анализом и классическими индикаторами OBV/DMI
Рекомендации:
Используйте в сочетании с другими индикаторами и стратегиями управления риском. Сетка ATR% отлично подходит для позиционной торговли и интрадей.
ATR% Grid – automatic plotting of support and resistance levels based on current price and volatility (ATR). Useful for identifying potential targets and entry/exit zones.
SuperTrend – a classic trend indicator with an adaptive ATR multiplier that adjusts based on average volatility.

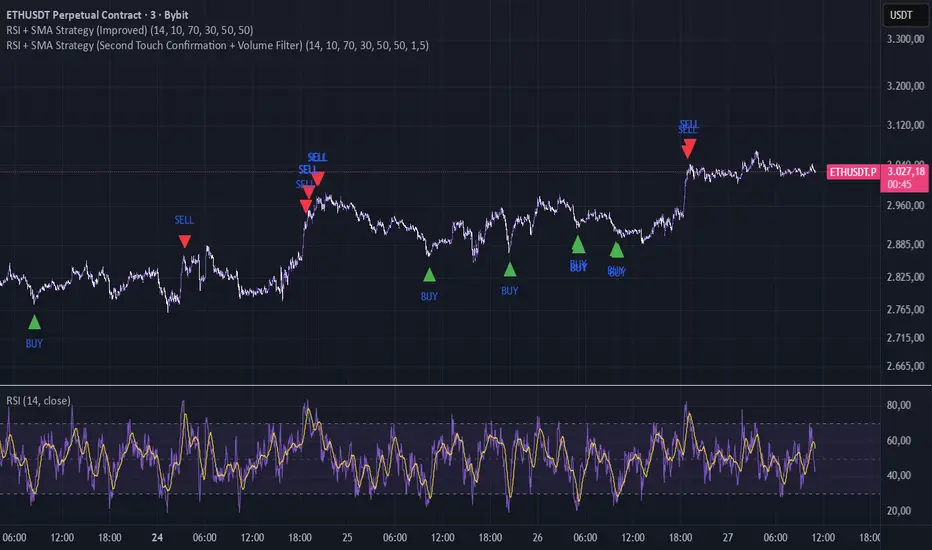
RSI + SMA Strategy (Improved)The lower the timeframe, the more signals it will give; if the trend is too strong, it may give false signals, but it works well on lower timeframes in normal or sideways trends
If u have an idea contact me , TY
ORB indicatorthis indicator marks out the first 15 min high and low on the candle that opens in each session, very easy to read and minimalist

Fibonacci Retrace + 50 EMA Hariss 369This indicator combines 3 concepts:
Fibonacci retracement zones
50 EMA trend filter
Price interaction with specific Fib zones to generate Buy/Sell signals
Let’s break everything down in simple language.
1. Fibonacci Retracement Logic
The script finds:
Most recent swing high
Most recent swing low
Using these two points, it draws Fibonacci levels:
Fibonacci Levels Used
Level Meaning Calculation
0% Swing Low recentLow
38.2% Light retracement high - (range × 0.382)
50% Mid retracement high - (range × 0.50)
61.8% Deep retracement high - (range × 0.618)
100% Swing High recentHigh
🔍 Why only these levels?
Because trading signals are generated based ONLY on:38.2%, 50%,61.8%
These 3 levels define the golden retracement zones.
2. Trend Filter — 50 EMA
A powerful rule:
Trend Up (bullish)
➡️ Price > 50 EMA
Trend Down (bearish)
➡️ Price < 50 EMA
This prevents signals against the main trend.
3. BUY Conditions (Retracement + EMA)
A BUY signal appears when:
Price is above the 50 EMA (trend is up)
Price retraces into the BUY ZONE:
🔵 BUY ZONE = between 50% and 38.2% Fibonacci i.e.,close >= Fib50 AND close <= Fib38.2
This means:
Market is trending up
Price corrected to a healthy retracement level
Buyers are stepping back in
📘 Why this zone?
This is a moderate retracement (not too shallow, not too deep).
Smart money often enters at 38.2%–50% in a strong trend.
📘 BUY Signal Appears With:
Green “BUY” label
Green arrow below the candle
4. SELL Conditions (Retracement + EMA)
A SELL signal appears when:
Price is below the 50 EMA (trend is down)
Price retraces upward into the SELL ZONE:
🔴 SELL ZONE = between 50% and 61.8% Fibonacci i.e.,close <= Fib50 AND close >= Fib61.8
This means:
Market is trending down
Price made a pullback
Sellers regain control in the golden zone
📘 Why this zone?
50–61.8 retracement is the ideal bearish pullback level.
📘 SELL Signal Appears With:
Red “SELL” label
Red arrow above the candle
5. STOP-LOSS (SL) RULES
For BUY trades,
Place SL below 61.8% level.SL = Fib 61.8%
OR
more safe:SL = swing low (Fib 0%)
For SELL trades
Place SL above 38.2% level.SL = Fib 38.2%
OR conservative:
SL = swing high (Fib 100%)
6. TAKE-PROFIT (TP) RULES
Based on common Fibonacci extensions.
BUY Trade TP Options
TP Level Meaning
TP1 Return to 38.2% Quick scalping target
TP2 Return to swing high Full trend target
TP3 Breakout above swing high Trend continuation
Practical suggestion:
TP1 = 1× risk
TP2 = 2× risk
TP3 = trailing stop
SELL Trade TP Options
TP Level Meaning
TP1 Return to 61.8% Moderate bounce
TP2 Return to swing low Trend target
TP3 Break below swing low Trend continuation
7. Recommended Trading Plan (Simple)
BUY PLAN
Price > 50 EMA (uptrend)
Enter at BUY signal in 38.2–50% zone
SL at 61.8%
TP at swing high or structure break
SELL PLAN
Price < 50 EMA (downtrend)
Enter at SELL signal in 50–61.8% zone
SL above 38.2%
TP at swing low
🟩 Summary (Very Easy to Remember)
🔵 BUY
Trend: above 50 EMA
Zone: between 50% and 38.2%
SL: below 61.8%
TP: swing high
🔴 SELL
Trend: below 50 EMA
Zone: between 50% and 61.8%
SL: above 38.2%
TP: swing low

Multi MAThis TradingView indicator displays four customizable moving averages on your price chart: two Exponential Moving Averages (EMAs) and two Simple Moving Averages (SMAs).
The default settings show a 10-period EMA (aqua), 21-period EMA (orange), 50-period SMA (green), and 200-period SMA (red), which are commonly used timeframes for trend analysis.
Each moving average can be individually toggled on or off, and their lengths and colors are fully adjustable through the indicator settings.
The EMAs react more quickly to price changes while the SMAs provide smoother, more gradual trend indicators, making this useful for identifying support/resistance levels and trend direction.
Traders often watch for crossovers between these moving averages as potential entry or exit signals, with the 50/200 SMA cross being particularly significant as the "golden cross" or "death cross."

VWolf – Apex GateOverview
VWolf – Apex Gate is a trend-continuation system that blends a Pivot-weighted Supertrend (PVT ST) with an optional **Normal Supertrend** trigger, all **gated by a 200-EMA directional filter. The strategy’s risk controls are volatility-aware—**stops and targets scale by ATR**, and quantity is computed from a fixed **% risk per trade**. Clear **Backtest / Forwardtest** modes with date windows let you validate on segmented datasets before committing to live use.
Recommended Use
- **Markets:** High-liquidity instruments (indices, large-cap equities, liquid FX and major crypto pairs) where trends and pullbacks are clean.
- **Timeframes:** 15m–1h for active intraday; 4h–1D for swing. Lower timeframes may benefit from stricter EMA gating and slightly wider ATR stops.
- **Workflow:**
1. Start with **Backtest** to set baseline ATR/EMA parameters.
2. Move to **Forwardtest** to confirm generalization.
3. Consider walk-forward or multi-symbol rotation to assess robustness.
Strengths & Precautions
Strengths
- **Dual engine** (PVT ST + Normal ST) improves signal quality; the **EMA gate** screens counter-trend noise.
- **ATR-native** stops/targets standardize risk across regimes/instruments.
- **Capital-proportional sizing** preserves account geometry and smooths drawdowns.
- **Clear test segmentation** supports objective evaluation.
Precautions
- **Whipsaw risk** in tight ranges: widen ATR multipliers, enable the EMA gate, or require co-confirmation.
- **Supertrend-anchored stops** can expand in volatility spikes; ensure **% risk** remains within tolerance.
- **One-position policy** avoids stacking risk but forgoes scaling into strong trends; advanced users may prefer add-on frameworks outside this baseline.
Conclusion
VWolf – Apex Gate seeks to enter shortly after **regime flips**, demanding alignment between a **pivot-aware Supertrend** and (optionally) a **classic Supertrend**, while an **EMA gate** enforces directional discipline. With **ATR-driven** stops/targets and **fixed-fraction** sizing, the system adapts naturally to changing volatility. Use the **Backtest** window to dial ranges and the **Forwardtest** window to prove durability on unseen data. For best results, tailor ATR multipliers and the EMA gate to your instrument’s structure and your personal drawdown tolerance.

5 MA Length Custom [wjdtks255]Indicator Title: 5 MA Length Custom
This indicator is a minimalist tool designed for pure trend visualization across five user-defined periods using Simple Moving Averages (SMAs). It contains no built-in signals or dynamic features—it serves strictly as a trend filter and confirmation layer.
Key Features and Customization
The indicator plots five fixed-color, fixed-thickness moving average lines. Only the Length (period) of each MA can be changed in the settings, offering clean, focused market analysis.
MA 1 (Default 5): Immediate price action.
MA 2 (Default 20): Short-term momentum.
MA 3 (Default 60): Key Mid-term Trend Line.
MA 4 (Default 40): Proxy for the standard Bollinger Band Center Line.
MA 5 (Default 120): Major Long-term Trend.
🧭 Trading Strategy: MA Filtered Reversion
This strategy uses the MA hierarchy for trend filtering and bias confirmation when executing trades based on an external signal indicator (e.g., a volatility/reversal signal like BB OPT EN).
🟢 Long Bias Confirmation (Buy)
The short-term trend must support the mid-term trend. This is confirmed when MA 2 (20) is positioned above MA 3 (60). When this alignment occurs, you should only take external Buy signals (reversal signals) for higher probability trades.
🔴 Short Bias Confirmation (Sell)
The short-term trend must align with the bearish direction. This is confirmed when MA 2 (20) is positioned below MA 3 (60). When this alignment occurs, you should only take external Sell signals (reversal signals) for higher probability trades.

200 Week MA Extensions (Crypto Currently Strategy)Bitcoin 200 Week MA Extensions
The 200-week moving average has never been breached in Bitcoin's history, making it one of the most reliable indicators for identifying absolute market bottoms. This indicator plots the 200 Week MA along with percentage extensions above it to help identify potential cycle tops and key resistance levels during bull markets.
What is the 200 Week MA?
The 200-week simple moving average is the average closing price of Bitcoin over the past 200 weeks (approximately 3.8 years). It's a ultra-long-term trend indicator that:
Has never been broken to the downside in Bitcoin's entire history
Acts as the ultimate floor for Bitcoin price during bear markets
Rises steadily over time, reflecting Bitcoin's long-term growth trajectory
Moves slowly, making it a stable reference point for market cycles
Key Components:
200 Week MA - Blue Line (Base Level)
The foundation line that has historically marked absolute bottoms
Currently around $62,000 (and rising ~$500-800 per week)
Touching this level has historically represented generational buying opportunities
Last tested during the COVID crash (March 2020) and 2022 bear market
+50% Extension - Green Line (1.5x the 200 Week MA)
First major resistance zone above the base
Often acts as support during healthy bull market corrections
Historically a comfortable zone for accumulation in early bull markets
+100% Extension - Yellow Line (2.0x the 200 Week MA)
Double the 200 Week MA value
Represents a well-developed bull market
Often tested multiple times during mid-cycle consolidations
Can act as strong resistance when first approached
+150% Extension - Orange Line (2.5x the 200 Week MA)
Advanced bull market territory
Historically marks the acceleration phase of bull runs
Breaking above this level often signals euphoric market conditions approaching
+200% Extension - Red Line (3.0x the 200 Week MA)
Triple the 200 Week MA value
Extreme overextension zone
Historically near or beyond previous cycle tops
Suggests extreme caution and profit-taking considerations
Historical Context:
2020-2021 Bull Market:
March 2020: Price touched the 200 Week MA (~$5,000) - absolute bottom
Throughout 2020: Price traded between +50% and +100% extensions
Late 2020 - Early 2021: Price broke above +100%, accelerated to +150%
April 2021 & November 2021: Price reached +200% extension area, marking local/cycle tops
2022 Bear Market:
Price fell from +200% extension back toward the 200 Week MA
June 2022: Price came within 10% of the 200 Week MA ($18,000)
Bounce from near the 200 Week MA marked the bear market bottom
2023-2024 Recovery:
Price recovered from near 200 Week MA back through the extension levels
Each extension level acted as resistance, then support as bull market developed
Current position relative to extensions helps gauge cycle maturity
How to Use This Indicator:
For Long-Term Accumulation:
At 200 Week MA: Maximum conviction buying zone - historically has never failed
+0% to +50%: Excellent accumulation zone, low risk relative to reward
+50% to +100%: Good accumulation zone during bull market dips
Above +100%: Consider reducing accumulation, focus on holding or taking profits
For Profit Taking:
Approaching +100%: Consider taking initial profits (10-20% of position)
+100% to +150%: Take incremental profits as price advances
+150% to +200%: Increase profit-taking pace significantly
Above +200%: Maximum caution - historically unsustainable levels
For Risk Management:
Distance from 200 Week MA indicates market risk level
Further above = higher risk, more extended, closer to top
Closer to = lower risk, better value, closer to bottom
Use extensions as profit-taking targets in bull markets
Use extensions as re-entry targets during corrections
For Cycle Timing:
Bear Market: Price converges toward 200 Week MA
Early Bull: Price in +0% to +50% range, building base
Mid Bull: Price in +50% to +100% range, healthy growth
Late Bull: Price in +100% to +150% range, acceleration
Euphoric Top: Price at +150% to +200%+, extreme extension
Key Insights:
The 200 Week MA as Ultimate Support:
Bitcoin has touched or approached this level during every major bear market
It rises consistently (~$30,000 per year currently), creating a rising floor
Breaking below would be unprecedented and signal a fundamental market structure change
Provides enormous psychological and technical support
Extension Levels as Resistance/Support:
Bull markets often stall at each extension level before breaking through
Once broken, extensions often flip from resistance to support
Rejections from higher extensions can signal local or cycle tops
Corrections back to lower extensions offer re-entry opportunities
Diminishing Returns:
Each cycle's top has formed at progressively lower extension multiples
2013: ~10x the then-200WMA
2017: ~5x the then-200WMA
2021: ~3x the then-200WMA
Suggests future tops may not reach +200% extension (market maturation)
Best Practices:
Do:
Use the 200 Week MA as your ultimate risk-off level for long-term holdings
Scale into positions as price approaches the 200 Week MA
Take profits incrementally as price rises through extensions
View corrections back to lower extensions as opportunities
Combine with other on-chain metrics (MVRV, Realized Price) for confirmation
Don't:
Expect the 200 Week MA to provide perfect entry timing (you might be early)
Assume price will reach +200% extension every cycle
Sell all holdings at first extension level during bull markets
Ignore price action and volume when making decisions
Panic if price approaches the 200 Week MA (historically the best time to buy)
Why This Indicator Works:
The 200 Week MA represents nearly 4 years of price data, which:
Encompasses approximately one full Bitcoin halving cycle
Smooths out all short and medium-term volatility
Reflects Bitcoin's true long-term adoption and growth trend
Provides a slow-moving, stable reference that doesn't whipsaw
The extension levels work because:
They create objective profit-taking targets based on historical overextension
They account for the rising base (200 Week MA) over time
They've proven reliable across multiple market cycles
They help remove emotion from buy/sell decisions
Technical Notes:
Calculations performed on weekly timeframe data for consistency
The indicator displays correctly on any chart timeframe (Daily, 4H, etc.)
Uses lookahead_on to prevent repainting and show consistent historical values
All extension levels update automatically as the 200 Week MA rises
Best viewed on logarithmic scale for full historical perspective
Important Reminders:
Past performance does not guarantee future results - while the 200 Week MA has never been breached, future market conditions could differ
Market maturation - as Bitcoin matures, cycle dynamics may change
Black swan events - unexpected macro events could temporarily break historical patterns
Not financial advice - this is an educational tool, always do your own research
Recommended Usage:
Best Timeframes: Daily, Weekly, Monthly charts
Pair With: MVRV Ratio, Realized Price, Stock-to-Flow, Fear & Greed Index
Update Frequency: Weekly (the base 200 Week MA only changes weekly)
Chart Type: Logarithmic scale recommended for full historical view
Strategy Example:
Buy aggressively when price is within 20% of 200 Week MA
Hold and accumulate between 200WMA and +50% extension
Begin scaling out profits at +100% extension (20% of position)
Scale out more at +150% extension (40% of position)
Significant profit-taking at +200% extension (remaining position)
Wait for next cycle and repeat
This indicator provides a simple, objective, and historically reliable framework for navigating Bitcoin's market cycles. By respecting the 200 Week MA as the ultimate floor and using the extensions as profit-taking guides, investors can remove emotion and develop disciplined strategies for long-term success.

BTC Key Support Levels (True Market Mean, Realized Price, MVRV)Bitcoin Key Onchain Support Levels + Moving Averages
This indicator combines critical Bitcoin on-chain metrics with traditional technical analysis to identify key support levels and price trends. It's designed to help traders and investors understand Bitcoin's fundamental value zones and market positioning.
Key Metrics Included:
On-Chain Support Levels:
True Market Mean (Active Coins) - Blue Line
Calculates investor capital (Realized Cap minus Thermocap) divided by active supply (coins moved in last year)
Represents the average cost basis of active market participants
Historically acts as strong support during bull markets
True Market Mean (Free Float) - Green Line
Same investor capital calculation but divided by free float supply
Provides a more conservative support estimate
Useful for identifying extreme value zones
Realized Price - Purple Line
The average price at which all bitcoins last moved on-chain
Represents the aggregate cost basis of all Bitcoin holders
Historical major support level during bear markets
Delta Realized Price - Red Line
Realized Price minus its all-time average
Helps identify when Bitcoin is trading below or above its historical average cost basis
Useful for spotting macro trend shifts
MVRV 0sd (Mean MVRV) - Yellow Line
Price level where Market Value equals the historical average MVRV ratio times Realized Value
Represents "fair value" based on Bitcoin's historical valuation patterns
Strong dynamic support/resistance level
Traditional Moving Averages:
50 Day SMA - White Dotted Line
Short-term trend indicator
Common entry/exit signal for swing traders
200 Day SMA - White Dashed Line
Long-term trend indicator
Classic bull/bear market dividing line
50 Week SMA - Orange Dotted Line
Medium-term trend on weekly timeframe
Historically strong support in bull markets, some traders use as dividing line between bull and bear markets
200 Week SMA - Orange Dashed Line
Long-term weekly trend
Very rarely breached; considered ultimate bottom indicator representing the deepest possible value for long term investors
How to Use This Indicator:
For Long-Term Investors:
Look for price approaching the Red (Delta Realized Price) or Purple (Realized Price) lines during corrections as potential accumulation zones
The 200 Week SMA (orange dashed) has historically marked cycle bottoms
When price is above the Blue line (True Market Mean - Active), the bull market is typically healthy
For Traders:
Use the moving averages for trend confirmation and entry/exit signals
The Yellow line (MVRV 0sd) often acts as dynamic support/resistance
Watch for price interactions with the Blue line during consolidations
Cross-referencing on-chain levels with moving averages provides high-probability trade setups
Market Cycle Context:
Bull Market: Price typically stays above the Yellow and Blue lines
Bear Market: Price often trades between Purple (Realized Price) and Red (Delta Realized Price)
Extreme Value: Price near or below Red line and 200 Week SMA
Overheated: Price significantly above all on-chain metrics
Technical Notes:
This indicator uses real Bitcoin on-chain data including:
Realized Cap from CoinMetrics
Supply and active supply metrics from Glassnode
Block mining data and transaction fees
Thermocap calculation (cumulative security spend)
All calculations are performed on daily data and maintain consistency across different chart timeframes. The on-chain metrics provide fundamental value floors that complement traditional technical analysis.
Best Practices:
Use on logarithmic scale for better visualization across Bitcoin's entire price history
Most effective on daily, weekly, and monthly timeframes
Combine with volume analysis and other indicators for confirmation
On-chain levels are slow-moving; don't expect daily precision
Historical support levels are not guarantees of future performance

Arkham ORB Indicator 3.815-Minute ORB Breakout Indicator with Volume Confirmation & Dynamic Risk Management
This closed-source indicator identifies high-probability breakout opportunities during the New York session open (8:30-9:30 AM ET) using a systematic Opening Range Breakout methodology combined with volume validation and adaptive volatility-based risk management.
Core Methodology - How It Works
Opening Range Framework
The indicator establishes the Opening Range by tracking the high and low of the first 15 minutes of the trading session (8:30-8:45 AM ET). This range represents the initial price discovery zone where early participants establish equilibrium. Breakouts above the high or below the low signal potential directional moves as liquidity enters the market during the full NY session.
Volume-Based Breakout Validation
To distinguish genuine breakouts from false moves, the indicator employs a rolling volume analysis system. It calculates a 12-period median of volume and applies a 1.2x threshold multiplier. Only price movements accompanied by volume exceeding this threshold are flagged as valid breakout signals. This approach filters out low-conviction breakouts that often occur in choppy, low-participation conditions and significantly reduces false signals at ORB levels.
Adaptive Volatility-Based Stop Loss Calculation
Unlike fixed-point stop losses, this indicator uses a dynamic calculation based on a 10-day lookback of historical ORB ranges. The stop loss is derived by analyzing recent Opening Range sizes and applying a 0.5x multiplier to the average. This creates three key advantages:
Compression adaptation: When recent ORBs shrink (low volatility), stops automatically tighten to reduce risk exposure
Expansion adaptation: When recent ORBs expand (high volatility), stops widen to prevent premature exits on legitimate moves
Hybrid intelligence: The system detects outlier volatility days by comparing current ORB size to the 10-day average. When divergence exceeds 50%, it recognizes abnormal conditions and adjusts stop placement accordingly rather than blindly using historical averages
Multi-Entry Risk Framework
The indicator recognizes that different traders enter at different points relative to the ORB level. It provides simultaneous risk calculations for three entry strategies:
Direct ORB Entry (0-point offset): Immediate breakout entries at the ORB high/low
Pullback Entry 1 (default 5.5 points): Conservative entries waiting for initial retracements
Pullback Entry 2 (default 11.0 points): Deeper retest entries for very conservative approaches
Each entry type displays independently calculated metrics (stop loss distance, contract sizing, take profit levels) that account for the actual entry point's distance from the ORB level. This ensures accurate position sizing and risk/reward ratios regardless of which entry method you use.
Smart Volatility Detection & Alerts
The indicator continuously compares the current day's ORB size against the 10-day historical average. When divergence exceeds a configurable threshold (default 50%), it alerts you to abnormal market conditions:
Compression warnings: When today's ORB is 50%+ smaller than average (potential low-volatility trap)
Expansion warnings: When today's ORB is 50%+ larger than average (potential news event or unusual volatility)
This allows you to adjust expectations and position sizing based on whether current conditions match your backtested historical environment.
Risk Management Safeguards
Min/Max Stop Loss Caps
To prevent extreme stop placements in unusual conditions:
Minimum stop: 35 points (prevents overly tight stops that get hit by noise)
Maximum stop: 75 points (caps risk exposure during extreme volatility events)
Both caps are fully adjustable and can be toggled on/off
Contract Rounding & Risk Display
The indicator automatically rounds to whole contracts and displays real-time risk metrics including:
Suggested stop loss level (adjusted for entry offset + volatility)
Number of contracts (sized to your account risk parameters)
Suggested take profit level (maintains your configured risk/reward ratio)
Dollar risk and potential profit for each entry type
What Makes This Original
This indicator combines several methodological elements that work together as a cohesive risk management system:
Volume confirmation prevents trading every ORB breakout indiscriminately
Adaptive volatility stops ensure your risk scales with current market conditions, not fixed assumptions
Multi-entry framework provides accurate calculations for various entry styles without requiring separate indicators
Outlier detection warns when today's conditions deviate significantly from your backtested norms
Integrated position sizing removes the mental math from determining contracts and risk/reward
Rather than simply plotting ORB levels or using fixed stops, this system adapts to changing volatility while validating breakouts with participation metrics.
How to Use It
Apply to a 5-minute chart of futures instruments (optimized for MNQ/NQ)
Set your account risk parameters in settings (account size, risk per trade %)
Monitor the ORB formation period (8:30-8:45 AM ET) - levels will be drawn
Watch for breakout signals during 8:45-9:30 AM ET with volume confirmation
Choose your entry style from the three displayed options based on your risk tolerance
Use the suggested stops and targets from the real-time risk table
Pay attention to volatility warnings - adjust position sizing if conditions are abnormal
Fully Customizable Settings
All parameters used in the indicator's calculations are user-adjustable, allowing you to adapt the system to your trading style and risk tolerance:
ORB Configuration
ORB formation period start/end times
Entry offset distances (Entry 1 and Entry 2 point values)
Display toggles for each entry type
Volume Analysis
Volume lookback period (default: 12)
Volume multiplier threshold (default: 1.2x)
Toggle volume filtering on/off
Stop Loss Calculation
Historical lookback period (default: 10 days)
Stop loss multiplier (default: 0.5x)
Calculation method: Historical Average, Current Day ORB, or Hybrid
Minimum stop cap (default: 35 points)
Maximum stop cap (default: 75 points)
Toggle min/max caps on/off
Volatility Alerts
Divergence threshold for outlier detection (default: 50%)
Alert display toggles
Risk Management
Account size
Risk percentage per trade
Risk/reward ratio for take profit calculations
Display Options
Table positions and sizes (compact mode)
Color schemes
Show/hide individual components
This flexibility allows you to backtest different parameter combinations and optimize the indicator for current market conditions or your specific trading approach. You are in full control of the calculations - the indicator simply automates the math based on your inputs.
Ideal For
Futures traders (MNQ/NQ) seeking a systematic, rule-based approach to NY session open breakouts with pre-calculated risk parameters that automatically adapt to changing market volatility. Particularly useful for traders who want to eliminate emotional decision-making around stop placement and position sizing.
Important Disclaimers
No Financial Advice
This indicator is provided for educational and informational purposes only. It does not constitute financial advice, investment advice, trading advice, or any other sort of advice. You should not treat any of the indicator's content, outputs, or signals as such. The author is not a licensed financial advisor.
Risk Warning
Trading futures and derivatives involves substantial risk of loss and is not suitable for all investors. Past performance of any trading system or methodology is not necessarily indicative of future results. You should carefully consider whether trading is appropriate for you in light of your experience, objectives, financial resources, and other relevant circumstances.
No Performance Guarantees
While this indicator is designed to identify high-probability setups based on historical analysis, there is no guarantee of profitable results. Market conditions change, and what worked in backtesting may not work in live trading. Due to the leveraged nature of futures trading, losses can significantly exceed your initial investment.
Use at Your Own Risk
All trading decisions made based on this indicator are your sole responsibility. The author assumes no responsibility for your trading results, losses, or any damages resulting from the use of this indicator. Always use proper risk management and never risk more than you can afford to lose.
Backtesting vs. Live Trading
Results generated from backtesting may not reflect actual trading performance due to factors including but not limited to: slippage, commissions, market liquidity, emotional decision-making, and differences between historical and real-time data.
Not a Guarantee of Accuracy
While efforts have been made to ensure the indicator functions as described, no software is perfect. You are responsible for verifying the indicator's calculations and outputs before making any trading decisions.

able MACD Overview
Purpose: The indicator combines the traditional MACD (Moving Average Convergence Divergence) with a short-term “forecast” (projection) of MACD/histogram values to give early warning of momentum changes.
Typical outputs:
MACD line (fastEMA − slowEMA)
Signal line (EMA of MACD)
Histogram (MACD − signal)
Forecasted MACD or histogram projected N bars ahead
Optional buy/sell markers and alert conditions
Add the indicator to TradingView (Installation)
Open TradingView and the chart you want to apply the indicator to.
Click “Pine Editor” at the bottom of the chart.
Copy the contents of able_macd_forecast.pine into the Pine Editor window.
Click “Add to chart” (or Save then Add to chart). If it’s a study, it will appear on the chart below price.
If you plan to re-use the script, click Save and give it a meaningful name.
Inputs / Parameters (typical) Note: exact input names may differ in your script. Replace the names below with the script’s input labels when you inspect it.
Source: price source for calculations (close, hl2, etc.).
Fast Length: length for the fast EMA (commonly 12).
Slow Length: length for the slow EMA (commonly 26).
Signal Length: length for the MACD signal EMA (commonly 9).
Forecast Length / Horizon: how many bars ahead the script projects the MACD/histogram (e.g., 1–5).
Forecast Method / Smoothing: choice of projection method (linear regression, EMA extrapolation, simple slope * N, etc.) if available.
Histogram Thresholds: numeric thresholds to emphasize significant momentum (optional).
Show Forecast: toggle on/off the forecast plot.
Alerts On/Off toggles: enable or disable alert conditions baked into the indicator.
Visual / Style settings: colors, plot thickness, histogram style (columns/areas), show labels, show buy/sell arrows.
How the indicator is typically calculated (summary)
MACD line = EMA(source, fast) − EMA(source, slow)
Signal line = EMA(MACD line, signal length)
Histogram = MACD − Signal
Forecast = method-specific short-term projection of MACD or histogram (for example: extend the last slope forward, apply linear regression to MACD values and extrapolate N bars, or apply an additional smoothing and extend that value) Note: For exact math, I need to inspect the script; this is the typical approach.
How to read the indicator (signals & interpretation)
Bullish signal:
MACD line crossing above the signal line (MACD cross up).
Histogram turns positive (cross above zero).
Forecast shows MACD/histogram moving higher in the next N bars (if forecast is positive or trending up).
Bearish signal:
MACD line crossing below the signal line (MACD cross down).
Histogram turns negative (cross below zero).
Forecast shows MACD/histogram moving lower ahead.
Confirmations:
Use price action (higher highs/lows for bullish, lower highs/lows for bearish).
Volume or other momentum/confluence indicators (RSI, ADX).
Divergences:
Bullish divergence: price makes lower low while MACD histogram makes higher low.
Bearish divergence: price makes higher high while MACD histogram makes lower high.
Forecast behavior:
If the forecast leads the MACD cross (forecast crosses before the current MACD does), it’s an early warning.
Use caution: forecasts are prone to false signals; always confirm.
Common trading setups using this indicator
Conservative:
Wait for MACD to cross signal + histogram above zero + forecast already trending same direction.
Use stop below recent swing low (for long) or above recent swing high (for short).
Aggressive (early entry):
Enter when forecast turns positive while MACD still below signal (anticipating cross).
Use tighter stops and smaller position sizes.
Exit rules:
Opposite MACD cross, histogram flipping sign, or a target based on risk-reward.
Use trailing stop based on ATR or structure.
Example settings for different timeframes (starting points)
Scalping / 5–15 min:
Fast 8, Slow 21, Signal 5, Forecast 1–2
Intraday / 1H:
Fast 12, Slow 26, Signal 9, Forecast 2–3
Swing / 4H–Daily:
Fast 12, Slow 26, Signal 9, Forecast 3–5 Adjust based on the asset volatility and backtests.
Adding alerts (TradingView)
Click the “Alerts” button (clock icon) or press Alt + A.
In the Condition dropdown, select the indicator name (able_macd_forecast) and choose a plotted series or built-in alert condition (if the script uses alertcondition).
Common alert types:
MACD crosses Signal (Crossing)
Histogram crosses 0 (Crossing)
Forecast crosses 0 or Forecast trend change (if provided)
Message templates:
“{{ticker}}: MACD crossed above signal on {{interval}}”
“{{ticker}} Forecast positive: MACD forecast shows upward momentum”
Customize the message for your trade automation or notifications.
Configure frequency (Only once, Once per bar, or Once per bar close) — for signals like crossovers, “Once per bar close” is usually safer to avoid repainting issues. Note: If the script includes alertcondition() calls with explicit IDs/messages, use those directly — they are the most reliable for automation.
Backtesting / Strategy conversion
If this script is a study (indicator), you can:
Convert it to a strategy by adding strategy.* order calls (strategy.entry, strategy.close) using the entry/exit logic you prefer, or
Use TradingView’s “Bar Replay” to manually test signals across different markets/timeframes.
If you want, I can help convert or write a strategy wrapper that uses the indicator’s signals to place backtest trades (I’ll need the code).
Practical tips & best practices
Use higher timeframe confirmation for lower-timeframe entries (e.g., check daily MACD momentum before trading 15m signals).
Beware of choppy markets; MACD / forecast may produce whipsaws. Combine with trend filters (moving average direction, ADX).
If you rely on forecasted values, prefer alerts “on bar close” when possible to reduce false alerts from intra-bar noise.
Tune parameters for the specific asset (FX, crypto, stocks have different behavior).
Record each signal and outcome for a sample period (20–100 trades) to evaluate performance.
Troubleshooting
Indicator won’t add: verify Pine version in script header (//@version=4 or //@version=5). TradingView may reject scripts with unsupported version syntax.
Plots missing: check script inputs (Some scripts hide plots if toggles are off).
Alerts firing too often: change alert frequency to “Once per bar close” or adjust threshold values.
Forecast seems to repaint: some forecast methods can repaint (use “bar_index” or store values only on closed bars, or use non-repainting forecast methods). Ask me to inspect the script for repainting logic.
What I can do next (recommended)
If you paste the content of able_macd_forecast.pine here, I will:
Produce a precise, line-by-line usage guide mapping to the exact input names and default values.
Show the exact plotted series names and how to reference them for alerts.
Point out any repainting risks and suggest fixes.
Provide example alert messages that match the script’s alertcondition IDs (if any).
Optionally convert it into a strategy for backtesting, or add non-repainting forecast logic if needed.

ArithmaReg Candles [NeuraAlgo]ArithmaReg Candles
ArimaReg Candles provide a quantitative approach toward the visualization of price by rebuilding each candle using an adaptive regression model. This indicator eliminates much of the noise and micro-spikes and consolidates irregular volatility of raw OHLC data, which typically characterizes candles, into a much cleaner and more stable representation that better reflects the true directional intent of the market.
The algorithm applies a dynamic state-space filter to track the equilibrium price, truePrice, while suppressing high-frequency fluctuations. Noise in the price is extracted by comparing the raw close to the filtered state and removed from the candle body and wick structure through controlled adjustment logic. Finally, a volatility-based spread model rebuilds the candle's range to maintain realistic price geometry.
The direction of trends is given by comparing the truePrice against a smoothing baseline, permitting ArithmaReg Candles to underline the bullish and bearish phases with more clarity and much-reduced distortion. This yields a chart where transitions within trends, pullbacks, and momentum shifts are much easier to comprehend than their representation via traditional candles.
ArithmaReg Candles are designed for traders who require consistent, noise-filtered price structure-ideal for trend analysis, breakout validation, and precision entries. The indicator itself does not generate any signals; it only refines the visual environment so that your existing tools and decision models become more reliable.
How It Works
Micro-Price Extraction
A weighted micro-price is calculated to represent the bar's internal structure and reduce intrabar irregularities.
Adaptive Regression Filter
The state-based regression engine continuously updates price equilibrium, adjusting its confidence level. This gives the filter the ability to remain responsive during strong movements yet be stable during noisy periods.
Noise Removal & Candle Reconstruction
The difference between raw price and truePrice is considered noise. This noise is subtracted from OHLC values, and a volatility-scaled spread restores realistic wick and body proportions. What results is a candle that depicts true directional flow.
Trend Classification
A smoothed trend baseline is computed from the filtered price, and candle color is determined by whether the market is positioned above or below this equilibrium trend.
How to Use It
Identify True Trend Direction
Candles follow the cleaned price path so that you can differentiate valid trend shifts from temporary spikes or wick-driven traps.
Improve Existing Strategies
These candles will complement your existing indicators, be they Supertrend, moving averages, volume tools, or momentum oscillators, by giving you a more sound price basis.
Spot Clean Breakouts & Pullbacks
Reduced noise makes breakout structure, swing highs/lows, and retracements significantly clearer. This is particularly useful in fast markets like crypto and Forex.
Improve Entry & Exit Timing
By highlighting the underlying flow of price, ArithmaReg Candles help traders avoid false signals and pinpoint spots where the price momentum is actually changing.
Adaptable to All Timeframes & Assets
The filter is self-adjusting, so it performs consistently on scalping timeframes, intraday charts, swing setups, and all asset classes. Summary ArithmaReg Candles create a mathematically refined view of market structure by removing noise and reconstructing candles through adaptive regression. The result is a more refined, stable price representation that improves trend recognition and decision-making and enables professional-grade technical analysis.

Gap & Go Day Trading Tool - Key Levels, Alerts & Setup GradingVisualizes Gap & Go setups with automatic gap detection, pre-market levels, and breakout signals. Shows: ✅ Gap % with quality rating (5%/10%/20%+) ✅ Pre-market high/low ✅ First candle range ✅ 50% gap fill target ✅ VWAP ✅ Relative volume. Includes setup grading system (A+ to C), entry signals on PM high breakouts, and 6 customizable alerts. Perfect for momentum day traders focusing on gapping stocks.
Full Description
█ OVERVIEW
The Gap & Go indicator automatically identifies and visualizes gap trading setups - one of the most popular momentum day trading strategies. When a stock gaps up significantly from the prior close, it often signals strong buying interest and potential for continuation moves.
This indicator displays all the key levels you need to trade gaps effectively, grades setup quality, and alerts you to breakout opportunities.
█ HOW IT WORKS
The indicator calculates the gap percentage between yesterday's close and today's open, then displays critical support/resistance levels that gap traders watch:
Gap Zone → The price range between prior close and gap open
Pre-Market High/Low → Key breakout and support levels from extended hours
First Candle Range → Opening range that often defines intraday direction
50% Gap Fill → Common retracement target and support level
VWAP → Institutional reference point
█ GAP CLASSIFICATION
Gaps are automatically classified by magnitude:
🔥 Qualifying Gap (5%+) → Meets minimum threshold for gap trading
🔥🔥 Strong Gap (10%+) → Ideal gap size for momentum plays
🔥🔥🔥 Monster Gap (20%+) → Exceptional move requiring extra attention
Background color changes based on gap quality for instant visual identification.
█ SETUP GRADING SYSTEM
The indicator grades each setup from A+ to C based on multiple factors:
- Gap magnitude (qualifying vs strong)
- Relative volume (2x+ vs 5x+ average)
- Price position relative to VWAP
A+ Setup (4-5 points) → High probability
A Setup (3 points) → Good setup
B Setup (2 points) → Moderate
C Setup (0-1 points) → Weak/avoid
█ ENTRY SIGNALS
Triangle signals appear when price breaks above key levels:
▲ Lime Triangle → Breaking above Pre-Market High
▲ Aqua Triangle → Breaking above First Candle High
Signals require volume confirmation by default (configurable).
█ KEY LEVELS DISPLAYED
- Prior Close (Orange) → Gap reference point
- Pre-Market High (Lime) → Primary breakout level
- Pre-Market Low (Red) → Support if gap fails
- First Candle Range (Aqua box) → Opening range breakout levels
- 50% Gap Fill (Yellow dotted) → Common support/target
- VWAP (Purple) → Institutional pivot
█ INFO TABLE
Real-time dashboard showing:
- Gap % with quality emoji
- Relative Volume with status
- All key price levels
- Breakout status (✓ if broken)
- Distance from PM High
- Setup Grade
█ ALERTS INCLUDED
6 customizable alerts:
1. Qualifying Gap Detected (5%+)
2. Strong Gap Detected (10%+)
3. Monster Gap Detected (20%+)
4. Pre-Market High Breakout
5. First Candle High Breakout
6. 50% Gap Fill Test
7. Full Gap Fill (setup invalidated)
█ SETTINGS
Gap Settings
- Minimum gap % threshold
- Strong gap % threshold
- Monster gap % threshold
Volume Settings
- Enable/disable relative volume filter
- Minimum RVol requirement
- Strong RVol threshold
- RVol calculation period
Level Settings
- Toggle each level type on/off
- Show/hide gap zone
- Show/hide VWAP
Signal Settings
- Breakout signal type (PM High, First Candle, Both)
- Volume confirmation requirement
Visual Settings
- Info table position
- Color customization for all levels
█ HOW TO USE
1. Scan for gapping stocks pre-market (use a scanner or watchlist)
2. Apply this indicator to candidates
3. Check the Setup Grade in the info table
4. Wait for price to consolidate near pre-market high
5. Enter on breakout above PM High with volume confirmation
6. Use 50% gap fill or PM Low as stop loss reference
7. Monitor VWAP - staying above is bullish
█ BEST PRACTICES
✓ Focus on A and A+ setups
✓ Require strong relative volume (5x+)
✓ Trade in the direction of the gap (long for gap ups)
✓ Watch for gap fill as potential support
✓ Be cautious if price falls below VWAP
✓ First 30-60 minutes typically have best momentum
█ TIMEFRAME RECOMMENDATIONS
- 1-minute: Scalping, precise entries
- 5-minute: Most common for gap trading (recommended)
- 15-minute: Swing entries, less noise
█ NOTES
- Pre-market levels require extended hours data enabled
- First candle range is based on the first regular market candle
- Works on stocks, ETFs, and futures
- Gaps down are detected but focus is on gap-up setups
█ DISCLAIMER
This indicator is for educational purposes only. Gap trading involves significant risk. Past performance does not guarantee future results. Always use proper risk management and never risk more than you can afford to lose.

NIFTY Options Breakout StrategyThis strategy trades NIFTY 50 Options (CALL & PUT) using 5-minute breakout logic, strict trend filters, expiry-based symbol validation, and a dynamic trailing-profit engine.
1️⃣ Entry Logic
Only trades NIFTY 50 options, filtered automatically by symbol.
Trades only between 10:00 AM – 2:15 PM (5m bars).
Breakout trigger:
Price enters the buy breakout zone (high of last boxLookback bars ± buffer).
Trend filter:
Price must be above EMA50 or EMA200,
AND EMA50 ≥ EMA100 (to avoid weak conditions).
Optional strengthening:
EMA20>EMA50 OR EMA50>EMA100 recent cross can be enforced.
Higher-timeframe trend check:
EMA50 > EMA200 (bullish regime only).
Start trading options only after expiry–2 months (auto-parsed).
2️⃣ One Trade Per Day
Maximum 1 long trade per day.
No shorting (long-only strategy).
3️⃣ Risk Management — SL, TP & Trailing
Includes three types of exits:
🔹 A) Hard SL/TP
Hard Stop-Loss: -15%
Hard Take-Profit: +40%
🔹 B) Step-Ladder Trailing Profit
As the option price rises, trailing activates:
Max Profit Reached Exit Trigger When Falls To
≥ 35% ≤ 30%
≥ 30% ≤ 25%
≥ 25% ≤ 20%
≥ 20% ≤ 15%
≥ 15% ≤ 10%
≥ 5% ≤ 0%
🔹 C) Loss-Recovery Exit
If loss reaches –10% but then recovers to 0%, exit at breakeven.
4️⃣ Trend-Reversal Exit
If price closes below 5m EMA50, the long is exited instantly.
5️⃣ Optional Intraday Exit
EOD square-off at 3:15 PM.
6️⃣ Alerts for Automation
The strategy provides alerts for:
BUY entry
TP/SL/Trailing exit
EMA50 reversal exit
EOD exit

Nifty Breakout Levels Strategy (v7 Hybrid)Nifty Breakout Levels Strategy (v7 Hybrid – Compounding from Start Date)
Instrument / TF: Designed for current-month NIFTY futures on 1-hour timeframe, with at most 1 trade per day.
Entry logic: Uses a 10-bar breakout box with a 0.3% buffer, plus EMA-based trend + proximity filter.
Longs: price in breakout-high zone, above EMA50/EMA200 and within proximityPts.
Shorts: price in breakout-low zone and strong downtrend (EMA10 < EMA20 < EMA50 < EMA200, price below EMA200).
Trades only when ATR(14) > atrTradeThresh and during regular hours (till 15:15).
Risk / exits: Stop loss is ATR-adaptive – max of slBasePoints (100 pts) and ATR * atrSLFactor; TP is fixed (tpPoints, e.g. 350 pts).
Longs have stepped trailing profit levels (100/150/200/250/320 pts) that lock in gains on pullbacks.
Shorts have trailing loss-reduction levels (80/120/140 pts) to cut improving losses.
Additional exit: 1H EMA50 2-bar reversal against the position, plus optional EOD flatten at 3:15 PM.
Compounding engine: From a chosen start date, equity is rebased to startCapital, and lot size scales dynamically as equity / capitalPerLot, with automatic lot reductions at three drawdown thresholds (ddCut1 / 2 / 3).
Automation: All entries and exits are exposed via alertconditions (long/short entry & exit) so the strategy can be connected to broker/webhook automation.

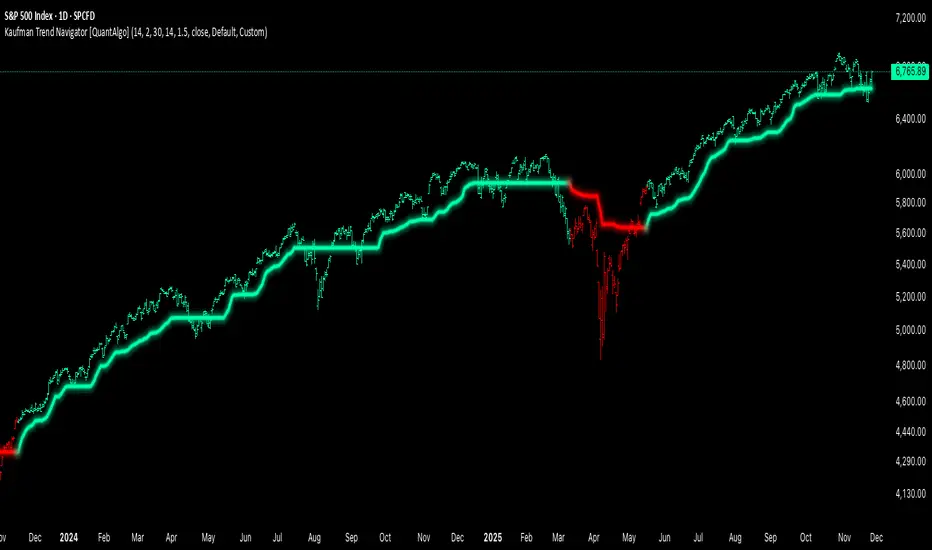
Kaufman Trend Navigator [QuantAlgo]🟢 Overview
The Kaufman Trend Navigator is an adaptive trend following system that combines efficiency-weighted price smoothing with volatility-adjusted bands to identify and track directional market movements. The indicator dynamically adjusts its sensitivity based on market conditions, becoming more responsive during trending periods and more conservative during consolidation. This dual-layer approach provides traders and investors with a systematic framework for trend identification, entry timing, and risk management across multiple timeframes and asset classes.
🟢 How It Works
The indicator employs an efficiency ratio mechanism that measures the directional movement of price relative to total price volatility over a defined lookback period. This ratio determines the adaptive response rate, allowing the system to distinguish between genuine directional moves and random market noise. When price exhibits strong directional characteristics, the internal smoothing accelerates to track the trend more closely. Conversely, during periods of low efficiency or choppy price action, the smoothing becomes more conservative to filter out false signals.
Volatility bands are constructed using normalized range measurements, creating dynamic upper and lower boundaries around the adaptive trend calculation. These bands expand and contract based on recent market volatility, providing context-dependent thresholds for trend validation. The trend line itself updates through a band-following logic where it tracks the relevant boundary based on the current directional bias, creating a stepping mechanism that maintains trend persistence while allowing for validated reversals.
The visual representation uses a gradient-weighted display to emphasize the primary trend line while maintaining clarity on price charts. Trend direction changes trigger when the internal logic confirms a boundary crossover, generating signals for potential position entries or exits. The system includes preset configurations calibrated for different trading timeframes, from responsive settings for scalping to smoother parameters suited for swing and position trading.
🟢 How to Use It
▶ Enter Long positions when the trend line transitions to Bullish (Green) coloring, which indicates upward directional bias has been established. Conversely, enter Short positions or exit Longs when the trend line shifts to Bearish (Red), which signals confirmed downward momentum.
The trend line itself can be used as dynamic support during uptrends and resistance during downtrends, providing logical areas for position management and stop placement. Price remaining above the line during bullish phases or below during bearish phases can also be used as a confirmation of trend strength and continuation probability.
▶ Built-in alert functionality provides real-time notifications for trend changes without requiring continuous chart monitoring. Configure alerts for Bullish Trend Signal to capture upward reversals, Bearish Trend Signal for downward shifts, or the general Trend Change alert to monitor both directions simultaneously. These alerts trigger only on confirmed trend transitions, reducing noise from intrabar fluctuations.
The indicator also includes six color presets (Classic, Aqua, Cosmic, Ember, Neon, Custom) to optimize visual clarity across different chart themes and lighting conditions. Select presets based on your monitor setup and background preference to ensure immediate trend recognition without visual strain. Bar coloring can be enabled to highlight trend direction directly on the price chart, eliminating the need to reference the trend line position during rapid market analysis.
🟢 Pro Tips for Trading and Investing
▶ Match the preset configuration (or your preferred settings) to your trading timeframe: use Fast Response for intraday charts (1-15 minutes), Default for swing trading (hourly to daily), and Smooth Trend for position trading (4-hour to weekly).
▶ Combine trend signals with volume analysis and market structure to filter lower-probability setups. During sideways markets, expect increased signal frequency with reduced reliability; consider waiting for the trend line to establish a clear slope before committing capital.
▶ Use the trend line as a trailing reference rather than a fixed stop level, allowing normal intrabar volatility while protecting against genuine reversals.
▶ For portfolio management, align position sizing with trend strength by observing the angle and consistency of the trend line progression.
BETA ZONES v1.0BETA ZONES v1.0 Indicator
Overview
BETA ZONES v1.0 is a comprehensive technical analysis tool designed for TradingView, combining an EMA-based ribbon with dynamic glow zones, structural pivot detection, and real-time ATR visualization. This overlay indicator helps traders identify trends, support/resistance zones, and potential breakout points by blending moving averages, volatility-based shading, and pivot structures. It's particularly useful for trend-following strategies, swing trading, and confirming market reversals on any timeframe or asset, including those using Heikin Ashi candles (as it incorporates real close data to bypass transformations).
The indicator emphasizes visual clarity with color-coded elements: bullish trends in shades of green/lime and bearish in red/maroon. It includes customizable toggles for each component, allowing users to focus on specific features without cluttering the chart.
Key Features
• EMA Ribbon & Glow System:
o Displays a ribbon formed by three EMAs (5, 20, and 50 periods) with gradient fills between them, colored based on trend strength.
o A dynamic "glow" zone around the 50-period EMA, calculated using ATR (Average True Range), acts as a volatility-based support (bullish) or resistance (bearish) band. The glow expands/contracts with market volatility, providing a visual buffer for potential price reactions.
o Real Close Dot: A small circle plotted at the actual closing price of each bar (sourced from standard candles), aiding in precise data verification even on transformed charts like Heikin Ashi.
• Structural Pivots:
o Automatically detects and labels confirmed pivot highs and lows using customizable symbols (e.g., arrows, dots, or curves).
o Draws breakout lines connecting pivots to the bar where structure is broken (Break of Structure - BOS), highlighting bullish (green) or bearish (red) shifts.
o Pivots are trend-aware: In uptrends, it tracks higher highs/lows until a downside break; in downtrends, lower highs/lows until an upside break.
• Real ATR Display:
o A compact table at the bottom-center of the chart showing the current 14-period ATR value (calculated on real data), useful for gauging volatility and setting stop-losses or targets.
How It Works
• EMA Ribbon Logic: The fast EMA (5) is compared to the mid (20), and mid to slow (50), to determine sub-trends. Price relative to the slow EMA sets the overall bullish/bearish bias. Fills create a "ribbon" effect, with colors intensifying in strong trends.
• Glow Zone: Uses a user-defined ATR length and multiplier to create upper/lower bands around the slow EMA. The glow is one-sided: below for bullish (support) and above for bearish (resistance), with semi-transparent shading for easy price overlay.
• Pivot Detection: Tracks the current trend direction (up or down) and reference high/low from the last confirmed pivot. A breakout (close crossing the reference level) confirms a new pivot, labels it, and optionally draws a line to the breakout bar. Bar coloring (yellow) highlights breakout candles.
• Data Handling: All calculations use real close prices via request.security to ensure accuracy on non-standard chart types.
Settings and Customization
The indicator is divided into intuitive input groups for easy configuration:
1. EMA Ribbon & Glow:
o Show EMA Ribbon & Glow: Master toggle to enable/disable the entire ribbon and glow (default: true). Note: Real Close Dot is independent.
o ATR Length (Glow): Lookback for ATR calculation (default: 3; higher = smoother glow).
o ATR Multiplier (Glow Size): Scales the glow width (default: 0.15; higher = wider zone).
o Show Real Close Dot: Toggle for the orange dot at real closes (default: true).
o Real Close Dot Color: Customize the dot's color (default: orange).
2. Structural Pivots:
o Show Pivot Labels: Toggle visibility of high/low symbols (default: true).
o Pivot Symbol Style: Choose from pairs like "︽ ︾" (low/high) or "•" (dots) (default: "•").
o Label Size: Adjust symbol size (Tiny to Huge; default: Normal).
o Pivot High/Low Label Colors: Set colors for labels (default: white).
o Show Breakout Lines: Toggle lines from pivot to breakout (default: true).
o Line Width: Thickness of breakout lines (default: 2).
o Line Style: Solid, Dashed, or Dotted (default: Solid).
o Resistance Break Line (Bullish): Color for upside breaks (default: green).
o Support Break Line (Bearish): Color for downside breaks (default: red).
No additional inputs are required for the ATR table, as it's always displayed on the last bar for quick reference.
Usage Tips
• Trend Identification: Use the EMA ribbon colors to gauge momentum—full green for strong bulls, red for bears. The glow zone can act as a dynamic entry/exit area (e.g., buy near bullish glow support).
• Breakout Trading: Watch for pivot labels and BOS lines as signals for trend reversals. Combine with volume or other indicators for confirmation.
• Volatility Awareness: The displayed ATR(14) helps in position sizing; for example, set stops at 1-2x ATR from entry.
• Chart Compatibility: Works best on candlestick or Heikin Ashi charts. For lower timeframes, reduce ATR length for faster reactivity; increase for higher timeframes.
• Limitations: Pivots are reactive and may lag in ranging markets. Glow is based on historical ATR, so it doesn't predict future volatility.
This indicator is in beta (v1.0) and open to feedback for improvements. Add it to your chart via TradingView's indicator search and experiment with settings to fit your strategy!

Mambo MA & HAMambo MA & HA is a combined trend-view indicator that overlays Heikin Ashi direction markers and up to eight customizable moving averages on any chart.
The goal is to give a clear, uncluttered visual summary of short-term and long-term trend direction using both regular chart data and Heikin Ashi structure.
This indicator displays:
Heikin Ashi (HA) directional markers on the chart timeframe
Optional Heikin Ashi markers from a second, higher timeframe
Up to eight different moving averages (SMA, EMA, SMMA/RMA, WMA, VWMA)
Adjustable colors and transparency for visual layering
Offset controls for HA markers to prevent overlap with price candles
It is designed for visual clarity without altering the underlying price candles.
Heikin Ashi Direction Markers (Chart Timeframe)
The indicator generates HA OHLC values internally and compares the HA open and close:
Green (bullish) HA candle → triangle-up marker plotted above the bar
Red (bearish) HA candle → triangle-down marker plotted above the bar
The triangles use soft pastel colors for minimal obstruction:
Up marker: light green (rgb 204, 232, 204)
Down marker: light red (rgb 255, 204, 204)
The “HA Offset (chart TF ticks)” input lets users shift the triangle vertically in price terms to avoid overlapping the real candles or MAs.
Heikin Ashi Markers from a Second Timeframe
An optional second timeframe (default: 60m) shows additional HA direction:
Green HA (higher timeframe) → tiny triangle-up below the bar
Red HA (higher timeframe) → tiny triangle-down below the bar
This allows a trader to see higher-timeframe HA structure without switching charts.
The offset for the second timeframe is independent (“HA Offset (extra TF ticks)”).
Custom Moving Averages (Up to Eight)
The indicator includes eight individually configurable MAs, each with:
On/off visibility toggle
MA type
SMA
EMA
SMMA / RMA
WMA
VWMA
Source
Length
Color (with preset 70% transparency for visual stacking)
The default MA lengths are: 10, 20, 50, 100, 150, 200, 250, 300.
All MA colors are slightly transparent by design to avoid obscuring price bars and HA markers.
Purpose of the Indicator
This tool provides a simple combined view of:
Immediate trend direction (chart-TF HA markers)
Higher-timeframe HA trend bias (extra-TF markers)
Overall moving-average structure from short to very long periods
It is particularly useful for:
Monitoring trend continuation vs. reversal
Confirming entries with multi-TF Heikin Ashi direction
Identifying pullbacks relative to layered moving averages
Viewing trend context without switching timeframes
There are no signals, alerts, or strategy components.
It is strictly a visual trend-context tool.
Key Features Summary
Two-timeframe Heikin Ashi direction
Separate offsets for HA markers
Eight fully configurable MAs
Clean color scheme with low opacity
Non-intrusive overlays
Compatible with all markets and chart types

Moving VWAP-KAMA CloudMoving VWAP-KAMA Cloud
Overview
The Moving VWAP-KAMA Cloud is a high-conviction trend filter designed to solve a major problem with standard indicators: Noise. By combining a smoothed Volume Weighted Average Price (MVWAP) with Kaufman’s Adaptive Moving Average (KAMA), this indicator creates a "Value Zone" that identifies the true structural trend while ignoring choppy price action.
Unlike brittle lines that break constantly, this cloud is "slow" by design—making it exceptionally powerful for spotting genuine trend reversals and filtering out fakeouts.
How It Works
This script uses a unique "Double Smoothing" architecture:
The Anchor (MVWAP): We take the standard VWAP and smooth it with a 30-period EMA. This represents the "Fair Value" baseline where volume has supported price over time.
The Filter (KAMA): We apply Kaufman's Adaptive Moving Average to the already smoothed MVWAP. KAMA is unique because it flattens out during low-volatility (choppy) periods and speeds up during high-momentum trends.
The Cloud:
Green/Teal Cloud: Bullish Structure (MVWAP > KAMA)
Purple Cloud: Bearish Structure (MVWAP < KAMA)
🔥 The "Reversal Slingshot" Strategy
Backtests reveal a powerful behavior during major trend changes, particularly after long bear markets:
The Resistance Phase: During a long-term downtrend, price will repeatedly rally into the Purple Cloud and get rejected. The flattened KAMA line acts as a "concrete ceiling," keeping the bearish trend intact.
The Breakout & Flip: When price finally breaks above the cloud with conviction, and the cloud flips Green, it signals a structural regime change.
The "Slingshot" Retest: Often, immediately after this flip, price will drop back into the top of the cloud. This is the "Slingshot" moment. The old resistance becomes new, hardened support.
The Rally: From this support bounce, stocks often launch into a sustained, multi-month bull run. This setup has been observed repeatedly at the bottom of major corrections.
How to Use This Indicator
1. Dynamic Support & Resistance
The KAMA Wall: When price retraces into the cloud, the KAMA line often flattens out, acting as a hard "floor" or "wall." A break of this wall usually signals a genuine trend change, not just a stop hunt.
2. Trend Confirmation (Regime Filter)
Bullish Regime: If price is holding above the cloud, only look for Long setups.
Bearish Regime: If price is holding below the cloud, only look for Short setups.
No-Trade Zone: If price is stuck inside the cloud, the market is traversing fair value. Stand aside until a clear winner emerges.
3. Multi-Timeframe Versatility
While designed for trend confirmation on higher timeframes (4H, Daily), this indicator adapts beautifully to lower timeframes (5m, 15m) for intraday scalping.
On Lower Timeframes: The cloud reacts much faster, acting as a dynamic "VWAP Band" that helps intraday traders stay on the right side of momentum during the session.
Settings
Moving VWAP Period (30): The lookback period for the base VWAP smoothing.
KAMA Settings (10, 10, 30): Controls the sensitivity of the adaptive filter.
Cloud Transparency: Adjust to keep your chart clean.
Alerts Included
Price Cross Over/Under MVWAP
Price Cross Over/Under KAMA
Cloud Flip (Bullish/Bearish Trend Change)
Tip for Traders
This is not a signal entry indicator. It is a Trend Conviction tool. Use it to filter your entries from faster indicators (like RSI or MACD). If your fast indicator signals "Buy" but the cloud is Purple, the probability is low. Wait for the Cloud Flip
