CFD Calculator For GFTC & INFINOX MT5Optimized CFD Trade Calculator + Pivot (Version 2) – For INFINOX MT5 & *GFTC
Risk Management & Entry Calculation:
Automatically computes the recommended entry lot size based on user inputs such as total capital and maximum loss percentage. For instance, a 0.4 lot position is sized to limit losses within 10% of a total capital of $1000 for a short position.
Pivot-Based Stoploss:
Dynamically updates stoploss levels using pivot high and low values. The indicator adjusts the pivot levels in real time as new extreme values are confirmed, ensuring that stoploss levels reflect current market conditions.
Real-Time Chart Display:
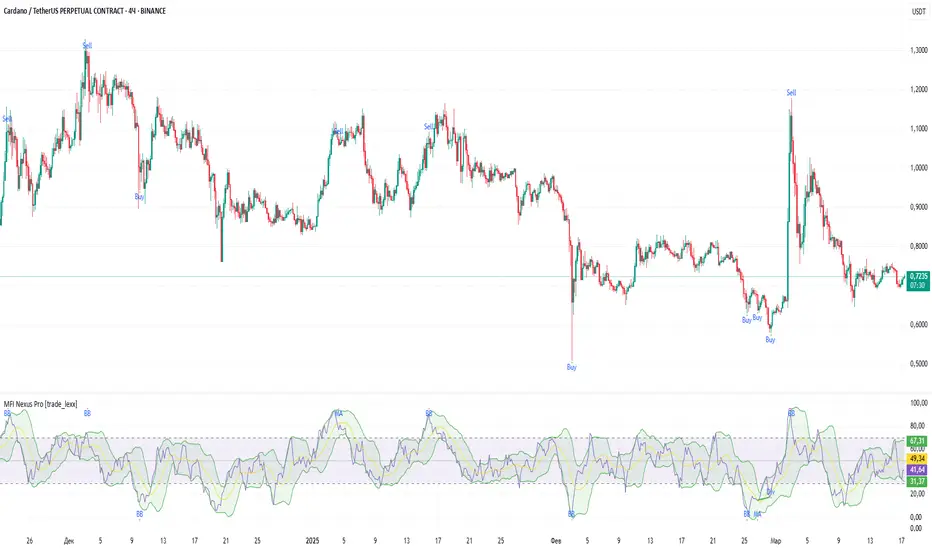
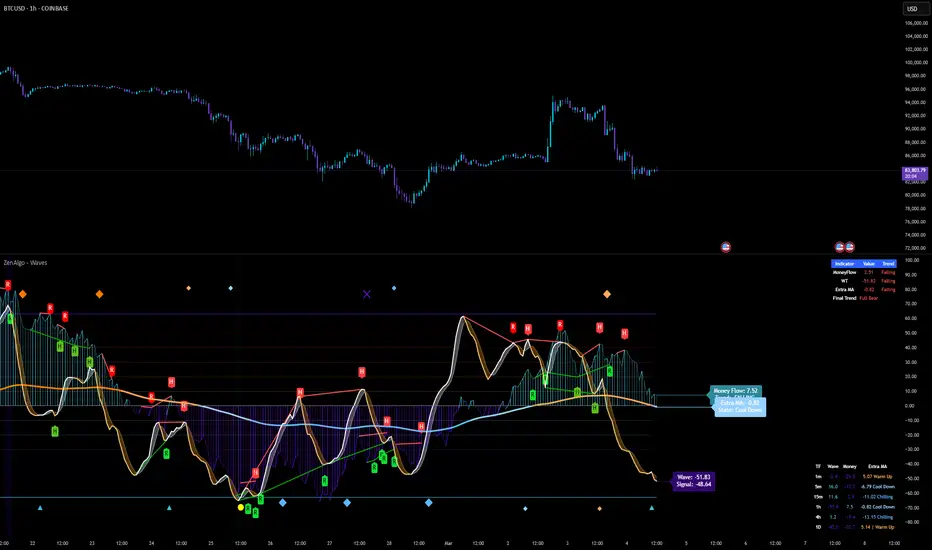
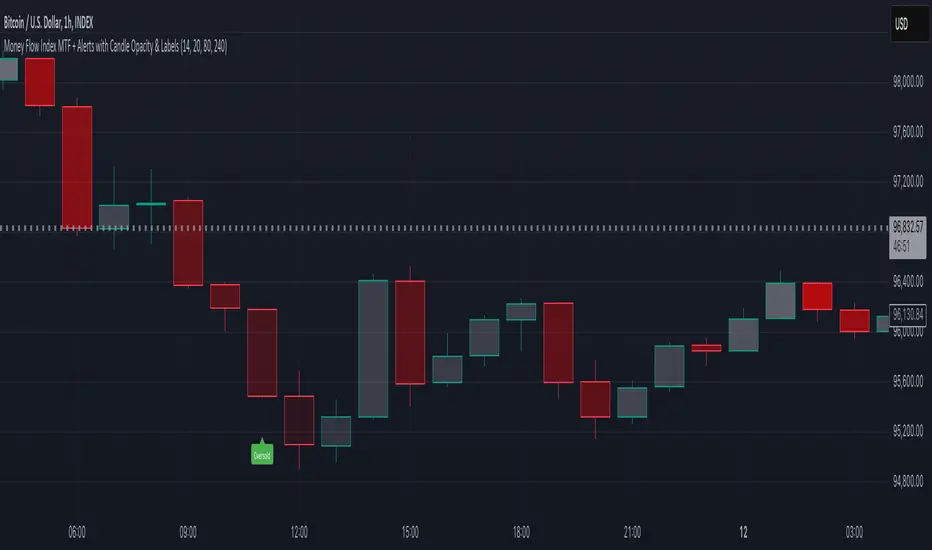
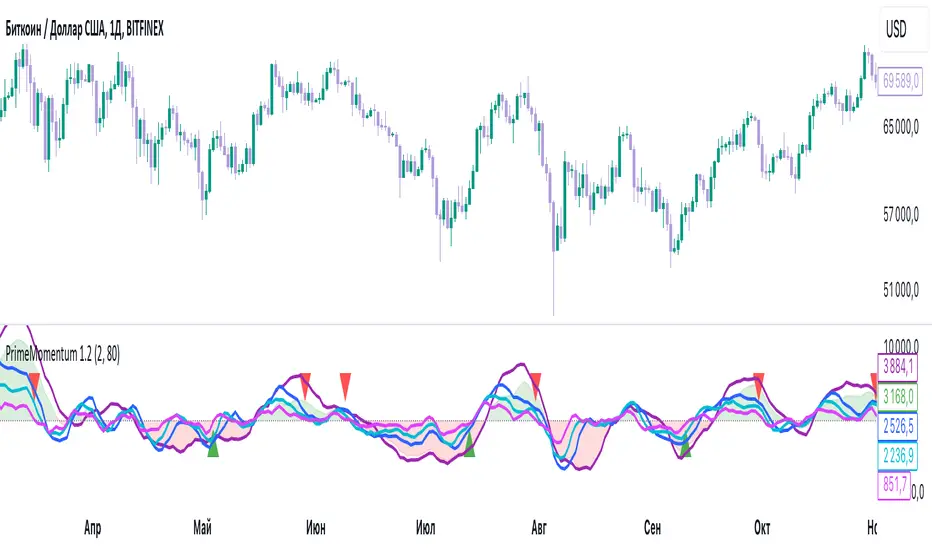
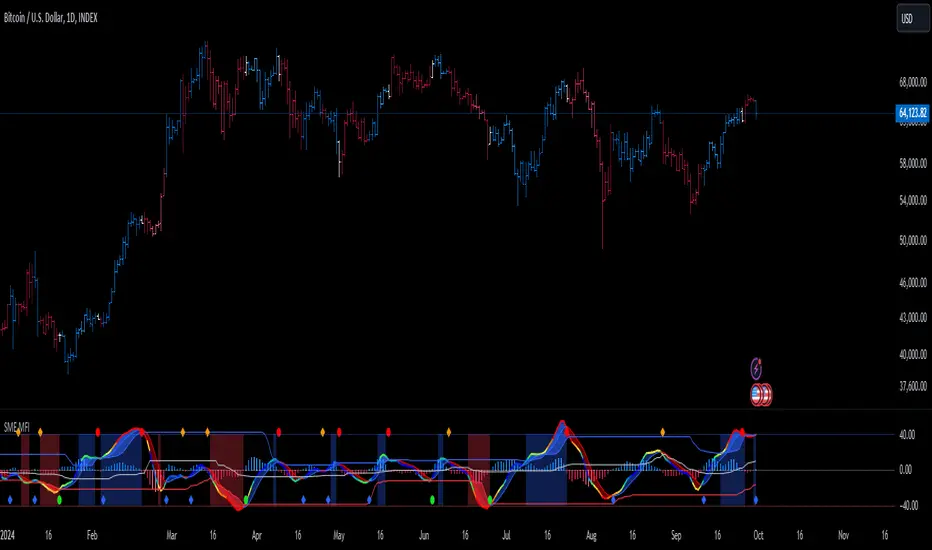
Key metrics are displayed through a customizable table, along with visual markers (triangles) that highlight breakouts. Shading is applied to indicate overbought/oversold conditions and divergence signals, with transparency and color settings fully configurable.
Additional Optional Features:
Users can selectively activate divergence, stochastic, and MFI signal alerts via the settings panel. These features are off by default to maintain a clean interface but can be enabled as needed.
User Interface Customization:
The indicator offers extensive customization for table headers, text, and background colors. This enables traders to tailor the display for optimal readability and integration with their charting style.
*GFTC : Global Financial Traders Council
Indikator Pine Script®