Renko ScalperWhat it is-
A lightweight Renko Scalper that combines Renko brick direction with an internal EMA trend filter and MACD confirmation to signal high-probability short-term entries. EMAs are used internally (hidden from the chart) so the visual remains uncluttered.
Signals-
Buy arrow: Renko direction turns bullish AND EMA trend up AND MACD histogram positive.
Sell arrow: Renko direction turns bearish AND EMA trend down AND MACD histogram negative.
Consecutive same-direction signals are suppressed (only one arrow per direction until opposite signal).
Visuals-
Buy / Sell arrows (large) above/below bars.
Chart background tints green/red after the respective signal for easy glance recognition.
Inputs:-
Renko Box Size (points)
EMA Fast / EMA Slow
MACD fast/slow/signal lengths
How to use-
Add to chart
Use smaller Renko box sizes for scalping, larger for swing-like entries.
Confirm signal with price action and volume—this indicator is a signal generator, not a full automated system.
Use alerts (built in) to receive Buy / Sell arrow notifications.
Alerts-
Buy Arrow — buySignal
Sell Arrow — sellSignal
Buy Background / Sell Background — background-color state alerts
Recommended settings-
Timeframes: 1m–15m for scalping, 5m for balanced intraday.
Symbols: liquid futures/currency pairs/major crypto.
Disclaimer
This script is educational and not financial advice. Backtest and forward test on a demo account before live use. Past performance is not indicative of future results. Use proper risk management.
Macdcross

Confirmed Pivots + MACD Signals (with BOS Lines)Confirmed Pivots + MACD Signals
This indicator combines confirmed swing highs/lows (pivots) with MACD-based momentum signals to highlight key reversal and continuation points on the chart.
Core Logic
Confirmed Pivots:
The script identifies swing highs and lows using the user-defined pivot confirmation length.
Once a structure is broken beyond the last pivot, that level becomes a confirmed support (CL) or resistance (CH) line.
These levels are plotted as dashed horizontal rays and labeled directly on the chart.
MACD Integration:
The classic MACD crossover/under logic is used:
Bullish Crossover: MACD line crosses above the Signal line.
Bearish Crossunder: MACD line crosses below the Signal line.
Signal Filtering by Proximity:
A Proximity Zone (%) defines how close price must be to an active support or resistance to trigger a signal.
Buy Signal: When price is within the support zone and a bullish MACD crossover occurs.
Sell Signal: When price is within the resistance zone and a bearish MACD crossunder occurs.
Inputs
Pivot Confirmation Length: Bars used to confirm swing points.
MACD Fast/Slow/Signal Lengths: Standard MACD settings.
Proximity Zone (%): Defines zone width (e.g., 1% around active level).
Output
Labels: "CH" (Confirmed High) and "CL" (Confirmed Low) with color-coded dashed lines.
Signals: "BUY" and "SELL" markers appear when both pivot and MACD conditions align.
Tips
Works best on higher timeframes (H1 and above).
Combine with price action or trend filters for confirmation.
Use proximity percentage according to volatility (e.g., smaller % for low-vol assets).
⚠️ Disclaimer:
This script is provided for educational and informational purposes only.
It does not constitute financial or investment advice, and the author is not responsible for any financial losses that may occur from its use.
Always perform your own analysis and use this indicator together with other technical and risk management tools before making trading decisions.
---------------------------------------------------------------------------------------------
سقف و کف تاییدشده + سیگنالهای MACD
این اندیکاتور ترکیبی از شناسایی سقفها و کفهای تاییدشده (Pivot High/Low) به همراه سیگنالهای مومنتوم MACD است که نقاط برگشت یا ادامهی روند را روی چارت مشخص میکند.
🔹 منطق عملکرد
تایید سقف و کفها:
ابتدا سقف و کفهای محلی بر اساس تعداد کندلهای تنظیمشده شناسایی میشوند.
وقتی ساختار قیمتی از آخرین سقف یا کف عبور کند، آن سطح به عنوان حمایت یا مقاومت تاییدشده در نظر گرفته شده و با برچسبهای “CL” (کف تاییدشده) و “CH” (سقف تاییدشده) و خطوط نقطهچین رسم میشود.
ادغام با MACD:
از منطق کلاسیک کراساور/کراسآندر MACD استفاده شده است:
کراس صعودی: عبور خط MACD از بالای خط سیگنال.
کراس نزولی: عبور خط MACD از زیر خط سیگنال.
فیلتر سیگنال با ناحیه مجاور:
با استفاده از درصد ناحیه مجاور (Proximity Zone %)، فقط زمانی سیگنال صادر میشود که قیمت نزدیک حمایت یا مقاومت فعال باشد.
سیگنال خرید: وقتی قیمت در ناحیهی حمایت و همزمان MACD صعودی شود.
سیگنال فروش: وقتی قیمت در ناحیهی مقاومت و همزمان MACD نزولی شود.
تنظیمات ورودی
طول تأیید پیوتها
تنظیمات MACD (Fast, Slow, Signal)
درصد ناحیه مجاور برای فعال شدن سیگنالها
خروجیها
برچسبهای “CL” و “CH” برای سطوح تاییدشده
نشانگرهای “BUY” و “SELL” در محل صدور سیگنال
نکات کاربردی
بهترین عملکرد در تایمفریمهای بالاتر (۱ ساعته به بالا)
برای دقت بیشتر، آن را با فیلتر روند یا پرایساکشن ترکیب کنید
درصد ناحیه مجاور را با توجه به نوسانات دارایی تنظیم کنید

EMA 12-26-100 Momentum Strategy# Triple EMA Multi-Signal Momentum Strategy
## 📊 Overview
**Triple EMA Multi-Signal** is a comprehensive trend-following momentum strategy designed specifically for cryptocurrency markets. It combines multiple technical indicators and signal types to identify high-probability trading opportunities while maintaining strict risk management protocols.
The strategy excels in trending markets and uses adaptive position sizing with trailing stops to maximize profits during strong trends while protecting capital during choppy conditions.
## 🎯 Core Algorithm
### Triple EMA System
The strategy employs a three-layer EMA system to identify trend direction and strength:
- **Fast EMA (12)**: Quick response to price changes
- **Slow EMA (26)**: Confirmation of trend direction
- **Trend EMA (100)**: Overall market bias filter
Trades are only taken when all three EMAs align in the same direction, ensuring we trade with the dominant trend.
### Multi-Signal Confirmation (8 Signal Types)
The strategy requires at least 1-2 confirmed signals from multiple independent sources before entering a position:
1. **EMA Crossover** - Fast EMA crossing Slow EMA (primary signal)
2. **MACD Cross** - MACD line crossing signal line (momentum confirmation)
3. **RSI Reversal** - RSI bouncing from oversold/overbought zones
4. **Price Action** - Strong bullish/bearish candles (>60% of range)
5. **Volume Spike** - Above-average volume confirmation
6. **Breakout** - Price breaking 20-period high/low with volume
7. **Pullback to EMA** - Trend continuation after healthy retracement
8. **Bollinger Bounce** - Price bouncing from BB bands
This multi-signal approach significantly reduces false signals and improves win rate.
## 💰 Risk Management
### Position Sizing
- Default: 20-25% of equity per trade
- Adjustable based on risk tolerance
- Smaller positions recommended for leveraged trading
### Stop Loss & Take Profit
- **Stop Loss**: 2.0% (tight control of risk)
- **Take Profit**: 5.5% (2.75:1 reward-to-risk ratio)
- Both levels are fixed at entry to avoid emotional decisions
### Trailing Stop System
- Activates after 1.8% profit
- Trails at 1.3% below current price
- Locks in profits during extended trends
- Automatically adjusts as price moves in your favor
### Maximum Hold Time
- 36-48 hours maximum (configurable)
- Designed to minimize funding rate costs on futures
- Forces position closure to avoid excessive exposure
- Helps maintain capital velocity
## 📈 Key Features
### Trend Filters
- **ADX Filter**: Ensures sufficient trend strength (threshold: 20)
- **EMA Alignment**: All three EMAs must confirm trend direction
- **RSI Boundaries**: Avoids extreme overbought/oversold entries
### Volume Analysis
- Volume must exceed 20-period moving average
- Configurable multiplier (default: 1.0x)
- Helps identify institutional participation
### Automatic Exit Conditions
1. Take Profit target reached
2. Stop Loss triggered
3. Trailing stop activated
4. Trend reversal (EMA cross in opposite direction)
5. Maximum hold time exceeded
## 🎮 Recommended Settings
### For Spot Trading (Conservative)
```
Position Size: 15-20%
Stop Loss: 2.5%
Take Profit: 6.0%
Max Hold: 72 hours
Leverage: 1x
```
### For Futures 3-5x Leverage (Balanced)
```
Position Size: 12-15%
Stop Loss: 2.0%
Take Profit: 5.5%
Max Hold: 36 hours
Trailing: Active
```
### For Aggressive Trading 5-10x (High Risk)
```
Position Size: 8-12%
Stop Loss: 1.5%
Take Profit: 4.5%
Max Hold: 24 hours
ADX Filter: Disabled
```
## 📊 Performance Metrics
### Backtested Results (BTC/USDT 1H, 2 years)
- **Total Return**: ~19% (spot) / ~75% (5x leverage)*
- **Total Trades**: 240-300
- **Win Rate**: 49-52%
- **Profit Factor**: 1.25-1.50
- **Max Drawdown**: ~18-22%
- **Average Trade**: 0.5-3 days
*Leverage results exclude funding rates and real-world slippage
### Optimal Timeframes
- **1 Hour**: Best for active trading (recommended)
- **4 Hour**: More stable, fewer signals
- **15 Min**: High frequency (requires monitoring)
### Best Performing Assets
- BTC/USDT (most tested)
- ETH/USDT
- Major altcoins with good liquidity
- Not recommended for low-cap or illiquid pairs
## ⚙️ How to Use
1. **Add to Chart**: Apply strategy to 1H BTC/USDT chart
2. **Adjust Settings**: Configure risk parameters based on your preference
3. **Review Signals**: Green = Long, Red = Short, labels show signal count
4. **Monitor Performance**: Check strategy tester for detailed statistics
5. **Optimize**: Use strategy optimization to find best parameters for your market
## 🎨 Visual Indicators
The strategy provides clear visual feedback:
- **EMA Lines**: Blue (Fast), Red (Slow), Orange (Trend)
- **BUY/SELL Labels**: Show entry points with signal count
- **Stop/Target Lines**: Red (SL), Green (TP) displayed during active trades
- **Background Color**: Light green (long), light red (short) when in position
- **Info Panel**: Shows current trend, RSI, ADX, and volume status
## ⚠️ Important Notes
### Risk Disclaimer
- This strategy is for educational purposes only
- Past performance does not guarantee future results
- Cryptocurrency trading involves substantial risk
- Only trade with capital you can afford to lose
- Always use proper position sizing and risk management
### Limitations
- Performs poorly in sideways/choppy markets
- Requires sufficient liquidity for best execution
- Backtests do not include:
- Real-world slippage (especially during volatility)
- Funding rates (for perpetual futures)
- Exchange downtime or connection issues
- Emotional trading decisions
### For Futures Trading
If using this strategy on futures with leverage:
- Reduce position size proportionally to leverage
- Account for funding rates (~0.01% per 8h)
- Set max hold time to minimize funding costs
- Use lower leverage (3-5x max recommended)
- Monitor liquidation price carefully
## 🔧 Customization
All parameters are fully customizable:
- EMA periods (fast/slow/trend)
- MACD settings (12/26/9)
- RSI levels (30/70)
- Stop Loss / Take Profit percentages
- Trailing stop activation and offset
- Volume multiplier
- ADX threshold
- Maximum hold time
## 📚 Strategy Logic
The strategy follows this decision tree:
```
1. Check Trend Direction (EMA alignment)
↓
2. Scan for Entry Signals (8 types)
↓
3. Confirm with Filters (ADX, Volume, RSI)
↓
4. Enter Position with Fixed SL/TP
↓
5. Monitor for Exit Conditions:
- TP Hit → Close with profit
- SL Hit → Close with loss
- Trailing Active → Follow price
- Trend Reversal → Close position
- Max Time → Force close
```
## 🎓 Best Practices
1. **Start Conservative**: Use smaller position sizes initially
2. **Track Performance**: Monitor actual vs backtested results
3. **Optimize Regularly**: Market conditions change, adapt parameters
4. **Combine with Analysis**: Don't rely solely on automated signals
5. **Manage Emotions**: Stick to the system, avoid manual overrides
6. **Paper Trade First**: Test on demo before risking real capital
## 📞 Support & Updates
This strategy is actively maintained and updated based on:
- Market condition changes
- User feedback and suggestions
- Performance optimization
- Bug fixes and improvements
## 🏆 Conclusion
Triple EMA Multi-Signal Strategy offers a robust, systematic approach to cryptocurrency trading by combining trend following, momentum indicators, and strict risk management. Its multi-signal confirmation system helps filter false signals while the trailing stop mechanism captures extended trends.
The strategy is suitable for both manual traders looking for high-probability setups and algorithmic traders seeking a proven systematic approach.
**Remember**: No strategy wins 100% of the time. Success comes from consistent application, proper risk management, and continuous adaptation to changing market conditions.
---
*Version: 1.0*
*Last Updated: November 2025*
*Tested on: BTC/USDT, ETH/USDT (1H, 4H timeframes)*
*Recommended Capital: $5,000+ for optimal position sizing*

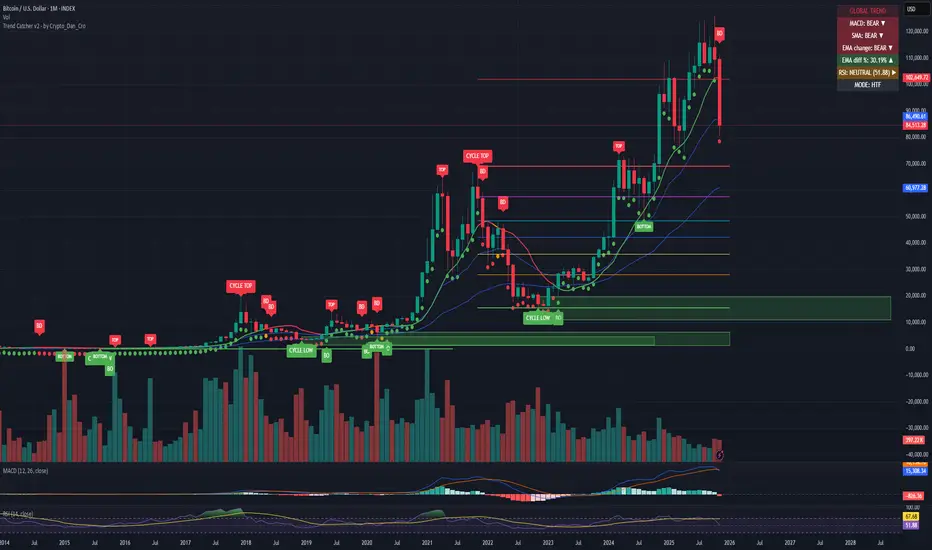
Trend Catcher - Alpha v2 - by Crypto_Dan_CroIf you want to get this indicator, contact me on
X handle: @crypto_dan_cro
What is Trend Catcher v2?
This is the only indicator you need ;)
This indicator is a proprietary market analysis system designed to identify high-probability trading zones by synchronizing multiple layers of market structure, momentum behaviour and cyclical dynamics.
It dynamically adapts to changing market conditions by evaluating:
- macro trend alignment
- structural price positioning
- momentum acceleration & deceleration
- volatility-based reaction zones
- cycle maturity levels
The system filters out low-quality setups and highlights only areas where multiple hidden conditions align, providing:
- trend continuation signals
- structural shift detection
- cycle-based expansion targets
- adaptive support & resistance mapping
Rather than reacting to price alone, the indicator anticipates areas where market psychology historically shifts, allowing traders to position themselves ahead of major moves.
Core philosophy:
This tool does not attempt to predict the market — it tracks the underlying pressure points where probability favours expansion or exhaustion.
It functions as:
- a trend alignment engine
- a cycle decoder
- a volatility interpreter
- a structure validation system
What it gives the user:
- Clear visual guidance without overloading the chart
- Objective market context independent of emotion
- Early trend recognition
- Cycle-aware price targeting
- Decision zones instead of random entries
Ideal for:
- traders who trade structure, not noise
- investors who respect market cycles
- strategists focused on probability over prediction
- disciplined entries & exits
In short:
It is a market interpretation framework built for traders who think two steps ahead.
Contains:
1. Higher Timeframe mode (Monthly / Weekly) on all timeframes
2. Current Chart Timeframe mode
3. Global Trend via BTC MACD
4. SMA
5. EMA
6. BO (Break Out), BD (Break Down) signals
7. TOP & BOTTOM Detection
8. Support & Resistance Zones
9. RSI confirmation
10. Smart Info Panel (Global trend, MACD, SMA, EMA, RSI statuses - Bull, Bear, Neutral)
11. Monthly timeframe (Fibbonaci Retracement levels)
12. Monthly timeframe (all Cycle tops, and Cycle bottoms)
Crypto markets are volatile, if you choose to use this indicator for trading, you are doing it on your own. Crypto_dan_cro is not responsible for any profits or losses created by using this Indicator.
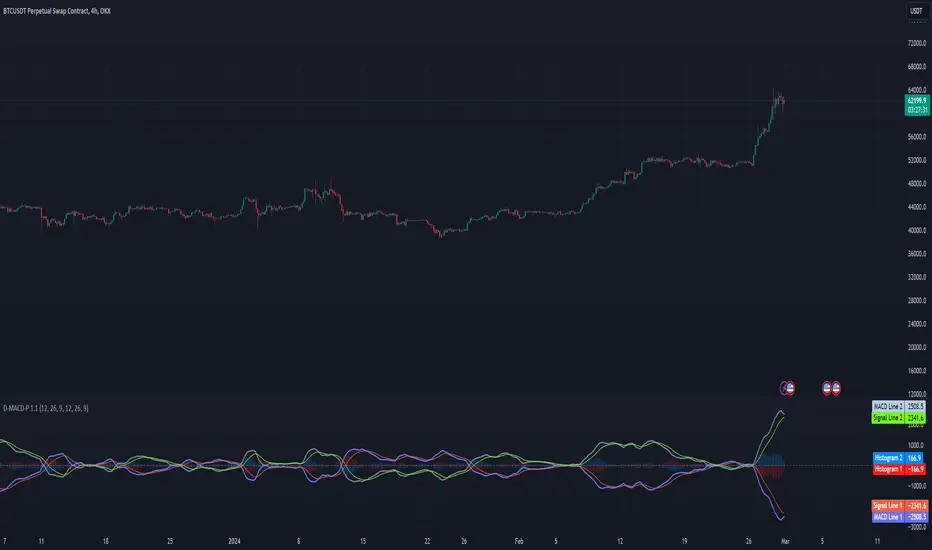
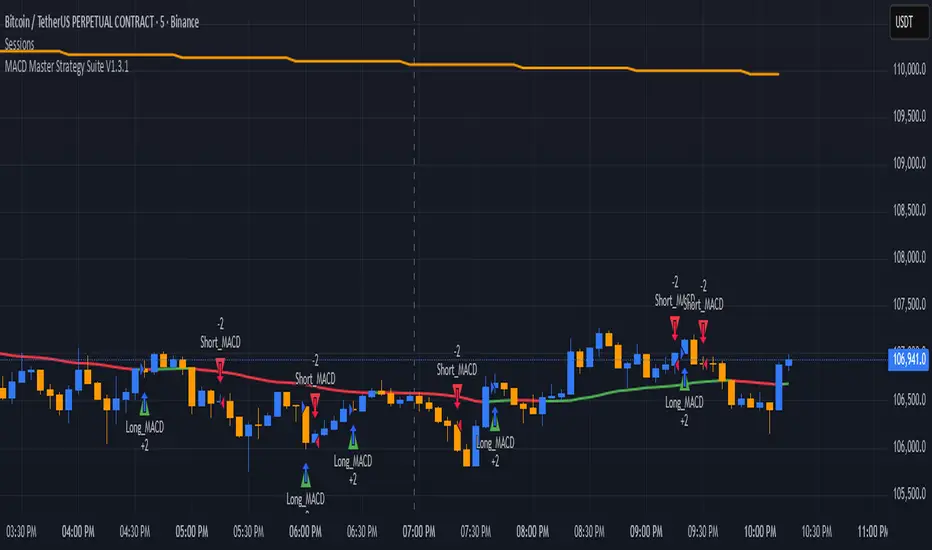
MACD Master Strategy Suite🧩 Overview
The MACD Master Strategy Suite is not a basic MACD crossover system, but a complete backtesting tool designed for traders who want to explore and optimize MACD-based logic.
This suite offers a host of configurable options that transform the standard MACD into a powerful research framework. You can test multiple entry styles, apply trend filters, run contrarian setups, and study seasonality — all from one script.
⚙️ Key Features
Multiple MACD entry modes: classic cross, zero-line flip, pullback, momentum burst, divergence, and more.
Dual-EMA trend filter with optional Contrarian Mode.
Higher-timeframe trend confirmation.
Calendar filters for weekday, month, and day-of-month testing.
Realistic trade management: stop/target exits, cooldowns, and same-bar recalculation guard.
Adjustable position sizing and leverage for accurate SPY-style backtests.
🧠 How It Differs From TradingView’s Built-In MACD Strategy
The built-in MACD strategy uses only histogram zero-cross entries with no filters or risk controls.
The MACD Master Strategy Suite expands this into a fully modular testing environment, allowing you to analyze how different MACD behaviors perform under diverse market conditions — turning MACD from a simple signal into a measurable system.
⚖️ Disclaimer
For research and educational use only. This script does not constitute financial advice or guarantee performance.
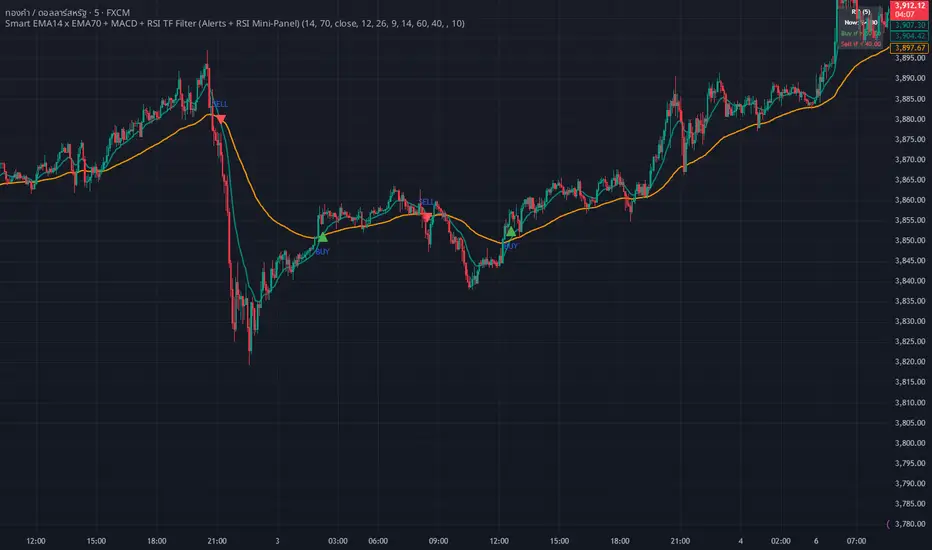
whang master trend🔥 Smart EMA + MACD + RSI Trend Filter
Catch real trends — avoid false signals!
Looking for clean and reliable trade alerts?
This script combines the power of EMA crossover, MACD momentum, and RSI trend strength — all in one simple tool.
📈 Buy Signal: EMA14 crosses above EMA70, MACD > 0, and RSI > 60
📉 Sell Signal: EMA14 crosses below EMA70, MACD < 0, and RSI < 40
✅ Both EMAs must slope in the same direction — no more sideways traps!
💡 Why traders love it:
Easy setup — plug & play
Directional EMA filter removes noise
Custom RSI timeframe filter for higher accuracy
Real-time alerts via Any alert() function call
Built-in RSI mini panel for quick reference
Perfect for traders who want to ride the trend, stay out of choppy markets,
and receive clear alerts at the right time.
✨ Add it to your chart today — let smart filters guide your trades 🚀
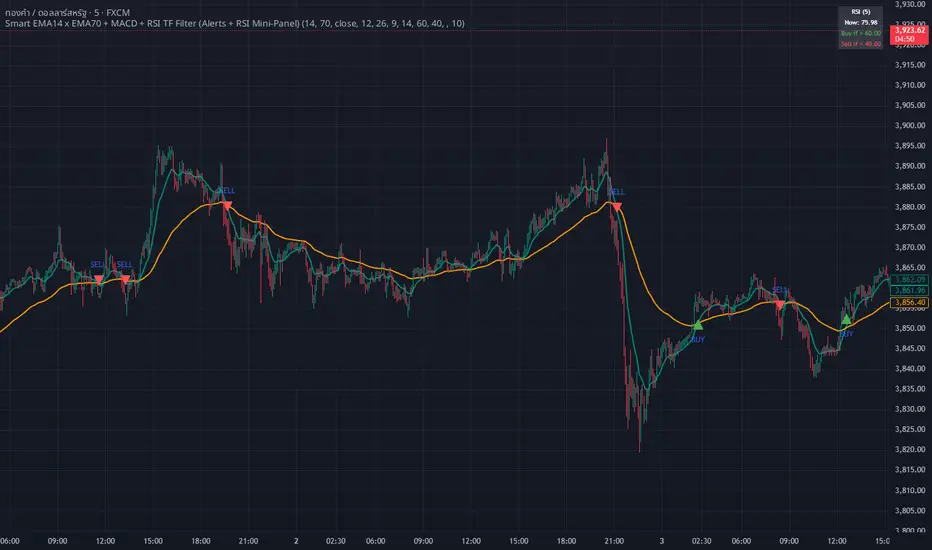
WHANG EMA-MACD🔥 Smart EMA14 x EMA70 + MACD Trend Alert System
Description:
Tired of chasing false signals?
This simple but powerful indicator helps you catch real trend moves — not the noise.
When EMA14 crosses EMA70 with MACD confirmation, and both EMAs point the same way, you’ll get a clean Buy or Sell alert right on your chart.
No messy settings, no guessing — just clear signals in strong trends.
✨ Features:
🔔 Real-time alerts via “Any alert() function call”
🟢 Buy when EMA14 crosses above EMA70 + MACD > 0
🔴 Sell when EMA14 crosses below EMA70 + MACD < 0
📈 Trades only when both EMAs slope in the same direction
⚙️ Customizable inputs for any market or timeframe
How to use:
Add the indicator to your chart
Create an alert → choose Any alert() function call
Relax and wait for your signals — no need to watch every candle!
Perfect for traders who want to follow the trend, avoid sideways traps, and get early alerts when momentum kicks in 🚀
3X Sniper BotThe 3X Sniper Bot is built for traders who demand clarity, precision, and confidence in their decision-making. This tool isn’t just another crossover script—it’s a full multi-confirmation system that helps you spot momentum shifts, identify high-probability entries, and filter out the noise.
🔥 Why traders love it:
Triple confirmation engine: Only fires when multiple conditions align, reducing false signals.
Strong vs. Regular vs. Possible setups: Get nuanced alerts that distinguish between high-conviction moves and early opportunities.
Both Buy & Sell coverage: Stay prepared in any market environment.
Smart flexibility: Works across strict or sequenced signal modes, giving you control over how conservative or aggressive you want to trade.
Visual clarity: Clean chart markers and optional regime shading keep your screen easy to read at a glance.
Alert-ready: Set and forget—never miss a move with real-time TradingView alerts.
This indicator was designed to make complex multi-factor analysis simple, giving traders a clear visual edge without clutter or guesswork. Whether you scalp intraday or swing multi-day, the 3X Sniper Bot adapts to your style.


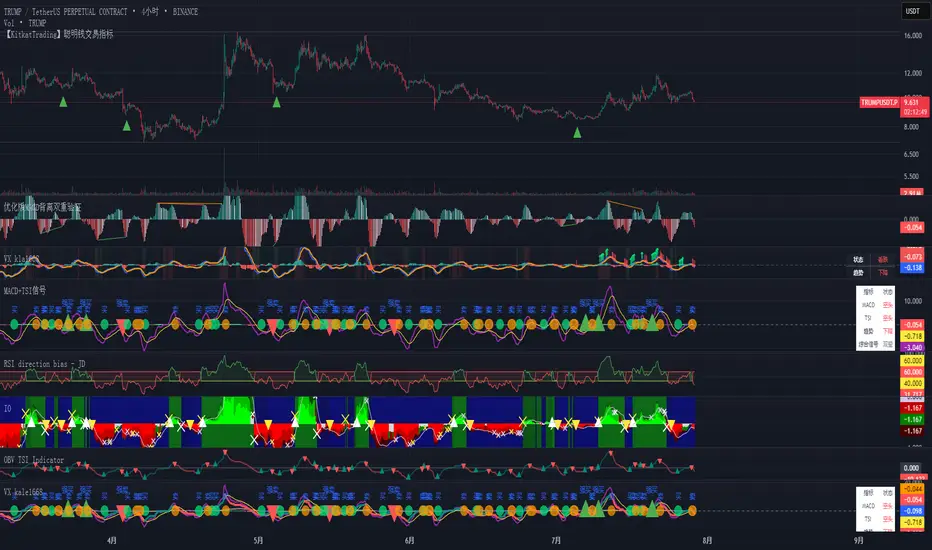
MACD + TSI 交易信号指标 by kuaileya MACD kuaileya VX kale1668 title="🚀 强势买入信号", message="🚀 {{ticker}} 强势买入信号!价格:{{close}} | MACD和TSI同时确认多头趋势")
alertcondition(strongSell and showAlerts, title="💥 强势卖出信号", message="💥 {{ticker}} 强势卖出信号!价格:{{close}} | MACD和TSI同时确认空头趋势")
alertcondition(normalBuy and showAlerts, title="📈 买入信号", message="
Ashpi CVD + MACD AlertMACD Crossing + CVD Support
Red arrows signal short entries above the MACD zero line.
Green arrows signal long entries below the zero line.
Blue arrows indicate a re-entry into an existing long trend (crossing above the zero line), typically on pull-backs.
Yellow arrows indicate a re-entry into an existing short trend (crossing below the zero line).
Time-Frame Setup
- Entry on the 15-second chart
- Confirmation on the 30-second chart
- Trade management on the 1-minute chart (or higher)
Always follow the primary trend: RED = Short, GREEN = Long.
Sequence
1. RED signal appears → enter short
2. During the trade, if a GREEN arrow appears on the pull-back → exit trade, or add to position on a YELLOW arrow if the trend continues
The same applies to long trades and BLUE arrows.
Using EMAs (20, 50, 200) can help you spot structural breaks more clearly.
Signal Strength (Delta Distance to Zero Line)
The strength of each signal is enhanced by displaying the distance (delta) to the zero line in the chart:
- Green numbers mean the delta is already above its 10-period moving average (MA10).
- Red numbers mean the delta is below its MA10.
Identifying Sideways Markets
Use a standard MACD as an additional filter to spot ranging phases.
If YELLOW and BLUE arrows occur frequently in succession, it indicates the two MACD lines are moving very close together—trading such conditions should generally be avoided.

MACD Full [Titans_Invest]MACD Full — A Smarter, More Flexible MACD.
Looking for a MACD with real customization power?
We present one of the most complete public MACD indicators available on TradingView.
It maintains the classic MACD structure but is enhanced with 20 fully customizable long entry conditions and 20 short entry conditions , giving you precise control over your strategy.
Plus, it’s fully automation-ready, making it ideal for quantitative systems and algorithmic trading.
Whether you're a discretionary trader or a bot developer, this tool is built to seamlessly adapt to your style.
⯁ WHAT IS THE MACD❓
The Moving Average Convergence Divergence (MACD) is a technical analysis indicator developed by Gerald Appel. It measures the relationship between two moving averages of a security’s price to identify changes in momentum, direction, and strength of a trend. The MACD is composed of three components: the MACD line, the signal line, and the histogram.
⯁ HOW TO USE THE MACD❓
The MACD is calculated by subtracting the 26-period Exponential Moving Average (EMA) from the 12-period EMA. A 9-period EMA of the MACD line, called the signal line, is then plotted on top of the MACD line. The MACD histogram represents the difference between the MACD line and the signal line.
Here are the primary signals generated by the MACD:
Bullish Crossover: When the MACD line crosses above the signal line, indicating a potential buy signal.
Bearish Crossover: When the MACD line crosses below the signal line, indicating a potential sell signal.
Divergence: When the price of the security diverges from the MACD, suggesting a potential reversal.
Overbought/Oversold Conditions: Indicated by the MACD line moving far away from the signal line, though this is less common than in oscillators like the RSI.
⯁ ENTRY CONDITIONS
The conditions below are fully flexible and allow for complete customization of the signal.
______________________________________________________
🔹 CONDITIONS TO BUY 📈
______________________________________________________
• Signal Validity: The signal will remain valid for X bars .
• Signal Sequence: Configurable as AND or OR .
🔹 MACD > Signal Smoothing
🔹 MACD < Signal Smoothing
🔹 Histogram > 0
🔹 Histogram < 0
🔹 Histogram Positive
🔹 Histogram Negative
🔹 MACD > 0
🔹 MACD < 0
🔹 Signal > 0
🔹 Signal < 0
🔹 MACD > Histogram
🔹 MACD < Histogram
🔹 Signal > Histogram
🔹 Signal < Histogram
🔹 MACD (Crossover) Signal
🔹 MACD (Crossunder) Signal
🔹 MACD (Crossover) 0
🔹 MACD (Crossunder) 0
🔹 Signal (Crossover) 0
🔹 Signal (Crossunder) 0
______________________________________________________
______________________________________________________
🔸 CONDITIONS TO SELL 📉
______________________________________________________
• Signal Validity: The signal will remain valid for X bars .
• Signal Sequence: Configurable as AND or OR .
🔸 MACD > Signal Smoothing
🔸 MACD < Signal Smoothing
🔸 Histogram > 0
🔸 Histogram < 0
🔸 Histogram Positive
🔸 Histogram Negative
🔸 MACD > 0
🔸 MACD < 0
🔸 Signal > 0
🔸 Signal < 0
🔸 MACD > Histogram
🔸 MACD < Histogram
🔸 Signal > Histogram
🔸 Signal < Histogram
🔸 MACD (Crossover) Signal
🔸 MACD (Crossunder) Signal
🔸 MACD (Crossover) 0
🔸 MACD (Crossunder) 0
🔸 Signal (Crossover) 0
🔸 Signal (Crossunder) 0
______________________________________________________
______________________________________________________
🤖 AUTOMATION 🤖
• You can automate the BUY and SELL signals of this indicator.
______________________________________________________
______________________________________________________
⯁ UNIQUE FEATURES
______________________________________________________
Signal Validity: The signal will remain valid for X bars
Signal Sequence: Configurable as AND/OR
Condition Table: BUY/SELL
Condition Labels: BUY/SELL
Plot Labels in the Graph Above: BUY/SELL
Automate and Monitor Signals/Alerts: BUY/SELL
Signal Validity: The signal will remain valid for X bars
Signal Sequence: Configurable as AND/OR
Table of Conditions: BUY/SELL
Conditions Label: BUY/SELL
Plot Labels in the graph above: BUY/SELL
Automate & Monitor Signals/Alerts: BUY/SELL
______________________________________________________
📜 SCRIPT : MACD Full
🎴 Art by : @Titans_Invest & @DiFlip
👨💻 Dev by : @Titans_Invest & @DiFlip
🎑 Titans Invest — The Wizards Without Gloves 🧤
✨ Enjoy!
______________________________________________________
o Mission 🗺
• Inspire Traders to manifest Magic in the Market.
o Vision 𐓏
• To elevate collective Energy 𐓷𐓏

MestreDoFOMO MACD VisualMasterDoFOMO MACD Visual
Description
MasterDoFOMO MACD Visual is a custom indicator that combines a unique approach to MACD with stochastic logic and simulated Renko-based direction signals. It is designed to help traders identify entry and exit opportunities based on market momentum and trend changes, with a clear and intuitive visualization.
How It Works
Stylized MACD with Stochastic: The indicator calculates the MACD using EMAs (exponential moving averages) normalized by stochastic logic. This is done by subtracting the lowest price (lowest low) from a defined period and dividing by the range between the highest and lowest price (highest high - lowest low). The result is a MACD that is more sensitive to market conditions, magnified by a factor of 10 for better visualization.
Signal Line: An EMA of the MACD is plotted as a signal line, allowing you to identify crossovers that indicate potential trend reversals or continuations.
Histogram: The difference between the MACD and the signal line is displayed as a histogram, with distinct colors (fuchsia for positive, purple for negative) to make momentum easier to read.
Simulated Renko Direction: Uses ATR (Average True Range) to calculate the size of Renko "bricks", generating signals of change in direction (bullish or bearish). These signals are displayed as arrows on the chart, helping to identify trend reversals.
Purpose
The indicator combines the sensitivity of the Stochastic MACD with the robustness of Renko signals to provide a versatile tool. It is ideal for traders looking to capture momentum-based market movements (using the MACD and histogram) while confirming trend changes with Renko signals. This combination reduces false signals and improves accuracy in volatile markets.
Settings
Stochastic Period (45): Sets the period for calculating the Stochastic range (highest high - lowest low).
Fast EMA Period (12): Period of the fast EMA used in the MACD.
Slow EMA Period (26): Period of the slow EMA used in the MACD.
Signal Line Period (9): Period of the EMA of the signal line.
Overbought/Oversold Levels (1.0/-1.0): Thresholds for identifying extreme conditions in the MACD.
ATR Period (14): Period for calculating the Renko brick size.
ATR Multiplier (1.0): Adjusts the Renko brick size.
Show Histogram: Enables/disables the histogram.
Show Renko Markers: Enables/disables the Renko direction arrows.
How to Use
MACD Crossovers: A MACD crossover above the signal line indicates potential bullishness, while below suggests bearishness.
Histogram: Fuchsia bars indicate bullish momentum; purple bars indicate bearish momentum.
Renko Arrows: Green arrows (upward triangle) signal a change to an uptrend; red arrows (downward triangle) signal a downtrend.
Overbought/Oversold Levels: Use the levels to identify potential reversals when the MACD reaches extreme values.
Notes
The chart should be set up with this indicator in isolation for better clarity.
Adjust the periods and ATR multiplier according to the asset and timeframe used.
Use the built-in alerts ("Renko Up Signal" and "Renko Down Signal") to set up notifications of direction changes.
This indicator is ideal for day traders and swing traders who want a visually clear and functional tool for trading based on momentum and trends.

MACD Volume Strategy (BBO + MACD State, Reversal Type)Overview
MACD Volume Strategy (BBO + MACD State, Reversal Type) is a momentum-based reversal system that combines MACD crossover logic with volume filtering to enhance signal accuracy and minimize noise. It aims to identify structural trend shifts and manage risk using predefined parameters.
※This strategy is for educational and research purposes only. All results are based on historical simulations and do not guarantee future performance.
Strategy Objectives
Identify early trend transitions with high probability
Filter entries using volume dynamics to validate momentum
Maintain continuous exposure using a reversal-style model
Apply a consistent 1:1.5 risk-to-reward ratio per trade
Key Features
Integrated MACD and volume oscillator filtering
Zero repainting (all signals confirmed on closed candles)
Automatic position flipping for seamless direction shifts
Stop-loss and take-profit based on recent structural highs/lows
Trading Rules
Long Entry Conditions
MACD crosses above the zero line (BBO Buy arrow)
Volume oscillator is positive (short EMA > long EMA)
MACD is above the signal line
Close any existing short and enter a new long
Short Entry Conditions
MACD crosses below the zero line (BBO Sell arrow)
Volume oscillator is positive
MACD is below the signal line
Close any existing long and enter a new short
Exit Rules
Take Profit (TP) = Entry ± (risk distance × 1.5)
Stop Loss (SL) = Recent swing low (for long) or high (for short)
Early Exit = Triggered when a reversal signal appears (flip logic)
Risk Management Parameters
Pair: ETH/USD
Timeframe: 10-minute
Starting Capital: $3,000
Commission: 0.02%
Slippage: 2 pip
Risk per Trade: 5% of account equity (adjusted for sustainable practice)
Total Trades: 312 (backtest on selected dataset)
※Risk parameters are fully configurable and should be adjusted to suit each trader's personal setup and broker conditions.
Parameters & Configurations
Volume Short Length: 6
Volume Long Length: 12
MACD Fast Length: 11
MACD Slow Length: 21
Signal Smoothing: 10
Oscillator MA Type: SMA
Signal Line MA Type: SMA
Visual Support
Green arrow = Long entry
Red arrow = Short entry
MACD lines, signal line, and histogram
SL/TP markers plotted directly on the chart
Strategic Advantages & Uniqueness
Volume filtering eliminates low-participation, weak signals
Structurally aligned SL/TP based on recent market pivots
No repainting — decisions are made only on closed candles
Always in the market due to the reversal-style framework
Inspirations & Attribution
This strategy is inspired by the excellent work of:
Bitcoinblockchainonline – “BBO_Roxana_Signals MACD + vol”
Leveraging MACD zero-line cross and volume oscillator for intuitive signal generation.
HasanRifat – “MACD Fake Filter ”
Introduced a signal filter using MACD wave height averaging to reduce false positives.
This strategy builds upon those ideas to create a more automated, risk-aware, and technically adaptive system.
Summary
MACD Volume Strategy is a clean, logic-first automated trading system built for precision-seeking traders. It avoids discretionary bias and provides consistent signal logic under backtested historical conditions.
100% mechanical — no discretionary input required
Designed for high-confidence entries
Can be extended with filters, alerts, or trailing stops
※Strategy performance depends on market context. Past performance is not indicative of future results. Use with proper risk management and careful configuration.

Smart MACD Reversal Oscillator Pro [TradeDots]The TradeDots Smart MACD Reversal Oscillator Pro is an advanced technical analysis tool that combines traditional MACD functionality with multi-layered signal detection and divergence identification systems. This comprehensive oscillator helps traders identify potential market reversals, trend continuations, and extremes with greater precision than conventional indicators.
📝 HOW IT WORKS
Accumulation & Distribution Detection System
The indicator begins with a proprietary calculation that identifies potential accumulation and distribution phases:
Calculation: Processes EMA differentials with specific time constants to detect underlying accumulation/distribution pressure
Visualization: Green-filled areas indicate accumulation phases (bullish pressure building) while red-filled areas show distribution phases (bearish pressure building)
Significance: This system often identifies trend reversals before traditional indicators by detecting institutional buying/selling activity
Multi-Timeframe MACD Implementation
Unlike traditional MACD indicators that use a single timeframe, this oscillator incorporates multiple calculation methods:
1. Primary Oscillator: Uses a proprietary calculation that combines price extremes with smoothed averages:
Implements specialized moving average types (SMMA and ZLEMA)
Generates a histogram that changes color based on price position relative to these averages
Produces a signal line that identifies crossover opportunities
2. Secondary MACD: Traditional MACD implementation with customizable parameters:
User-selectable MA types (SMA/EMA) for both oscillator and signal line
Color-coded histogram for momentum visualization
Separate crossover detection system
Dynamic Band System
The indicator implements an innovative dynamic band system to identify overbought and oversold conditions:
Band Calculation: Analyzes historical oscillator values to establish statistically significant extremes
Adaptive Scaling: Automatically adjusts to different market volatility regimes using a customizable Y-axis scale factor
Signal Integration: Incorporates band levels into signal generation for higher-probability trades
Signal Generation System
Four distinct signal types are generated to identify potential trading opportunities:
Green Dots: Bullish crossover signals (primary oscillator crosses above signal line)
Red Dots: Bearish crossover signals (primary oscillator crosses below signal line)
Blue Dots: Secondary MACD bullish crossovers in oversold territory
Orange Dots: Secondary MACD bearish crossovers in overbought territory
Advanced Divergence Detection
The oscillator incorporates a sophisticated divergence detection system:
Regular Divergences: Identifies when price makes lower lows while the oscillator makes higher lows (bullish) or price makes higher highs while the oscillator makes lower highs (bearish)
Hidden Divergences: Optional detection of continuation patterns (currently disabled by default)
Visual Markers: Clear labels identifying divergence formations directly on the chart
Zero-Line Filter: Optional filtering to only detect divergences that don't cross the zero line
🛠️ HOW TO USE
Signal Interpretation
Momentum Direction
Histogram Color: Green shades indicate bullish momentum, red shades indicate bearish momentum
Oscillator Position: Above zero indicates bullish momentum, below zero indicates bearish momentum
Filled Background: Green fill shows accumulation phases, red fill shows distribution phases
Buy Signals (In Order of Strength)
Bullish Divergence + Green Dot: Highest probability reversal signal (price making lower lows while oscillator makes higher lows, followed by crossover)
Green Dot Below Short Average Line: Strong oversold reversal signal
Green Dot + Blue Dot Alignment: Multiple indicator confirmation
Green Dot During Green Fill Expansion: Trend continuation signal
Sell Signals (In Order of Strength)
Bearish Divergence + Red Dot: Highest probability reversal signal (price making higher highs while oscillator makes lower highs, followed by crossover)
Red Dot Above Long Average Line: Strong overbought reversal signal
Red Dot + Orange Dot Alignment: Multiple indicator confirmation
Red Dot During Red Fill Expansion: Trend continuation signal
Trading Strategies
Divergence Trading Strategy
Identify "Bullish" or "Bearish" divergence labels on the chart
Wait for confirming dot signal in the same direction
Enter when both divergence and dot signal align
Set stops based on recent swing points
Target the opposite band or previous significant level
Overbought/Oversold Reversal Strategy
Wait for the oscillator to reach extreme bands (Long or Short Average lines)
Look for crossover signals at these extreme levels:
Bullish Crossover (Oversold): Green dots when oscillator is below Short Average
Bearish Crossover (Overbought): Red dots when oscillator is above Long Average
Enter when price confirms the reversal
Set stops beyond the recent extreme
Target the opposite band or at least the zero line
Multi-Confirmation Strategy
For highest probability trades, look for:
Multiple signal types aligning (e.g., Green + Blue dots or Red + Orange dots)
Signals occurring at band extremes
Divergence patterns reinforcing the signal direction
Background fill color supporting the signal (green fill for buys, red fill for sells)
⚙️ CUSTOMIZATION OPTIONS
The indicator offers extensive customization to adapt to different markets and trading styles:
Y-axis scale factor: Controls the band range multiplier (default 2.5)
Parameter 1: Controls the smoothing period for main calculations (default 8)
Parameter 2: Controls the signal line calculation period (default 9)
Fast/Slow Length: Controls traditional MACD calculation periods (12/26)
Oscillator MA Type: Selection between SMA and EMA for main oscillator
Signal Line MA Type: Selection between SMA and EMA for signal line
Divergence Settings: Customizable lookback parameters and display options
Don't touch the zero line?: Toggle option for divergence filtering
❗️LIMITATIONS
Signal Lag: The system identifies reversals after they have begun, potentially missing the absolute bottom or top
False Signals: Can occur during periods of high volatility or during ranging markets
Divergence Validation: Not all divergences lead to reversals; confirmation is essential
Timeframe Sensitivity: The indicator works best on intermediate timeframes (15m to 4h) for most markets
Bar Closing Requirement: All signals are based on closed candles and may be subject to change until the candle closes
RISK DISCLAIMER
Trading involves substantial risk, and most traders may incur losses. All content, tools, scripts, articles, and education provided by TradeDots are for informational and educational purposes only. Past performance is not indicative of future results.
This oscillator should be used as part of a complete trading approach that includes proper risk management, consideration of the broader market context, and confirmation from price action patterns. No trading system can guarantee profits, and users should always exercise caution and use appropriate position sizing.

Multi-Timeframe MACD Strategy ver 1.0Multi-Timeframe MACD Strategy: Enhanced Trend Trading with Customizable Entry and Trailing Stop
This strategy utilizes the Moving Average Convergence Divergence (MACD) indicator across multiple timeframes to identify strong trends, generate precise entry and exit signals, and manage risk with an optional trailing stop loss. By combining the insights of both the current chart's timeframe and a user-defined higher timeframe, this strategy aims to improve trade accuracy, reduce exposure to false signals, and capture larger market moves.
Key Features:
Dual Timeframe Analysis: Calculates and analyzes the MACD on both the current chart's timeframe and a user-selected higher timeframe (e.g., Daily MACD on a 1-hour chart). This provides a broader market context, helping to confirm trends and filter out short-term noise.
Configurable MACD: Fine-tune the MACD calculation with adjustable Fast Length, Slow Length, and Signal Length parameters. Optimize the indicator's sensitivity to match your trading style and the volatility of the asset.
Flexible Entry Options: Choose between three distinct entry types:
Crossover: Enters trades when the MACD line crosses above (long) or below (short) the Signal line.
Zero Cross: Enters trades when the MACD line crosses above (long) or below (short) the zero line.
Both: Combines both Crossover and Zero Cross signals, providing more potential entry opportunities.
Independent Timeframe Control: Display and trade based on the current timeframe MACD, the higher timeframe MACD, or both. This allows you to focus on the information most relevant to your analysis.
Optional Trailing Stop Loss: Implements a configurable trailing stop loss to protect profits and limit potential losses. The trailing stop is adjusted dynamically as the price moves in your favor, based on a user-defined percentage.
No Repainting: Employs lookahead=barmerge.lookahead_off in the request.security() function to prevent data leakage and ensure accurate backtesting and real-time signals.
Clear Visual Signals (Optional): Includes optional plotting of the MACD and Signal lines for both timeframes, with distinct colors for easy visual identification. These plots are for visual confirmation and are not required for the strategy's logic.
Suitable for Various Trading Styles: Adaptable to swing trading, day trading, and trend-following strategies across diverse markets (stocks, forex, cryptocurrencies, etc.).
Fully Customizable: All parameters are adjustable, including timeframes, MACD Settings, Entry signal type and trailing stop settings.
How it Works:
MACD Calculation: The strategy calculates the MACD (using the standard formula) for both the current chart's timeframe and the specified higher timeframe.
Trend Identification: The relationship between the MACD line, Signal line, and zero line is used to determine the current trend for each timeframe.
Entry Signals: Buy/sell signals are generated based on the selected "Entry Type":
Crossover: A long signal is generated when the MACD line crosses above the Signal line, and both timeframes are in agreement (if both are enabled). A short signal is generated when the MACD line crosses below the Signal line, and both timeframes are in agreement.
Zero Cross: A long signal is generated when the MACD line crosses above the zero line, and both timeframes agree. A short signal is generated when the MACD line crosses below the zero line and both timeframes agree.
Both: Combines Crossover and Zero Cross signals.
Trailing Stop Loss (Optional): If enabled, a trailing stop loss is set at a specified percentage below (for long positions) or above (for short positions) the entry price. The stop-loss is automatically adjusted as the price moves favorably.
Exit Signals:
Without Trailing Stop: Positions are closed when the MACD signals reverse according to the selected "Entry Type" (e.g., a long position is closed when the MACD line crosses below the Signal line if using "Crossover" entries).
With Trailing Stop: Positions are closed if the price hits the trailing stop loss.
Backtesting and Optimization: The strategy automatically backtests on the chart's historical data, allowing you to assess its performance and optimize parameters for different assets and timeframes.
Example Use Cases:
Confirming Trend Strength: A trader on a 1-hour chart sees a bullish MACD crossover on the current timeframe. They check the MTF MACD strategy and see that the Daily MACD is also bullish, confirming the strength of the uptrend.
Filtering Noise: A trader using a 15-minute chart wants to avoid false signals from short-term volatility. They use the strategy with a 4-hour higher timeframe to filter out noise and only trade in the direction of the dominant trend.
Dynamic Risk Management: A trader enters a long position and enables the trailing stop loss. As the price rises, the trailing stop is automatically adjusted upwards, protecting profits. The trade is exited either when the MACD reverses or when the price hits the trailing stop.
Disclaimer:
The MACD is a lagging indicator and can produce false signals, especially in ranging markets. This strategy is for educational and informational purposes only and should not be considered financial advice. Backtest and optimize the strategy thoroughly, combine it with other technical analysis tools, and always implement sound risk management practices before using it with real capital. Past performance is not indicative of future results. Conduct your own due diligence and consider your risk tolerance before making any trading decisions.

MACD Sniper [trade_lexx]📈 MACD Sniper — Improve your trading strategy with accurate signals!
Introducing the MACD Sniper , an advanced trading indicator designed for a comprehensive analysis of market conditions. This indicator combines MACD (Moving Average Convergence Divergence) with various types of moving averages (SMA, EMA, WMA, VWMA, KAMA, HMA, ZLEMA, TEMA, ALMA, DEMA), providing traders with a powerful tool for generating buy and sell signals. It is ideal for traders who need an advantage in detecting changes in trends and market conditions.
🔍 How the signals work
1. Histogram signals:
— A buy signal is generated when the MACD histogram is below zero and begins to grow after the minimum number of falling histogram columns, which are indicated in the indicator menu. This indicates that selling pressure has decreased, the market is oversold and ready for a rebound. The signals are displayed as green triangles labeled "H" under the histogram graph. On the main chart, buy signals are displayed as green triangles labeled "Buy" under candlesticks.
— A sell signal is generated when the MACD histogram is above zero and begins to fall after the minimum number of growing histogram columns, which are indicated in the indicator menu. This indicates that the buying pressure has decreased, the market is overbought and ready for correction. The signals are displayed as red triangles labeled "H" above the histogram graph. On the main chart, the sell signals are displayed as red triangles with the word "Sell" above the candlesticks.
2. Moving Average Crossing Signals (MA):
— A buy signal is generated when the Fast Moving Average (MACD) crosses the Slow Moving Average (Signal Line) from bottom to top. This indicates a possible upward reversal of the market. The signals are displayed as green triangles labeled "MA" under the MACD chart. On the main chart, buy signals are displayed as green triangles labeled "Buy" under candlesticks.
— A sell signal is generated when the Fast Moving Average (MACD) crosses the slow Moving Average (Signal Line) from top to bottom. This indicates a possible downward reversal of the market. The signals are displayed as red triangles labeled "MA" above the MACD chart. On the main chart, the sell signals are displayed as red triangles with the word "Sell" above the candlesticks.
🔧 Signal filtering
— Minimum number of bars between signals
This filter allows the user to set the minimum number of bars that must pass between the generation of two consecutive signals. This helps to avoid frequent false alarms and improves the quality of the generated signals. Setting this parameter allows you to filter out the noise in the market and make the signals more reliable. For example, if the value is set to 5, then a new signal will be generated only after 5 bars have passed since the previous signal.
— "Wait for the opposite signal" mode
In this mode, Buy and Sell signals are generated only after receiving the opposite signal. This means that a buy signal will be generated only after the previous sell signal, and vice versa. This approach adds an additional level of filtering and helps to avoid false positives. This is especially useful in conditions of high market volatility, when false signals often occur.
— RSI filter
The Relative Strength Index (RSI) is used for additional filtering of buy and sell signals. The RSI helps determine whether a market is overbought or oversold. The user can set overbought and oversold levels, and signals will be generated only when the RSI is in the specified ranges. For example, a buy signal will be generated only if the RSI is in the range between 10 and 30 (oversold), and a sell signal if the RSI is in the range between 70 and 90 (overbought). This helps to avoid false signals in extreme market conditions.
🔌 Connector Histogram, MA, Combined 🔌
These parameters allow you to connect the indicator to trading strategies and test the signals throughout the trading history. This makes the indicator an even more powerful tool for traders who want to test the effectiveness of their strategies on historical data.
Connector Histogram provides the ability to connect signals based on the MACD histogram to trading strategies.
Connector MA allows you to connect signals based on the intersection of moving averages (MA) of the MACD, which can also be used for automatic trading or strategy testing.
The combined connector combines signals based on both a histogram and the intersection of moving averages, making the analysis more comprehensive and reliable, which is especially useful for traders seeking to improve the quality of their trading decisions.
🔔 Alerts
The indicator provides the ability to set up notifications for buy and sell signals, which allows traders to keep abreast of important market events without having to constantly monitor the chart. Users can set up notifications that will alert them when buy or sell signals appear, helping them respond to market changes in a timely manner and make informed decisions. These notifications can be configured for various types of signals, such as signals based on the MACD histogram, moving average crossings, or all at once, which makes the indicator a more convenient and functional tool for active traders.
🎨 Customizable Appearance
Customize the appearance of the MACD Sniper according to your preferences to make the analysis more convenient and visually pleasing. In the indicator settings section, you can change the colors of the buy and sell signals so that they stand out on the chart and are easily visible. For example, buy signals can be green, and sell signals can be red. These settings allow traders to adapt the indicator to their individual needs, making it more flexible and user-friendly.
🔧 How it works
The MACD Sniper indicator starts by calculating the MACD values and moving averages for a specific period in order to assess market conditions. For this, fast and slow moving averages are used, as well as a signal line, which are calculated based on the set parameters. The indicator then analyzes the MACD histogram to determine whether the difference between the fast and slow moving averages is rising or falling. Based on this analysis, buy and sell signals are generated. Additionally, the indicator uses the RSI filter to filter out false signals in overbought or oversold market conditions. The user can set the minimum number of bars between the signals and the "Wait for the opposite signal" mode for additional filtering. The indicator dynamically adjusts to changes in the market, providing relevant signals in real time.
📚 Quick guide to using the MACD Sniper
— Add the indicator to your favorites by clicking on the rocket icon. Adjust the parameters such as the length of periods for fast and slow moving averages, the type of moving average (SMA, EMA, WMA, VWMA, KAMA, HMA, ZLEMA, TEMA, ALMA, DEMA) and the length of the signal line, according to your trading style, or leave all settings as default.
— Adjust the signal filters to improve their quality and avoid false alarms
— Turn on notifications so that you don't miss important trading opportunities and don't constantly sit at the chart. This will allow you to keep abreast of all key market events and respond to them in a timely manner, without being distracted from other business.
— Use signals, they will help you determine the optimal entry and exit points of positions.
— Use the Connector for deeper analysis and verification of the effectiveness of signals, connect them to your trading strategies. This will allow you to test signals throughout your trading history and evaluate their accuracy based on historical data.
— Include the indicator in your trading strategy and run testing to see how buy and sell signals have worked in the past.
— Analyze the test results to determine how reliable the signals are and how they can improve your trading strategy. This will help you make more informed decisions and increase your trading efficiency.

Multi-indicator Signal Builder [Skyrexio]Overview
Multi-Indicator Signal Builder is a versatile, all-in-one script designed to streamline your trading workflow by combining multiple popular technical indicators under a single roof. It features a single-entry, single-exit logic, intrabar stop-loss/take-profit handling, an optional time filter, a visually accessible condition table, and a built-in statistics label. Traders can choose any combination of 12+ indicators (RSI, Ultimate Oscillator, Bollinger %B, Moving Averages, ADX, Stochastic, MACD, PSAR, MFI, CCI, Heikin Ashi, and a “TV Screener” placeholder) to form entry or exit conditions. This script aims to simplify strategy creation and analysis, making it a powerful toolkit for technical traders.
Indicators Overview
1. RSI (Relative Strength Index)
Measures recent price changes to evaluate overbought or oversold conditions on a 0–100 scale.
2. Ultimate Oscillator (UO)
Uses weighted averages of three different timeframes, aiming to confirm price momentum while avoiding false divergences.
3. Bollinger %B
Expresses price relative to Bollinger Bands, indicating whether price is near the upper band (overbought) or lower band (oversold).
4. Moving Average (MA)
Smooths price data over a specified period. The script supports both SMA and EMA to help identify trend direction and potential crossovers.
5. ADX (Average Directional Index)
Gauges the strength of a trend (0–100). Higher ADX signals stronger momentum, while lower ADX indicates a weaker trend.
6. Stochastic
Compares a closing price to a price range over a given period to identify momentum shifts and potential reversals.
7. MACD (Moving Average Convergence/Divergence)
Tracks the difference between two EMAs plus a signal line, commonly used to spot momentum flips through crossovers.
8. PSAR (Parabolic SAR)
Plots a trailing stop-and-reverse dot that moves with the trend. Often used to signal potential reversals when price crosses PSAR.
9. MFI (Money Flow Index)
Similar to RSI but incorporates volume data. A reading above 80 can suggest overbought conditions, while below 20 may indicate oversold.
10. CCI (Commodity Channel Index)
Identifies cyclical trends or overbought/oversold levels by comparing current price to an average price over a set timeframe.
11. Heikin Ashi
A type of candlestick charting that filters out market noise. The script uses a streak-based approach (multiple consecutive bullish or bearish bars) to gauge mini-trends.
12. TV Screener
A placeholder condition designed to integrate external buy/sell logic (like a TradingView “Buy” or “Sell” rating). Users can override or reference external signals if desired.
Unique Features
1. Multi-Indicator Entry and Exit
You can selectively enable any subset of 12+ classic indicators, each with customizable parameters and conditions. A position opens only if all enabled entry conditions are met, and it closes only when all enabled exit conditions are satisfied, helping reduce false triggers.
2. Single-Entry / Single-Exit with Intrabar SL/TP
The script supports a single position at a time. Once a position is open, it monitors intrabar to see if the price hits your stop-loss or take-profit levels before the bar closes, making results more realistic for fast-moving markets.
3. Time Window Filter
Users may specify a start/end date range during which trades are allowed, making it convenient to focus on specific market cycles for backtesting or live trading.
4. Condition Table and Statistics
A table at the bottom of the chart lists all active entry/exit indicators. Upon each closed trade, an integrated statistics label displays net profit, total trades, win/loss count, average and median PnL, etc.
5. Seamless Alerts and Automation
Configure alerts in TradingView using “Any alert() function call.”
The script sends JSON alert messages you can route to your own webhook.
The indicator can be integrated with Skyrexio alert bots to automate execution on major cryptocurrency exchanges
6. Optional MA/PSAR Plots
For added visual clarity, optionally plot the chosen moving averages or PSAR on the chart to confirm signals without stacking multiple indicators.
Methodology
1. Multi-Indicator Entry Logic
When multiple entry indicators are enabled (e.g., RSI + Stochastic + MACD), the script requires all signals to align before generating an entry. Each indicator can be set for crossovers, crossunders, thresholds (above/below), etc. This “AND” logic aims to filter out low-confidence triggers.
2. Single-Entry Intrabar SL/TP
One Position At a Time: Once an entry signal triggers, a trade opens at the bar’s close.
Intrabar Checks: Stop-loss and take-profit levels (if enabled) are monitored on every tick. If either is reached, the position closes immediately, without waiting for the bar to end.
3. Exit Logic
All Conditions Must Agree: If the trade is still open (SL/TP not triggered), then all enabled exit indicators must confirm a closure before the script exits on the bar’s close.
4. Time Filter
Optional Trading Window: You can activate a date/time range to constrain entries and exits strictly to that interval.
Justification of Methodology
Indicator Confluence: Combining multiple tools (RSI, MACD, etc.) can reduce noise and false signals.
Intrabar SL/TP: Capturing real-time spikes or dips provides a more precise reflection of typical live trading scenarios.
Single-Entry Model: Straightforward for both manual and automated tracking (especially important in bridging to bots).
Custom Date Range: Helps refine backtesting for specific market conditions or to avoid known irregular data periods.
How to Use
1. Add the Script to Your Chart
In TradingView, open Indicators , search for “Multi-indicator Signal Builder”.
Click to add it to your chart.
2. Configure Inputs
Time Filter: Set a start and end date for trades.
Alerts Messages: Input any JSON or text payload needed by your external service or bot.
Entry Conditions: Enable and configure any indicators (e.g., RSI, MACD) for a confluence-based entry.
Close Conditions: Enable exit indicators, along with optional SL (negative %) and TP (positive %) levels.
3. Set Up Alerts
In TradingView, select “Create Alert” → Condition = “Any alert() function call” → choose this script.
Entry Alert: Triggers on the script’s entry signal.
Close Alert: Triggers on the script’s close signal (or if SL/TP is hit).
Skyrexio Alert Bots: You can route these alerts via webhook to Skyrexio alert bots to automate order execution on major crypto exchanges (or any other supported broker).
4. Visual Reference
A condition table at the bottom summarizes active signals.
Statistics Label updates automatically as trades are closed, showing PnL stats and distribution metrics.
Backtesting Guidelines
Symbol/Timeframe: Works on multiple assets and timeframes; always do thorough testing.
Realistic Costs: Adjust commissions and potential slippage to match typical exchange conditions.
Risk Management: If using the built-in stop-loss/take-profit, set percentages that reflect your personal risk tolerance.
Longer Test Horizons: Verify performance across diverse market cycles to gauge reliability.
Example of statistic calculation
Test Period: 2023-01-01 to 2025-12-31
Initial Capital: $1,000
Commission: 0.1%, Slippage ~5 ticks
Trade Count: 468 (varies by strategy conditions)
Win rate: 76% (varies by strategy conditions)
Net Profit: +96.17% (varies by strategy conditions)
Disclaimer
This indicator is provided strictly for informational and educational purposes .
It does not constitute financial or trading advice.
Past performance never guarantees future results.
Always test thoroughly in demo environments before using real capital.
Enjoy exploring the Multi-Indicator Signal Builder! Experiment with different indicator combinations and adjust parameters to align with your trading preferences, whether you trade manually or link your alerts to external automation services. Happy trading and stay safe!

[KVA] KMACDKMACD Indicator: Advanced Market Analysis Through Central Tendency Metrics
The KMACD (KAMVIA Moving Average Convergence Divergence) indicator is an advanced, multi-dimensional tool designed to provide traders and analysts with a deeper understanding of market dynamics. By integrating the classical MACD framework with statistical measures of central tendency, KMACD offers a sophisticated approach to identifying trends, reversals, and potential trading opportunities.
Key Features of the KMACD Indicator:
1. Enhanced MACD Calculation :
- The KMACD employs dual moving averages (fast and slow) of user-defined types (SMA, EMA, WMA) to calculate the MACD line, which represents the difference between these moving averages. This traditional approach is further enhanced by customizable signal smoothing, allowing users to fine-tune the sensitivity of the indicator.
2. Central Tendency Metrics :
- The indicator integrates additional statistical measures, such as Mean, Median, Mode, Standard Deviation, and Variance, calculated over a rolling window. These metrics provide insights into the central tendencies of the MACD values, helping traders understand the overall trend direction and the dispersion of price movements around the trend.
3. RSI-Like Oscillator :
- A unique RSI-like value derived from the MACD line is included to highlight overbought and oversold conditions. This offers a dual-layered perspective, combining the power of MACD and RSI methodologies, to signal potential market extremes with greater precision.
4. Customizable Visual Elements :
- KMACD allows users to toggle the visibility of the MACD line, Signal line, and Histogram, providing flexibility in how the data is presented. The histogram dynamically changes color—green when above zero, indicating bullish momentum, and red when below zero, indicating bearish momentum.
5. Horizontal Line Customization :
- The indicator includes customizable horizontal lines for the zero level, overbought, and oversold thresholds. These lines serve as visual cues to identify key price levels and market conditions.
6. Adaptive to Various Market Conditions :
- KMACD's comprehensive features make it adaptable to various market conditions, from trending markets to sideways consolidations. Whether you're looking to capture momentum shifts or identify potential reversal points, KMACD provides the analytical power needed to make informed trading decisions.
How to Use KMACD:
- Trend Identification : Use the MACD line in conjunction with central tendency measures (Mean, Median, Mode) to gauge the overall market trend and its strength. A rising MACD line, supported by higher mean and median values, typically indicates an uptrend.
- Momentum Analysis : The histogram and RSI-like value help in identifying the momentum behind price movements. Positive histogram bars suggest increasing bullish momentum, while negative bars suggest increasing bearish momentum.
- Overbought/Oversold Conditions : Monitor the RSI-like oscillator and the overbought/oversold levels to detect when the market may be poised for a reversal.
- Divergence Detection : Look for divergences between the MACD line and price action, supported by the central tendency measures, to spot potential reversal points.
Conclusion
The KMACD indicator is more than just a traditional MACD; it’s a comprehensive tool designed to cater to both novice and experienced traders. By incorporating central tendency metrics and customizable features, KMACD stands out as a versatile and powerful indicator that enhances market analysis and trading strategies. Whether you're navigating volatile markets or steady trends, KMACD offers the precision and depth needed to stay ahead.

MACD with 1D Stochastic Confirmation Reversal StrategyOverview
The MACD with 1D Stochastic Confirmation Reversal Strategy utilizes MACD indicator in conjunction with 1 day timeframe Stochastic indicators to obtain the high probability short-term trend reversal signals. The main idea is to wait until MACD line crosses up it’s signal line, at the same time Stochastic indicator on 1D time frame shall show the uptrend (will be discussed in methodology) and not to be in the oversold territory. Strategy works on time frames from 30 min to 4 hours and opens only long trades.
Unique Features
Dynamic stop-loss system: Instead of fixed stop-loss level strategy utilizes average true range (ATR) multiplied by user given number subtracted from the position entry price as a dynamic stop loss level.
Configurable Trading Periods: Users can tailor the strategy to specific market windows, adapting to different market conditions.
Higher time frame confirmation: Strategy utilizes 1D Stochastic to establish the major trend and confirm the local reversals with the higher probability.
Trailing take profit level: After reaching the trailing profit activation level scrip activate the trailing of long trade using EMA. More information in methodology.
Methodology
The strategy opens long trade when the following price met the conditions:
MACD line of MACD indicator shall cross over the signal line of MACD indicator.
1D time frame Stochastic’s K line shall be above the D line.
1D time frame Stochastic’s K line value shall be below 80 (not overbought)
When long trade is executed, strategy set the stop-loss level at the price ATR multiplied by user-given value below the entry price. This level is recalculated on every next candle close, adjusting to the current market volatility.
At the same time strategy set up the trailing stop validation level. When the price crosses the level equals entry price plus ATR multiplied by user-given value script starts to trail the price with EMA. If price closes below EMA long trade is closed. When the trailing starts, script prints the label “Trailing Activated”.
Strategy settings
In the inputs window user can setup the following strategy settings:
ATR Stop Loss (by default = 3.25, value multiplied by ATR to be subtracted from position entry price to setup stop loss)
ATR Trailing Profit Activation Level (by default = 4.25, value multiplied by ATR to be added to position entry price to setup trailing profit activation level)
Trailing EMA Length (by default = 20, period for EMA, when price reached trailing profit activation level EMA will stop out of position if price closes below it)
User can choose the optimal parameters during backtesting on certain price chart, in our example we use default settings.
Justification of Methodology
This strategy leverages 2 time frames analysis to have the high probability reversal setups on lower time frame in the direction of the 1D time frame trend. That’s why it’s recommended to use this strategy on 30 min – 4 hours time frames.
To have an approximation of 1D time frame trend strategy utilizes classical Stochastic indicator. The Stochastic Indicator is a momentum oscillator that compares a security's closing price to its price range over a specific period. It's used to identify overbought and oversold conditions. The indicator ranges from 0 to 100, with readings above 80 indicating overbought conditions and readings below 20 indicating oversold conditions.
It consists of two lines:
%K: The main line, calculated using the formula (CurrentClose−LowestLow)/(HighestHigh−LowestLow)×100 . Highest and lowest price taken for 14 periods.
%D: A smoothed moving average of %K, often used as a signal line.
Strategy logic assumes that on 1D time frame it’s uptrend in %K line is above the %D line. Moreover, we can consider long trade only in %K line is below 80. It means that in overbought state the long trade will not be opened due to higher probability of pullback or even major trend reversal. If these conditions are met we are going to our working (lower) time frame.
On the chosen time frame, we remind you that for correct work of this strategy you shall use 30min – 4h time frames, MACD line shall cross over it’s signal line. The MACD (Moving Average Convergence Divergence) is a popular momentum and trend-following indicator used in technical analysis. It helps traders identify changes in the strength, direction, momentum, and duration of a trend in a stock's price.
The MACD consists of three components:
MACD Line: This is the difference between a short-term Exponential Moving Average (EMA) and a long-term EMA, typically calculated as: MACD Line=12-period EMA−26-period
Signal Line: This is a 9-period EMA of the MACD Line, which helps to identify buy or sell signals. When the MACD Line crosses above the Signal Line, it can be a bullish signal (suggesting a buy); when it crosses below, it can be a bearish signal (suggesting a sell).
Histogram: The histogram shows the difference between the MACD Line and the Signal Line, visually representing the momentum of the trend. Positive histogram values indicate increasing bullish momentum, while negative values indicate increasing bearish momentum.
In our script we are interested in only MACD and signal lines. When MACD line crosses signal line there is a high chance that short-term trend reversed to the upside. We use this strategy on 45 min time frame.
ATR is used to adjust the strategy risk management to the current market volatility. If volatility is low, we don’t need the large stop loss to understand the there is a high probability that we made a mistake opening the trade. User can setup the settings ATR Stop Loss and ATR Trailing Profit Activation Level to realize his own risk to reward preferences, but the unique feature of a strategy is that after reaching trailing profit activation level strategy is trying to follow the trend until it is likely to be finished instead of using fixed risk management settings. It allows sometimes to be involved in the large movements.
Backtest Results
Operating window: Date range of backtests is 2023.01.01 - 2024.08.01. It is chosen to let the strategy to close all opened positions.
Commission and Slippage: Includes a standard Binance commission of 0.1% and accounts for possible slippage over 5 ticks.
Initial capital: 10000 USDT
Percent of capital used in every trade: 30%
Maximum Single Position Loss: -4.79%
Maximum Single Profit: +20.14%
Net Profit: +2361.33 USDT (+44.72%)
Total Trades: 123 (44.72% win rate)
Profit Factor: 1.623
Maximum Accumulated Loss: 695.80 USDT (-5.48%)
Average Profit per Trade: 19.20 USDT (+0.59%)
Average Trade Duration: 30 hours
These results are obtained with realistic parameters representing trading conditions observed at major exchanges such as Binance and with realistic trading portfolio usage parameters.
How to Use
Add the script to favorites for easy access.
Apply to the desired timeframe between 30 min and 4 hours and chart (optimal performance observed on 45 min BTC/USDT).
Configure settings using the dropdown choice list in the built-in menu.
Set up alerts to automate strategy positions through web hook with the text: {{strategy.order.alert_message}}
Disclaimer:
Educational and informational tool reflecting Skyrex commitment to informed trading. Past performance does not guarantee future results. Test strategies in a simulated environment before live implementation

MACD Based Price Forecasting [LuxAlgo]The MACD Based Price Forecasting tool is an innovative price forecasting method based on signals generated by the MACD indicator.
The forecast includes an area which can help traders determine the area where price can develop after a MACD signal.
🔶 USAGE
The forecast returned by the tool allows users to obtain a general picture of how price tends to progress after a specific MACD signal. The forecast is constructed based on percentiles of previous price progressions done after a specific MACD signal is generated.
Users can change which condition is used to generate MACD signals from the "Trend Determination" dropdown menu, with "MACD" determining trends based on whether the MACD is positive (uptrend) or negative (downtrend) and "MACD-Signal" determining trends based on the position of the MACD relative to its signal line, with an MACD above the signal line indicating an uptrend, else a downtrend.
Users can introduce bias to the forecast by changing the "Average Percentage" setting, with values above 50% introducing bullish bias, and below bearish bias.
It can be possible for the forecast to highlight potential reversals depending on the selected forecasting horizon as long as reversals can be observed on trends detected by the MACD.
🔹 Forecasting Area
The forecasting area can help visualize the area that will likely contain price after a specific signal. The area width is based on the "Top/Bottom Percentiles" settings, with a higher "Top Percentile" value returning a higher top bound and a lower "Bottom Percentile" value returning a lower bottom bound.
These areas can also serve as potential support/resistance areas.
🔶 SETTINGS
Fast Length: Fast length of the moving average used to compute the MACD
Slow Length: Slow length of the moving average used to compute the MACD
Signal Length: Length of the MACD moving average.
Trend Determination: Method used to determine a trend direction from the MACD.
🔹 Forecast
Maximum Memory: Determines the maximum amount of prices recorded at each steps succeeding a signal. Lower values will return forecasts with a higher degree of variability.
Forecasting Length: Forecasting horizon in bars, this value only serves as a limit of the forecasting horizon and might not be reached depending on user selected MACD settings.
Top Percentile: Percentile value used to determine the upper bound of the forecasting area.
Average Percentile: Percentile value used to determine the forecast.
Lower Percentile: Percentile value used to determine the lower bound of the forecasting area.
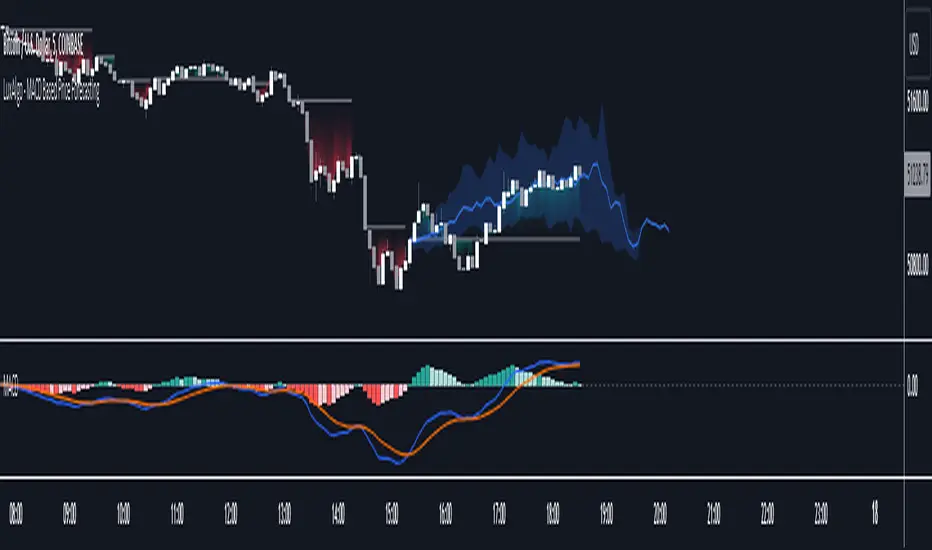
MACD_TRIGGER_CROSS_TRIANGLEMACD Triangle Trigger Indicator by thebearfib
Overview
The MACD Cross Triangle Indicator is a powerful tool for traders who rely on the MACD's signal line crossovers to make informed trading decisions. This indicator enhances the traditional MACD by allowing users to customize triggers for bullish and bearish signals and by displaying these signals directly on the chart with visually distinctive labels.
Features
Customizable Color Scheme: Choose distinct colors for bullish and bearish signals to fit your chart's theme or your personal preference.
Flexible Trigger Conditions: Select from a variety of trigger conditions based on MACD and signal line behaviors over a specified number of bars back.
Visual Signal Indicators: Bullish and bearish signals are marked with upward and downward triangles, making it easy to spot potential entry or exit points.
Detailed Trigger Descriptions: A comprehensive table lists all available triggers and their descriptions, aiding in selection and understanding of each trigger's mechanism.
Configuration Options
Bullish and Bearish Colors: Customize the color of the labels for bullish (upward) and bearish (downward) signals.
Trend Lookback Period: Choose how far back (in bars) the indicator should look to determine the trend, affecting the calculation of certain triggers.
Trigger Selection for Bullish and Bearish Signals: Pick specific triggers for both bullish and bearish conditions from a list of 10 different criteria, ranging from MACD crossovers to historical comparisons of MACD, signal line, and histogram values.
Label Size and Font Settings: Adjust the size of the signal labels on the chart and the font size of the trigger descriptions table to ensure readability and fit with your chart layout.
Trigger Descriptions Table Position and Color: Customize the position and color of the trigger descriptions table to match your chart's aesthetic and layout preferences.
Trigger Mechanisms
Trigger 1 to 10: Each trigger corresponds to a specific condition involving the MACD line, signal line, and histogram. These include crossovers, directional changes compared to previous bars, and comparisons of current values to historical values.
Usage
1. Select Trigger Conditions: Choose the desired triggers for bullish and bearish signals based on your trading strategy.
2. Customize Visuals: Set your preferred colors for the bullish and bearish labels, adjust label and font sizes, and configure the trigger descriptions table.
3. Analyze Signals: Watch for the upward (bullish) and downward (bearish) triangles to identify potential trading opportunities based on MACD crossover signals.
Conclusion
The MACD Cross Triangle Indicator offers a customizable and visually intuitive way to leverage MACD crossover signals for trading. With its flexible settings and clear signal indicators, traders can tailor the indicator to fit their strategy and improve their decision-making process on TradingView.
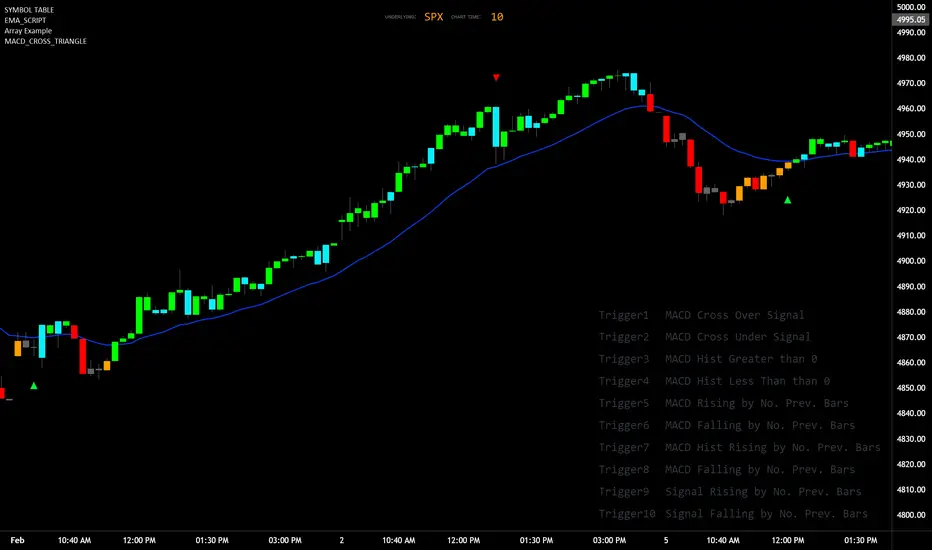
Double MACD Pattern 1.0This script is designed to assist traders in identifying potential trading signals and trends based on the MACD indicator. Users can adjust the input parameters to fine-tune the indicator to their trading preferences. When specific conditions are met, alerts are generated to notify the user of potential trading opportunities.
Indicator Description:
The script defines a custom indicator that calculates and plots two sets of Moving Average Convergence Divergence (MACD) lines along with their signal lines.
It allows users to configure various parameters for MACD calculation, such as fast and slow lengths for both MACD 1 and MACD 2, as well as signal lengths for both.
Plotting:
The script plots the MACD lines and signal lines for both MACD 1 and MACD 2 on the chart with different colors and line styles.
It also plots a middle line at zero for reference.
Alerts:
The script defines conditions for generating alerts based on MACD crossover and crossunder events for both MACD 1 and MACD 2.
Alerts are generated for the following scenarios:
A long signal is generated when MACD 1 crosses under its signal line while MACD 2 crosses over its signal line.
A short signal is generated when MACD 1 crosses over its signal line while MACD 2 crosses under its signal line.
An up trend signal is generated when MACD 2 crosses over MACD 1.
A down trend signal is generated when MACD 1 crosses over MACD 2.
Alerts are included in the script to notify users of these specific trading signals.
Please note that this script is meant for educational purposes and should be used cautiously in a real trading environment. It's important to have a thorough understanding of technical analysis and risk management when using such indicators in actual trading.