Average True Range (ATR) invisible price markers / linesThis script provides the ATR price when added to the top and bottom of the currently hovered candle.
The prices are shown top left next to the indicators' name.
This means you do not have to manually subtract or add ATR to price.
Line opacity allows you to show the lines where the ATR is, however, I recommend to keep this disabled.
Line type allows you to choose where ATR is calculated from (LowHigh or LowHighBody), the second ignoring the wicks, however LH is standard.
I also recommend to keep the other parameters as default.
I hope this indicator provides useful to you and your trading.
Lines

ObjectStackLibrary "ObjectStack"
init()
push()
push()
push()
push()
push()
nextIndex()
nextIndex()
nextIndex()
nextIndex()
nextIndex()
delete()
delete()
delete()
delete()
delete()
cleanOldest()
cleanOldest()
cleanOldest()
cleanOldest()
cleanOldest()
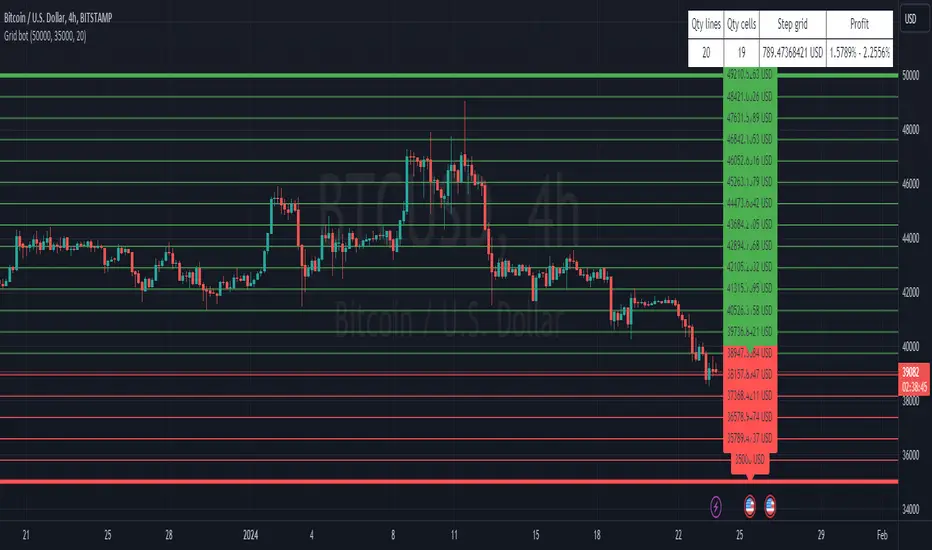
3commas GRID bot VisualisationHello everyone
This is a grid display indicator for a 3-comma grid bot.
Just enter the upper and lower borders of your grid and the number of grid cells in the indicator settings.
It's simple!
[TTI] Option expiration Lines––––History & Credit ––––––––––––––––––––––––––––––––––––––––––
While doing my yearly trade reviews, I wanted to see where I exited and entered compared to my position expiration (given I am an options trader).
–––––What it does ––––––––––––––––––––––––––––––––––––––––––
Input a date and the script will draw two vertical lines.
One the date you input and second 5 days back.
Additionally, it will highlight the 30day high and 30day low within those lines as a box.
–––––How to use it ––––––––––––––––––––––––––––––––––––––––––
You can use the script for trade reviews (as I have).
Additionally, you could set trading rules based on time. For example:
Do not hold trades past 2days to expiration
Or have tigher target and loss parameters for Opex week

[TTI] ATR channelsHISTORY AND CREDITS
Used by John Carter in his indicator’s toolbox. The ATR channels or the Keltner Channels represent the railroads or the natural movement of stocks.
WHAT IT DOES
Movements between the the The first multiplier lines (white) represent standard movement for the timeframe you are trading. Movements between the second multiplier (green/red lines) represent a 2stdv move of the stock in a single direction. Once a stock starts reaching the 3rd multiplier lines there’s an exponential chance that it will revert to the mean (cyan line)
Additionally, we have added the Institutional lines. These are thought in a Small Account Mastery class 2019 by John Carter, as the levels heavily watched by institutions. The default settings represent what John is teaching but they can be further customised.
HOW TO USE IT
ATRs channels or Keltner Channels can be great source for target or stop losses and can be used as a indicator for confluence with other technical tools like the Fibonacci lines.

LineGetPriceOnLogScaleLibrary "LineGetPriceOnLogScale"
This library provides a way to calculate the y-coordinate of a line on a specified bar when the chart scale is Log.
The built-in `line.get_price()` function only works with linear scale and gives incorrect results when the chart is in Log scale.
The library only works with `bar_index` values and `xloc.bar_index`-based lines, `time`-based lines will cause errors to appear.
coordGetPriceLog(x1, y1, x2, y2, xi) Calculates the y-coordinate on the specified bar on the logarithmic scale.
Only coordinates based on bar index are applicable, bar time will throw an error.
Parameters:
x1 : First X coordinate of a line, index of the bar where the line starts.
y1 : First Y coordinate of a line, price on the price scale.
x2 : Second X coordinate of a line, index of the bar where the line ends.
y2 : Second Y coordinate of a line, price on the price scale.
xi : Index of the bar for which the price should be calculated.
Returns: Price of the line on the bar specified in `xi`, on the logarithmic scale.
lineGetPriceLog(_line, xi) Calculates the y-coordinate on the specified bar for the logarithmic scale. Takes a line.
Only lines drawn based on `xloc.bar_index` are applicable, `xloc.bar_time` will throw and error.
Parameters:
_line : The line for which the price is calculated.
xi : Index of the bar for which the bar should calculate the price.
Returns: Price of the line on the bar specified in `xi`, on the logarithmic scale.

Daily lines (UTC)This is a simple script to add highlighted lines on the daily open.
It uses UTC as timezone.

Support and Resistance by CainKellyeCheck out my automatic support and resistance indicator that uses the EMA of price change * relative volume as the bases of pivot search.
It also tells the strength of the support and resistance lines calculated using a 4 times quicker EMA and using its distance from the slower one.
The strongest plotted line has the maximum opacity and the weakest has the minimum opacity inside the given range.
This calculation results in an organic detection of the support and resistance prices.
You can set the distance range in percentage you want to have lines calculated around the current price.
You can set the lines gravity distance inside which they are snapped together: the stronger line pulls the weaker to it by using strength weighted average for the new price value.
You can increase the minimum opacity value in case you only see few lines (but the maximum is 15)
You can change the used price for the lines to Close or High/Low but recommended is to use the average of those two (default)
The distances multiplier helps to get a birds eye view easily when using 4H (or higher) chart and a separate one to use on Daily / Weekly / Monthly for even broader view.
Lines and labels are drawn near the candles so you are still able to zoom in.
Labels are not drawn when their line is barely visible (transparency >= 80)
This indicator has been refined on the 15 minute and 1 hour charts of BTC and other cryptos but it works well in smaller volatility markets as well if the distances are adjusted accordingly.

Support and ResistanceThis indicator shows three types of support and resistance lines: Horizontal, Parallel (using linear regression) and Fibonacci Retracement. Lines can be adjusted or turned on and off in settings. A great tool for setting up entries, exits and locating pivot points.

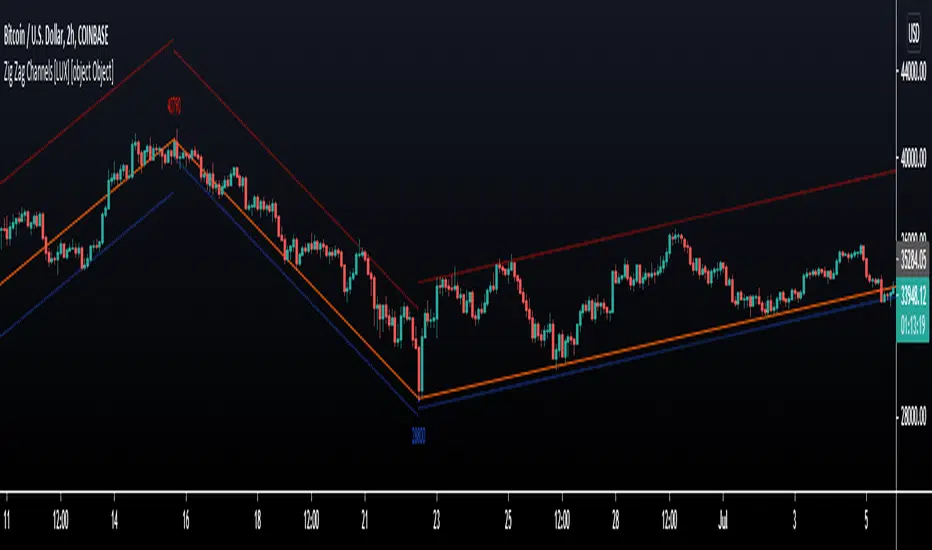
Zig Zag Channels [LuxAlgo]The Zig Zag indicator is a useful indicator when it comes to visualizing past underlying trends in the price and can make the process of using drawing tools easier. The indicator consists of a series of lines connecting points where the price deviates more than a specific percentage from a maximum/minimum point ultimately connecting local peaks and troughs.
This indicator by its very nature backpaints by default, meaning that the displayed components are offset in the past.
🔶 USAGE
The Zig Zag indicator is commonly used to returns points of references for the usage of specific drawing tools, such as Fibonacci retracements, fans, squares...etc.
The proposed indicator estimates peaks and troughs by using rolling maximums/minimums with a window size determining their significance. This window size approach allows us to have an indicator that works with a certain regularity no matter the scale of the price, something the percentage-based approach struggles with. Additionally, one upper and lower extremity are displayed, highlighting the price point that deviates the most from the Zig Zag lines.
A common usage also includes the easy determination of Elliot wave patterns in the price.
The Zig Zag indicator above highlights a downtrending motive wave.
🔹 Extremities
The novel approach taken by this Zig Zag indicator is the addition of two extremities derived from the distance between the price and the Zig Zag line, thus returning channels. It is uncommon seeing extremities in Zig Zag indicators since the line connecting peaks and troughs has rarely any other utility than seeing trend variations with more clarity and is not meant to provide an accurate estimate of underlying local trends in the price.
This channel can be useful to study the potential relationship between underlying trends and the Zig Zag line. A low width between the Zig Zag and the upper extremity indicates price variations mostly located below the Zig Zag while equal width indicates more linear trends.
When the indicator is extended to the last line, the extremities provide potential support and resistances, thus making this indicator able to forecast price variations.
🔶 SETTINGS
Length: Determines the significance of the detected peaks and troughs.
Extend To Last Bar: Extend the most recent line to the most recent closing price value.
Show Extremities: Displays the extremities.
Show Labels: Display labels highlighting the high/low prices located at peaks and troughs.
🔹 Style
Upper Extremity Color: Color of the upper extremity displayed by the indicator.
Zig Zag Color: Color of the ZigZag lines.
Lower Extremity Color: Color of the lower extremity displayed by the indicator.
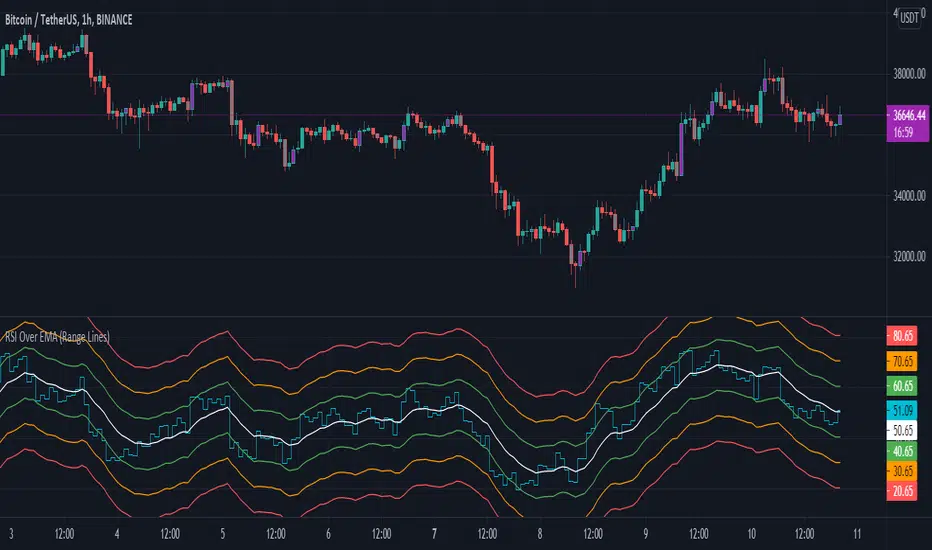
RSI Over EMA (Range Lines)This is another version of the RSI over EMA Trend Sniper script that I released here:
This one gives you better control across pairs wither higher volatility with the extra lines and more alert possibilities.
Here are the useful Alert functions within this indicator:
LONGS:
-Aqua line (RSI Line) - Crossing UP (Long Alert) on the Lower Green line
-Aqua line (RSI Line) - Crossing UP (Long Alert) on the Upper Green line
-Aqua line (RSI Line) - Crossing UP (Long Alert) on the Lower Amber line
-Aqua line (RSI Line) - Crossing UP (Long Alert) on the Upper Amber line
-Aqua line (RSI Line) - Crossing UP (Long Alert) on the Lower Red line
-Aqua line (RSI Line) - Crossing UP (Long Alert) on the Upper Red line
SHORTS:
-Aqua line (RSI Line) - Crossing DOWN (Short Alert) on the Lower Green line
-Aqua line (RSI Line) - Crossing DOWN (Short Alert) on the Upper Green line
-Aqua line (RSI Line) - Crossing DOWN (Short Alert) on the Lower Amber line
-Aqua line (RSI Line) - Crossing DOWN (Short Alert) on the Upper Amber line
-Aqua line (RSI Line) - Crossing DOWN (Short Alert) on the Lower Red line
-Aqua line (RSI Line) - Crossing DOWN (Short Alert) on the Upper Red line
You can setup alerts for the Aqua line (RSI Line) 'crossing up' (Long Alert) or 'crossing down' (Short Alert) on any of the colored EMA lines.
By default the lines are spread out at 10/20/30 and that should cover high volatility charts. But, this is customizable and you can reduce the size of Green/Amber/Red lines to try and get a better more focused setup for whichever coin you are trading on. I have found this version of the RSI over EMA to work better with alt coins that are generally more volatile, but using it on Bitcoin works too.
I am using this for Cryptocurrency alerts, but not for automation to enter or exit a trade. It's important to only use this on normal candles, and only use it as a confirmation of a possible good entry or exit.
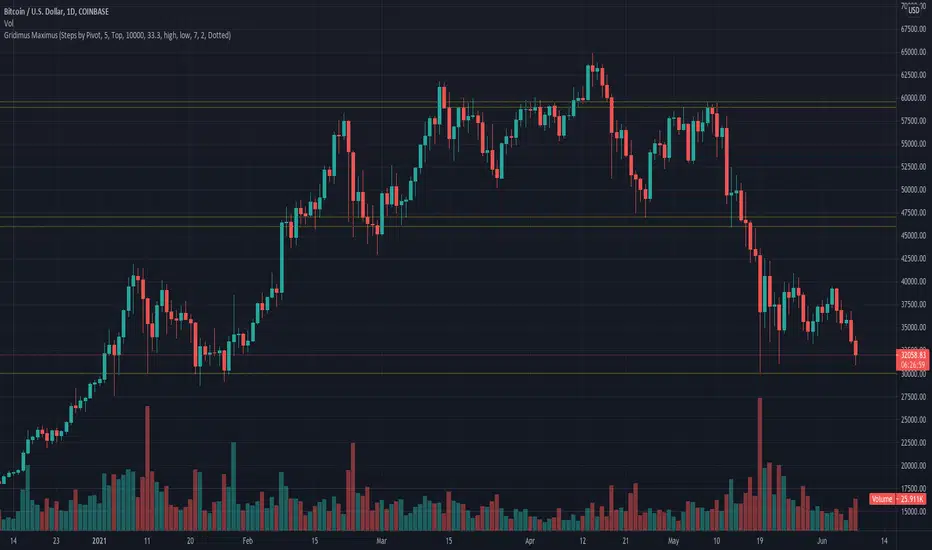
Gridimus MaximusGridimus Maximus draws N grid lines stepping by price or percent in chosen direction from set price, or draws N grid lines stepping by pivots.
The queue function method used is adapted from an example provided on the PineCoders website, much gratitude to LucF for this gem!
To prevent grid lines out of range from causing chart to rescale right click on chart's price column and enable Scale Price Chart Only.
Pictured example above is using Type Of Increment: Steps By Pivot, Number Of Steps: 5.
Pictured example below is using Type Of Increment: Steps By Price, Number Of Steps: 6, Starts From Price: $10k, Steps By Percent Or Price: $10k.
Pictured example below is using Type Of Increment: Steps By Percent, Number Of Steps: 7, Starts From Price: $10k, Steps By Percent Or Price: 33%.
NOTICE: This is an example script and not meant to be used as an actual strategy. By using this script or any portion thereof, you acknowledge that you have read and understood that this is for research purposes only and I am not responsible for any financial losses you may incur by using this script!
EMA 8, 21 and SMA 50 from daily timeframe horizontal linesShow horizontal lines after the last point of EMA8, EMA21 and SMA50 from daily timeframe. Always shows the daily lines no matter the timeframe of your chart. It can be use as a reference in intraday time frames lower than 1 day.
Muestra líneas horizontales que continúan del último punto del EMA8, EMA21 y SMA50. Siempre muestra las líneas diarias sin importar el rango de tiempo que estés utilizando. Se puede usar como líneas de referencia para intradía.

Horizontal Plot Lines - Max. 24 - grid strategy - DARK LINESWhen I looked for something like this I couldn't find it. Although simple in appearance, this script was actually quite long and complicated to create. It allows you to break up any horizontal space in up to 24 lines. Just remember that 13 lines equal 12 levels, as the top and bottom lines are the placeholders. So, if you are using quarters theory, you would want to select 5 lines.
It automatically sets the top line at a user-selectable place, like the close of the highest candlestick. It also allows you to select the lowest point as the close or the low. This way you can use the bodies of the candlestick or the wicks. You can also set the lookback period, so that your high and low can be set as far back as you prefer in the timescale you are looking at.
You can use these lines in things like quarters theory, or analyze buy and sell points in a grid bot strategy. This indicator could help you to determine where to equally place your buy and sells in a grid with up to 24 different placements.
This version has dark lines and is suitable for the light template. There is a matching light line version for a dark template.

Auto Horizontal Lines_Arshak_TcAdjust the time as per your purpose.Turn off second line option if you don't need it.

Volumetric colored candles with matching pivot point linesCandles are split into 10 categories based on their volume, and can be changed in the options. By default and in the images, white is very high volume, reds are high volume, yellows are medium volume, greens are low and dark-grey is very low.
Adjustments for scale are included in the options. The Magnitude option is a 10x multiplier, so 1=10, 2=100, 3=1000, etc., up to 9. There is also a Multiplier selection option where 1=1, 2=2, 3=3, 4=4, etc.
To attenuate for a given chart, these multipliers will need to be changed. In general, all white means you need to increase the Magnitude and all dark-grey means you need to decrease the magnitude. Somewhere between those two, the Multiplier can be used for further calibration. All this color coating is relational, like a spectrum. As you adjust you will see them maintaining their proportions as the candles switch color (ex. green become yellow while yellow becomes red).
I have also included pivot lines that follow the same logic for color coding. Two options exist for adjusting the pivot high and pivot low points respectively. They do not always correspond to the exact color of the candle producing them, but they should be a rough average (ie. red and green bars making yellow lines). They make for good indicators of how much liquidity may be at a certain support/resistance level. The lines can also be turned off altogether.
If your candles aren't looking right, go to settings of both regular candles and heikin-ashi, and uncheck both border and wick.
I still have some code to clean up and I plan on expanding upon this study. If you like my work consider tipping!

Parallel Pivot Lines [LuxAlgo]Displays lines connecting past pivot high/low points with each line having the slope of a linear regression. This slope can also be controlled by the user with the 'Slope' setting. Each line can be used as a support or resistance by the user.
Settings
Length : Pivot length. Use higher values for having lines connected to more significant pivots points.
Lookback : Number of lines connecting a pivot high/low to display, with a total of lines equal to Lookback*2
Slope : Allows the user to multiply the linear regression slope by a number within -1 and 1
Limitations
The script has currently several real time behavior limitations. Lines are displayed retrospectively and will not update with the arrival of new bars. Readjusting the indicator to newer pivots will require the user to either hide/unhide the indicator or change its settings.
High Length or Lookback values might not return any lines if the location of a pivot point is outside the defined buffer size of the indicator (set as 5000 bars).
How To Use
The indicator can be used to get supports and resistances and is more so closer to a drawing tool due to its limitations. The lines not updating with the arrival of new bars have the advantage of providing fixed supports/resistances.
The Slope setting allows the user to control the angle and direction of the lines. Using a Slope of 1 will return lines with the same slope as the one of a linear regression fit from the farthest pivot point displayed by the indicator to the most recent bar.
The chart above shows the indicators and a linear regression in orange.
If you want to have horizontal lines, use a Slope equal to 0.
Finally using a negative slope value will allow the user to have lines in opposite directions to the main trend.
Conclusion
We hope you like this indicator (drawing tool) and find it useful for drawing your support & resistances in a unique way!

PRIME - ShadoW ZoneZ with RSI LevelsIn This experimental study, we've taken RSI data, Volume Profile, and Trend analysis, combining them into one unique package that will allow a trader to analyze market trend lines and their proposed channels, trend momentum through candle color augmentation similar to "Pulse", and Visible Volume index price levels on chart for the current sequence. Below are explanations of each function within the system.
The Semafor is used to spot future multi-level Supports and Resistance zones.
It is also useful to spot HL or LL or HH or LH zones at different Depth settings.
The red zones are the extreme places where the market has a higher chance of reversing while the green zones have the lowest setting with lower chances of the market reversal
Automatic Trend Lines
The indicator takes in 2 timeframes to detect High and Low values from which to draw the trend lines of each timeframe.
As the values change with price movement, the lines are updated. They are color coded for uptrend and downtrend based on the direction of each individual line. Trend lines can be set up to color with only the default value on the configurations panel.
- Toggle on/off Color Coded
- Change Default, Uptrend, Downtrend color
- Change Line Width
- Change Line Style
- Toggle on/off Line Extensions
- Change Extended Line Width
- Change Extended Line Style
- Toggle On/Off labels for 7 data points of each timeframe
Automatic Trend Sights
This is a neat feature that may help you get a better feel for the direction the current movement is heading towards in correlation with the short or medium length timeframe trends. The sight draws a line from the middle vertical point of the trend coordinates towards the current price. They are toggled off by default but can be enabled in the configurations panel.
- Toggle on/off sight on each timeframe
- Change Width
- Change Line Style
Support & Resistance Levels, the main aim of the study. Level calculations are based on Relative Strength Index ( RSI ) threshold levels of oversold/overbought and bull/bear zones, where all threshold values are customizable through the user dialog box. Background of the levels can be colored optionally.
RSI Weighted Colored Bars and/or Mark Overbought/Oversold Bars , Bar colors can be painted to better emphasis RSI values. Darker colors when the oscillator is in oversold/overbought zones, light colors when oscillator readings are below/above the bull/bear zone respectively, and remain unchanged otherwise. Besides the colors, with “Display RSI Overbought/Oversold Price Bars” option little triangle shapes can be plotted on top or bottom of the bars when RSI is in oversold/overbought zones .
Disclaimer:
Trading success is all about following your trading strategy and the indicators should fit within your trading strategy, and not to be traded upon solely
The script is for informational and educational purposes only. Use of the script does not constitute professional and/or financial advice. You alone have the sole responsibility of evaluating the script output and risks associated with the use of the script. In exchange for using the script, you agree not to hold dgtrd TradingView user liable for any possible claim for damages arising from any decision you make based on use of the script

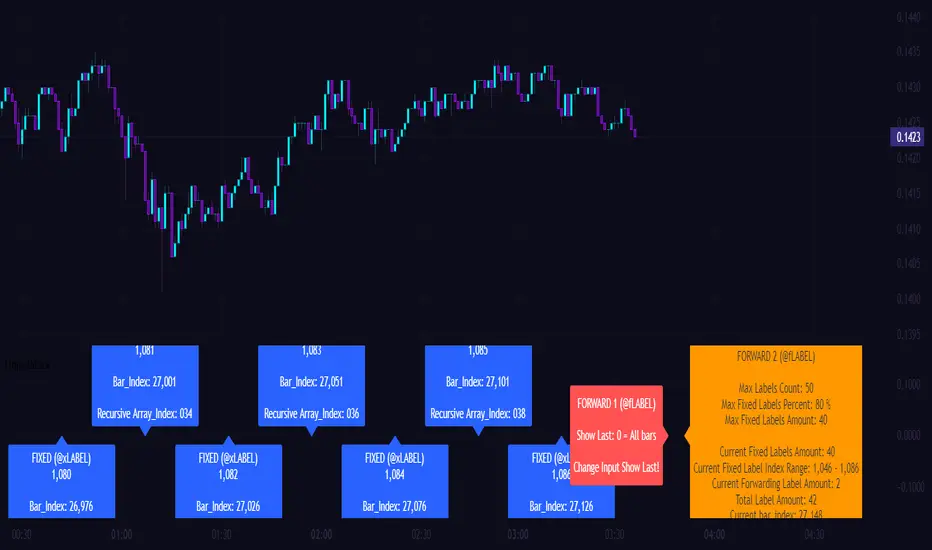
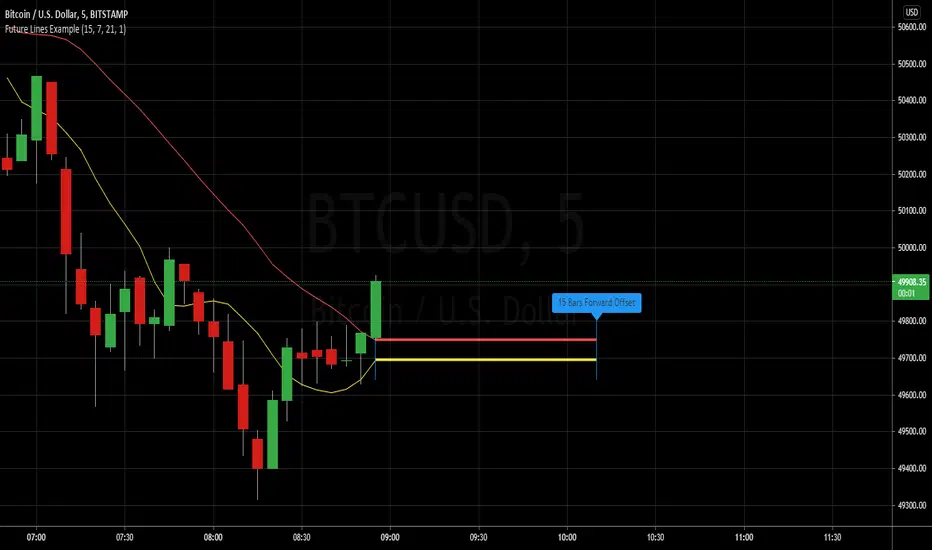
Example - Future Line DrawingExample primarily focuses on:
• creating a simple function to get a time offset value
• using the offset to set drawing locations in the future
• how to properly set up and manipulate line positions
Extras ( end of script ):
• inclusion of vertical lines for visualising start and end points using the time offsets
• inclusion of label to read out the current time offset forwards/backwards
This script publication is intended for:
• Educational Purposes
Who is it for?
• anyone who wants to learn the basics of drawing using 'time' for purposes of positioning
Donchian Zig-Zag [LuxAlgo]The following indicator returns a line bouncing of the extremities of a Donchian channel, with the aim of replicating a "zig-zag" indicator. The indicator can both be lagging or lagging depending on the settings user uses.
Various extended lines are displayed in order to see if the peaks and troughs made by the Donchian zig-zag can act as potential support/resistance lines.
User Settings
Length : Period of the Donchian channel indicator, higher values will return fewer changes of directions from the zig-zag line
Bounce Speed : Determine the speed of bounces made by the zig-zag line, with higher values making the zig-zag line converge faster toward the extremities of the Donchian channel.
Gradient : Determine whether to use a gradient to color the area between each Donchian channel extremities, "On" by default.
Transparency : Transparency of the area between each Donchian channel extremities.
Usage
It is clear that this is not a very common indicator to see, as such usages can be limited and very hypothetical. Nonetheless, when a bounce speed value of 1 is used, the zig-zag line will have the tendency to lag behind the price, and as such can provides crosses with the prices which can provide potential entries.
The advantage of this approach against most indicators relying on crosses with the price is that the linear nature of the indicator allows avoiding retracements, thus potentially holding a position for the entirety of the trend.
Altho this indicator would not necessarily be the most adapted to this kind of usage.
When using a bounce speed superior to 1, we can see the predictive aspects of the indicator:
We can link the peaks/troughs made by the zig-zag with the precedent ones made to get potential support and resistance lines, while such a method is not necessarily accurate it still allows for an additional to interpret the indicator.
Conclusions
We presented an indicator aiming to replicate the behaviour of a zig-zag indicator. While somehow experimental, it has the benefits of being innovative and might inspire users in one way or another.

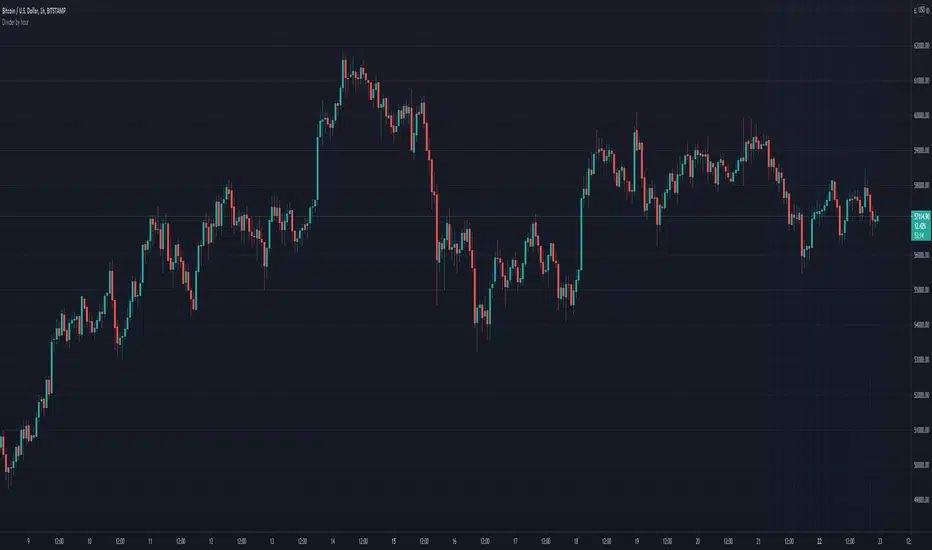
Divider by hourHi,
This script will draw divider lines by the hours of current day so that you can have a better view as your desire.
Analog/Digital World Clock by DGTWorld Clocks - something for fun
Happy New Year!
ps: in case no update on the charts then the clock will not update too and will lag or stop till a new update is received

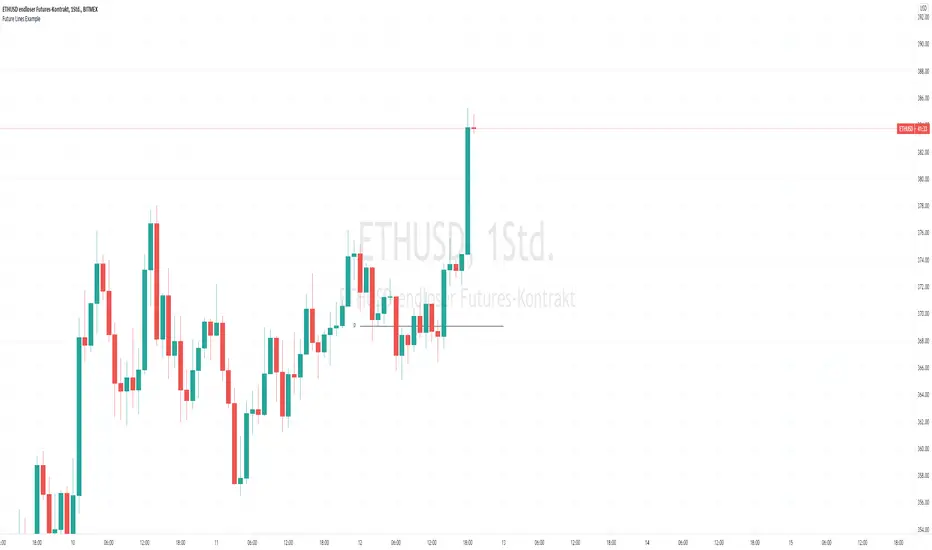
Future Line Example for study PivotPoint I know a lot of people who want to draw a line in future. I asked a lot of good Guys in Pine and they havent a solution. But today i got an idea i want to share with you. I hope this example give you a hint.
it is Usefull if you want to draw it like the Orginal Pivot Point standart or everything else.
I see a lot of Pivot Indicators but all stop at the actual Candle or extended right 100+ Years
Have Fun :)