Real-Fast Fourier Transform of Price w/ Linear Regression [Loxx]Real-Fast Fourier Transform of Price w/ Linear Regression is a indicator that implements a Real-Fast Fourier Transform on Price and modifies the output by a measure of Linear Regression. The solid line is the Linear Regression Trend of the windowed data, The green/red line is the Real FFT of price.
What is the Discrete Fourier Transform?
In mathematics, the discrete Fourier transform (DFT) converts a finite sequence of equally-spaced samples of a function into a same-length sequence of equally-spaced samples of the discrete-time Fourier transform (DTFT), which is a complex-valued function of frequency. The interval at which the DTFT is sampled is the reciprocal of the duration of the input sequence. An inverse DFT is a Fourier series, using the DTFT samples as coefficients of complex sinusoids at the corresponding DTFT frequencies. It has the same sample-values as the original input sequence. The DFT is therefore said to be a frequency domain representation of the original input sequence. If the original sequence spans all the non-zero values of a function, its DTFT is continuous (and periodic), and the DFT provides discrete samples of one cycle. If the original sequence is one cycle of a periodic function, the DFT provides all the non-zero values of one DTFT cycle.
What is the Complex Fast Fourier Transform?
The complex Fast Fourier Transform algorithm transforms N real or complex numbers into another N complex numbers. The complex FFT transforms a real or complex signal x in the time domain into a complex two-sided spectrum X in the frequency domain. You must remember that zero frequency corresponds to n = 0, positive frequencies 0 < f < f_c correspond to values 1 ≤ n ≤ N/2 −1, while negative frequencies −fc < f < 0 correspond to N/2 +1 ≤ n ≤ N −1. The value n = N/2 corresponds to both f = f_c and f = −f_c. f_c is the critical or Nyquist frequency with f_c = 1/(2*T) or half the sampling frequency. The first harmonic X corresponds to the frequency 1/(N*T).
The complex FFT requires the list of values (resolution, or N) to be a power 2. If the input size if not a power of 2, then the input data will be padded with zeros to fit the size of the closest power of 2 upward.
What is Real-Fast Fourier Transform?
Has conditions similar to the complex Fast Fourier Transform value, except that the input data must be purely real. If the time series data has the basic type complex64, only the real parts of the complex numbers are used for the calculation. The imaginary parts are silently discarded.
Inputs:
src = source price
uselreg = whether you wish to modify output with linear regression calculation
Windowin = windowing period, restricted to powers of 2: "4", "8", "16", "32", "64", "128", "256", "512", "1024", "2048"
Treshold = to modified power output to fine tune signal
dtrendper = adjust regression calculation
barsback = move window backward from bar 0
mutebars = mute bar coloring for the range
Further reading:
Real-valued Fast Fourier Transform Algorithms IEEE Transactions on Acoustics, Speech, and Signal Processing, June 1987
Related indicators utilizing Fourier Transform
Fourier Extrapolator of Variety RSI w/ Bollinger Bands
Fourier Extrapolation of Variety Moving Averages
Fourier Extrapolator of Price w/ Projection Forecast
Regresi Linier / Linear Regression

Cycle-Period Adaptive, Linear Regression Slope Oscillator [Loxx]Cycle-Period Adaptive, Linear Regression Slope Oscillator is an osciallator that solves for the Linear Regression slope and turns it into an oscillator. This is a very simple calculation and uses one of Ehler's first implementations of his cycle period calculations. The output slope value is smoothed after calculation and before being drawn. This is a sort of momentum indicator and has a rich history with Forex traders around the world.
What is the Cycle Period?
The spectral content of the data are measured in a bank of contiguous filters as described in "Measuring Cycle Periods" in the March 2008 issue of Stocks & Commodities Magazine. The filter having the strongest output is selected as the current dominant cycle period. The cycle period is measured as the number of bars contained in one full cycle period.
What is Linear Regression?
In statistics, linear regression is a linear approach for modeling the relationship between a scalar response and one or more explanatory variables. The case of one explanatory variable is called simple linear regression; for more than one, the process is called multiple linear regression.
Included:
Bar coloring
2 signal types
Alerts
Loxx's Expanded Source Types
Loxx's Moving Averages

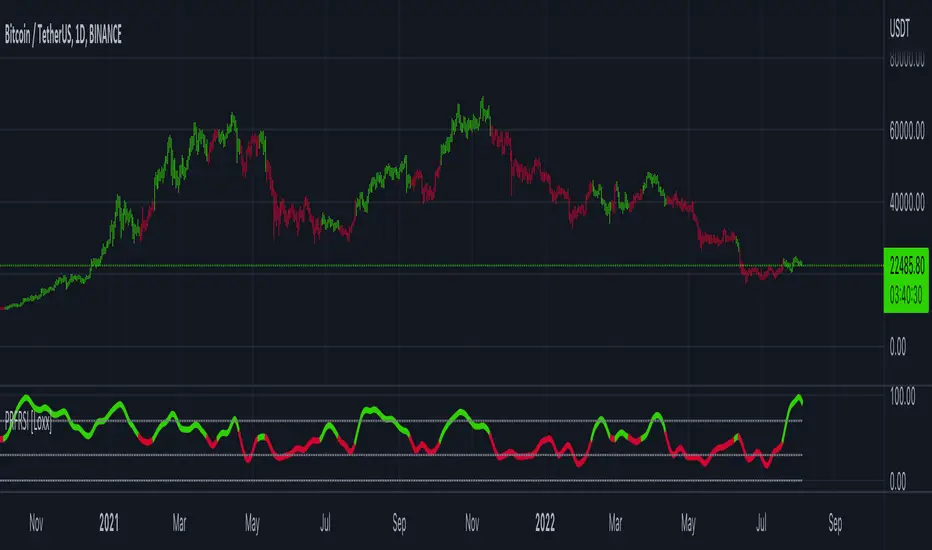
Polynomial-Regression-Fitted RSI [Loxx]Polynomial-Regression-Fitted RSI is an RSI indicator that is calculated using Polynomial Regression Analysis. For this one, we're just smoothing the signal this time. And we're using an odd moving average to do so: the Sine Weighted Moving Average. The Sine Weighted Moving Average assigns the most weight at the middle of the data set. It does this by weighting from the first half of a Sine Wave Cycle and the most weighting is given to the data in the middle of that data set. The Sine WMA closely resembles the TMA (Triangular Moving Average). So we're trying to tease out some cycle information here as well, however, you can change this MA to whatever soothing method you wish. I may come back to this one and remove the point modifier and then add preliminary smoothing, but for now, just the signal gets the smoothing treatment.
What is Polynomial Regression?
In statistics, polynomial regression is a form of regression analysis in which the relationship between the independent variable x and the dependent variable y is modeled as an nth degree polynomial in x. Polynomial regression fits a nonlinear relationship between the value of x and the corresponding conditional mean of y, denoted E(y |x). Although polynomial regression fits a nonlinear model to the data, as a statistical estimation problem it is linear, in the sense that the regression function E(y | x) is linear in the unknown parameters that are estimated from the data. For this reason, polynomial regression is considered to be a special case of multiple linear regression .
Included
Alerts
Signals
Bar coloring
Loxx's Expanded Source Types
Loxx's Moving Averages
Other indicators in this series using Polynomial Regression Analysis.
Poly Cycle
PA-Adaptive Polynomial Regression Fitted Moving Average
Polynomial-Regression-Fitted Oscillator
Polynomial-Regression-Fitted Oscillator [Loxx]Polynomial-Regression-Fitted Oscillator is an oscillator that is calculated using Polynomial Regression Analysis. This is an extremely accurate and processor intensive oscillator.
What is Polynomial Regression?
In statistics, polynomial regression is a form of regression analysis in which the relationship between the independent variable x and the dependent variable y is modeled as an nth degree polynomial in x. Polynomial regression fits a nonlinear relationship between the value of x and the corresponding conditional mean of y, denoted E(y |x). Although polynomial regression fits a nonlinear model to the data, as a statistical estimation problem it is linear, in the sense that the regression function E(y | x) is linear in the unknown parameters that are estimated from the data. For this reason, polynomial regression is considered to be a special case of multiple linear regression .
Things to know
You can select from 33 source types
The source is smoothed before being injected into the Polynomial fitting algorithm, there are 35+ moving averages to choose from for smoothing
This indicator is very processor heavy. so it will take some time load on the chart. Ideally the period input should allow for values from 1 to 200 or more, but due to processing restraints on Trading View, the max value is 80.
Included
Alerts
Signals
Bar coloring
Other indicators in this series using Polynomial Regression Analysis.
Poly Cycle
PA-Adaptive Polynomial Regression Fitted Moving Average

RSI Divergence Scanner by zdmreDivergence is when the price of an asset is moving in the opposite direction of a technical indicator, such as an oscillator, or is moving contrary to other data. Divergence warns that the current price trend may be weakening, and in some cases may lead to the price changing direction.
If the stock is rising and making new highs, ideally the RSI is reaching new highs as well. If the stock is making new highs, but the RSI starts making lower highs, this warns the price uptrend may be weakening. This is negative divergence.
Positive divergence is the opposite situation. Imagine the price of a stock is making new lows while the RSI makes higher lows with each swing in the stock price. Investors may conclude that the lower lows in the stock price are losing their downward momentum and a trend reversal may soon follow.
Divergence is one of the common uses of many technical indicators, primarily the oscillators.
Use it at your own risk

Everything Bitcoin [Kioseff Trading]Hello!
This script retrieves most of the available Bitcoin data published by Quandl; the script utilizes the new request.security_lower_tf() function.
Included statistics,
True price
Volume
Difficulty
My Wallet # Of Users
Average Block Size
api.blockchain size
Median Transaction Confirmation Time
Miners' Revenue
Hash Rate
Cost Per Transaction
Cost % of Transaction Volume
Estimated Transaction Volume USD
Total Output Volume
Number Of Transactions Per Block
# of Unique BTC Addresses
# of BTC Transactions Excluding Popular Addresses
Total Number of Transactions
Daily # of Transactions
Total Transaction Fees USD
Market Cap
Total BTC
Retrieved data can be plotted as line graphs; however, the data is initially split between two tables.
The image above shows how the requested Bitcoin data is displayed.
However, in the user inputs tab, you can modify how the data is displayed.
For instance, you can append the data displayed in the floating statistics box to the stagnant statistics box.
The image above exemplifies the instance.
You can hide any and all data via the user inputs tab.
In addition to data publishing, the script retrieves lower timeframe price/volume/indicator data, to which the values of the requested data are appended to center-right table.
The image above shows the script retrieving one-minute bar data.
Up arrows reflect an increase in the more recent value, relative to the immediately preceding value.
Down arrows reflect a decrease in the more recent value relative to the immediately preceding value.
The ascending minute column reflects the number of minutes/hours (ago) the displayed value occurred.
For instance, 15 minutes means the displayed value occurred 15 minutes prior to the current time (value).
Volume, price, and indicator data can be retrieved on lower timeframe charts ranging from 1 minute to 1440 minutes.
The image above shows retrieved 5-minute volume data.
Several built-in indicators are included, to which lower timeframe values can be retrieved.
The image above shows LTF VWAP data. Also distinguished are increases/decreases for sequential values.
The image above shows a dynamic regression channel. The channel terminates and resets each fiscal quarter. Previous channels remain on the chart.
Lastly, you can plot any of the requested data.
The new request.security_lower_tf() function is immensely advantageous - be sure to try it in your scripts!

Infiten's Regressive Trend Channel An experiment using Pinescript's candle plotting feature. This indicator performs a linear regression on the lows, highs, and moving average, and plots them all in the form of a candlestick. If the close is below the prediction, the candlestick is red, if the close is above the regression, the candlestick is green. Effective and aesthetic way to analyze trends.

SMI MTF 4-Colored MAs (jkf)Four linear moving averages of varying frequency. Reading the moving averages is an art. If looking at a Daily price chart (for example):
For bullish trades, I like to see the yellow (longest term) moving average moving higher, but timing can be improved by respecting the shorter term lines, especially the black (shortest term).
For further support of your hypothesis, switch the frequency to Weekly, and validate that is supportive as well.
Warning: "Lookahead" is set to on, so large price swings can alter prior day readings.

Linear Regression CloudClouds based on Linear Regression Band.
A cloud forms if the linear regression channel is fully on one side of the channel on higher time frames.
The cloud represents the gap between the upper/lower channel and the baseline on the higher time frame.
The higher time frames have 2x, 4x and 8x the length.

Trend Line RegressionThis is a fast trend line regressor based on least squares regression.
(1) Supports setting regression from the Nth candle
(2) Supports the minimum and maximum regression candle interval length
(3) Supports finding the optimal regression region based on the length step among the minimum and maximum regression region lengths
(4) Supports displaying the optimal regression level
(5) The size of the regression region is 0.5 times the standard deviation by default
(6) You can filter the trend line by setting minimum trend line regression level
(6) Please properly set the parameters to avoid calculation timeout
Enjoy!
这是一个基于最小二乘法回归的快速趋势线回归
(1) 支持从第N根蜡烛开始设置回归
(2) 支持最小和最大的回归蜡烛区间长度
(3) 支持在最小和最大回归区间长度的基础上寻找最佳回归区域
(4) 支持显示最佳回归水平
(5) 回归区域的大小默认为标准差的0.5倍
(6) 可以通过设置最小趋势线回归等级来过滤趋势线
(6) 请正确设置参数以避免计算超时
使用愉快!

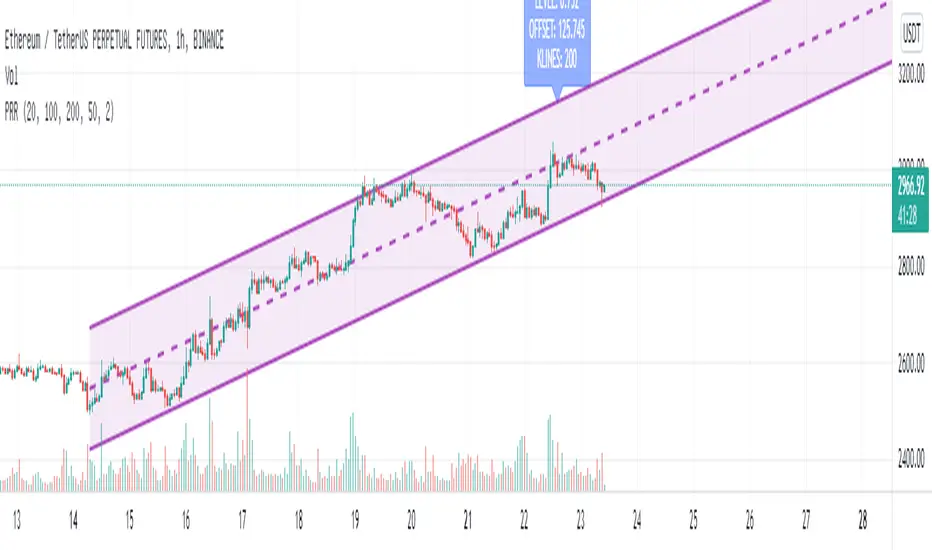
Price Region RegressionThis is an optimized price range regressor based on least squares regression.
(1) Supports setting regression from the Nth candle
(2) Supports the minimum and maximum regression candle interval length
(3) Supports finding the optimal regression region based on the length step among the minimum and maximum regression region lengths
(4) Supports displaying the optimal regression level
(5) The size of the regression region is two times the standard deviation by default
这是一个基于最小二乘回归的价格区间回归指标
(1) 支持设置从第N个蜡烛开始回归
(2) 支持最小和最大回归蜡烛的区间长度
(3) 在最小和最大回归区间长度中,根据长度步进寻找最优的回归区间
(4) 支持显示最优回归等级
(5) 回归区间的大小默认为2倍标准差
[_ParkF]Linreg & Trendlines* The script has been uploaded again.
Linear regression and trendline not only facilitate trend identification,
but also identify support and resistance within it,
and linear regression and trendline departure can detect trend changes, which are useful in trading.
Linear regression and trend lines are shown in the chart.
It offers a variety of options, length, color, thickness, on/off switch, etc.
I hope it will help you with your trading.
hope you become rich!
---------------------------------------------------------------------------------------------------------------------------
* 스크립트가 다시 업로드 되었습니다.
선형 회귀(채널) 및 추세선은 추세 식별을 용이하게 할 뿐만 아니라,
또한 그 안에서 지지와 저항을 식별하고,
선형 회귀(채널) 및 추세선 이탈은 거래에 유용한 추세 변화를 감지할 수 있습니다.
선형 회귀(채널) 및 추세선이 차트에 표시됩니다.
길이, 색상, 두께, 온/오프 스위치 등 다양한 옵션을 제공합니다.
거래에 도움이 되셨으면 합니다.
부자되세요!
---------------------------------------------------------------------------------------------------------------------------
* I would like to express my gratitude to zdmre for revealing the linear regression source.

[_ParkF]MFI+Added the Moneyflow Index indicator.
Divergence signals and diversion lines are drawn.
Support and resistance were also confirmed when linear regression and trend lines were used for the Moneyflow Index.
Two linear regression and two trend lines are drawn.
Because the two linear regression values are different, you can see the support and resistance of long-term and short-term linear regression.
Since the periodic values of the two trend lines are also different, support and resistance that could not be identified in linear regression can be identified.
Each linear regression line and trend line can be turned on or off.
In addition, each linear regression line and trend line can arbitrarily modify period values and deviation values.
I hope it will help you trade.
-------------------------------------------------------------------------------------------------------------------------------------------------------------------------------------------
머니플로우인덱스 지표를 추가하였습니다.
다이버전스 신호와 다이버전스 라인이 그려집니다.
머니플로우인덱스에도 선형회귀와 추세선을 이용했을 때 지지와 저항이 확인이 되었습니다.
2개의 선형회귀와 2개의 추세선이 그려지고
두 선형 회귀 값은 서로 다르기 때문에 장기 및 단기 선형 회귀의 지지 및 저항을 확인할 수 있습니다.
두 추세선의 주기 값도 다르므로 선형 회귀 분석에서 확인할 수 없었던 지지 및 저항을 확인할 수 있습니다.
각 선형 회귀선 및 추세선은 켜거나 끌 수 있습니다.
또한 각 선형 회귀선 및 추세선은 주기 값과 편차 값을 임의로 수정할 수 있습니다.
당신의 트레이딩에 도움이 되었으면 합니다.
-------------------------------------------------------------------------------------------------------------------------------------------------------------------------------------------
* I would like to express my gratitude to zdmre for revealing the linear regression source.
* I would like to express my gratitude to aaahopper for revealing the trendlines source.
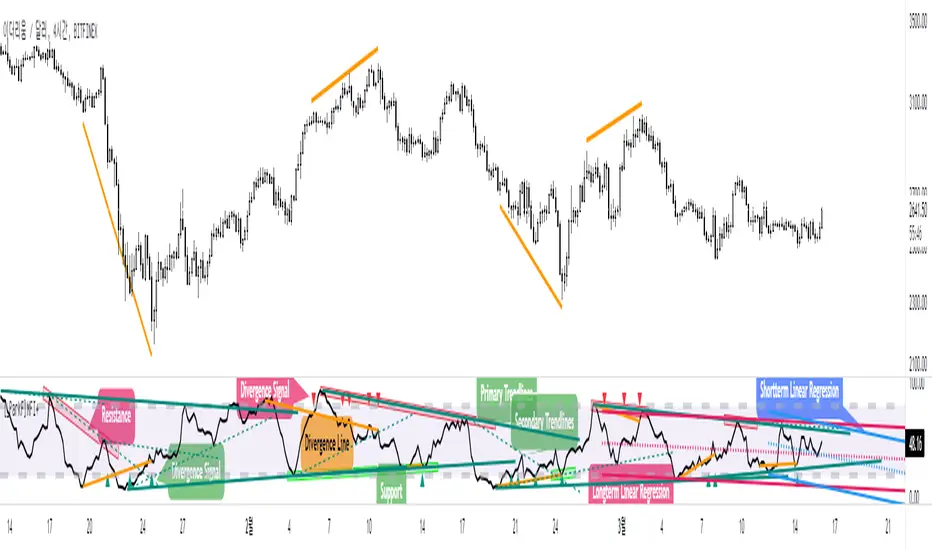
[_ParkF]RSI+RSI ----- UPGRADE ----> RSI+
-------------------------------------------------------------------------------------------------------------------------------------------------------------------------------------------
The RSI index has been upgraded.
The display function of RSI Candle, RSI Line, Divergence, and Divergence Line, which were previous functions, has been maintained.
As an upgrade, two linear regression and two trend lines are drawn.
Since the two linear regression values are different, support and resistance of long-term and short-term linear regression can be confirmed.
The two trend lines also have different period values, so it is possible to check support and resistance that could not be confirmed in linear regression.
Each linear regression and trend line can be turned on and off.
In addition, each linear regression and trend line can arbitrarily modify period values and deviation values.
Log charts and linear chart switches have been added to the trend line.
I hope it will help you with your trading.
-------------------------------------------------------------------------------------------------------------------------------------------------------------------------------------------
RSI 인덱스가 업그레이드되었습니다.
기존 기능이었던 캔들, 라인, 다이버전스, 다이버전스 라인의 디스플레이 기능은 그대로 유지됐다.
업그레이드로 두 개의 선형 회귀 분석과 두 개의 추세선이 그려집니다.
두 선형 회귀 값은 서로 다르기 때문에 장기 및 단기 선형 회귀의 지지 및 저항을 확인할 수 있습니다.
두 추세선의 주기 값도 다르므로 선형 회귀 분석에서 확인할 수 없었던 지지 및 저항을 확인할 수 있습니다.
각 선형 회귀선 및 추세선은 켜거나 끌 수 있습니다.
또한 각 선형 회귀선 및 추세선은 주기 값과 편차 값을 임의로 수정할 수 있습니다.
로그 차트 및 선형 차트 스위치가 추세선에 추가되었습니다.
당신의 트레이딩에 도움이 되었으면 합니다.
* I would like to express my gratitude to zdmre for revealing the linear regression source.
* I would like to express my gratitude to aaahopper for revealing the trendlines source.

[_ParkF]RSI (+ichimoku cloud)RSI
Typical RSI indicators were plotted with candles and expressed wick to resemble a candle chart,
and linear regression was added to predict changes in force intensity,
which allowed us to confirm support and resistance within linear regression .
In addition, divergence signal was marked as an additional basis for the price fluctuation point due to support and resistance .
In other words,
if the diversity signal appears together when the rsi candle is supported and resisted within linear regression ,
this is the basis for predicting that it is a point of change in the existing trend.
Finally, the period value and standard deviation of linear regression can be arbitrarily modified and used.
I hope it will help you with your trading.
--------------------------------------------------------------------------------------------------------------------------------------------------------------
(+ichimoku cloud)
Clouds made of the preceding span 1 and the preceding span 2 of the balance table can predict the trend by displaying the current price balance ahead of the future.
In addition to the role of clouds in the above-described balance sheet, this indicator also shows the cloud band support and resistance of the current RSI value.
일반적인 RSI 지표를 캔들화 하였고 꼬리까지 포함하여 캔들 차트와 유사하게 표현 하고,
캔들화한 RSI 지표에 선형회귀(채널)를 추가 하여 RSI 지표 특유의 힘의 강도의 변화를 지지와 저항으로 확인할 수 있게 해봤습니다.
또한 다이버전스 신호를 추가하여 선형회귀(채널)로 인한 지지와 저항에 따른 가격 변동의 근거로 삼을 수 있습니다.
즉, 선형회귀(채널) 안에서 RSI 캔들이 지지와 저항을 받을 때 다이버전스 신호가 함께 나타난다면 이는 기존 추세의 변화 지점임을
예측해 볼 수 있는 근거가 됩니다.
마지막으로 선형회귀(채널)의 기간값과 표준편차는 임의로 수정하여 사용할 수 있습니다.
당신의 트레이딩에 도움이 되었으면 합니다.
--------------------------------------------------------------------------------------------------------------------------------------------------------------
(+일목균형표의 구름)
일목균형표의 선행스팬1과 선행스팬2로 만들어진 구름은 현재 가격의 균형을 미래에 선행하여 표시하여 추세를 예측해볼 수 있습니다.
본 지표에서는 위에서 설명한 일목균형표의 구름의 역할과 더불어 현 RSI 값의 구름대 지지, 저항 또한 확인해볼 수 있습니다.
* I would like to express my gratitude to zdmre for revealing the linear regression source.

[_ParkF]RSIRSI
Typical RSI indicators were plotted with candles and expressed wick to resemble a candle chart,
and linear regression was added to predict changes in force intensity,
which allowed us to confirm support and resistance within linear regression.
In addition, divergence signal was marked as an additional basis for the price fluctuation point due to support and resistance.
In other words,
if the diversity signal appears together when the rsi candle is supported and resisted within linear regression,
this is the basis for predicting that it is a point of change in the existing trend.
Finally, the period value and standard deviation of linear regression can be arbitrarily modified and used.
I hope it will help you with your trading.
일반적인 RSI 지표를 캔들화 하였고 꼬리까지 포함하여 캔들 차트와 유사하게 표현 하고,
캔들화한 RSI 지표에 선형회귀(채널)를 추가 하여 RSI 지표 특유의 힘의 강도의 변화를 지지와 저항으로 확인할 수 있게 해봤습니다.
또한 다이버전스 신호를 추가하여 선형회귀(채널)로 인한 지지와 저항에 따른 가격 변동의 근거로 삼을 수 있습니다.
즉, 선형회귀(채널) 안에서 RSI 캔들이 지지와 저항을 받을 때 다이버전스 신호가 함께 나타난다면 이는 기존 추세의 변화 지점임을
예측해 볼 수 있는 근거가 됩니다.
마지막으로 선형회귀(채널)의 기간값과 표준편차는 임의로 수정하여 사용할 수 있습니다.
당신의 트레이딩에 도움이 되었으면 합니다.
* I would like to express my gratitude to zdmre for revealing the linear regression source.

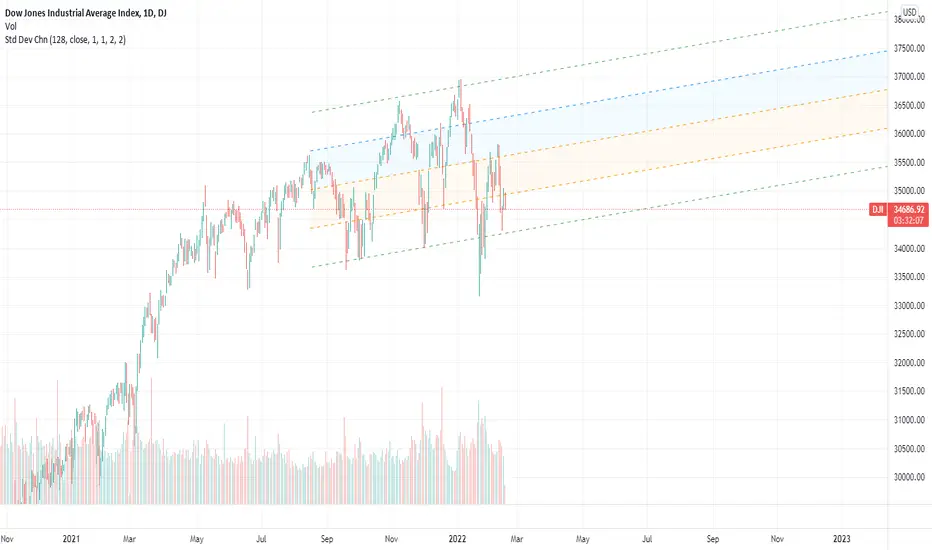
Standard Deviation ChannelThe standard deviation channel allows you to visually see the trend in the market using a linear regression calculation. This script has two lower and two upper bounds, with different deviations. Each of these boundaries has an alert when it has been breached.
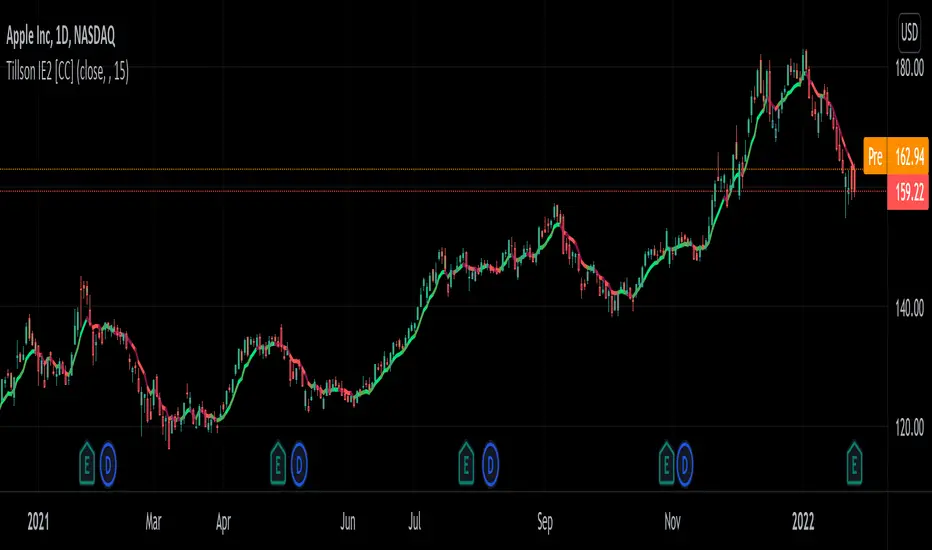
Tillson IE/2 [CC]The IE/2 was created by Tim Tillson (Stocks and Commodities Jan 1998) and this is a practically undiscovered gem because in that same article he goes on to to create the popular T3 moving average and the GDEma but practically no one seemed to notice the IE2 or maybe it is just my imagination. Anyway this indicator name is short for Integral of Linear Regression Slope + Endpoint Moving Average / 2 so you can why it was shortened to IE/2. Like the name implies this takes two variations of smoothing that complement each other and averages them together to in theory get the benefits of each. The EPMA is much noiser but follows the data more closely and the complete opposite for the ILRS so you can see the idea in action. Like all of my indicators I include strong buy and sell signals in addition to normal ones so strong signals are darker in color and normal signals are lighter in color. Buy when the line turns green and sell when it turns red.
Let me know if there are any other indicators or scripts you would like to see me publish!
Linear Regression Relative Strength[image/x/iZvwDWEY/
Relative Strength indicator comparing the current symbol to SPY (or any other benchmark). It may help to pick the right assets to complement the portfolio build around core ETFs such as SPY.
The general idea is to show if the current symbol outperforms or underperforms the benchmark (SPY by default) when bought some certain time ago. Relative performance is displayed as percent and is calculated for three different time ranges - short (1 mo by default), mid (1 quarter), and long (half a year). To smooth the volatility, the script uses linear regression to estimate the trend and takes the start and the end points of the linear regression line to compute the relative strength.
It is important to remember that the script shows the gain relative to SPY (or other selected benchmark), not the asset's gain. Therefore, it may indicate that the asset is profitable, but it still may lose value if SPY is in downtrend.
Therefore, it is crucial to check other indicators before making a decision. In the example above, standard linear regression for one quarter is used to indicate the direction of the trend.

Fusion: Trend and thresholdsThis is your basic single moving average but with a "slope" component. The idea here is that once a slope reaches a value great enough you should probably only trade with the trend so this indicator allows you to set that threshold separately for going long and short.
The indicator is designed to display on both the main chart and a separate chart area. If you want to display it on the main chart then the quick way is to just check the "On main chart" option and it will disable off main chart items and then just move it to the main chart.
There's half a dozen or so moving average types to select from so you will probably find one that suits you pretty well.
Once a threshold is reached you will get a signal showing the trend is strong enough where you probably should not trade in the opposite direction.
There is a "normalize" option which will fix the oscillator to a maximum of 100. The upside of this is that you can be more consistent in your settings of a threshold. The down side is that normalization happens over a predefined number of bars so it's a floating number, not an absolute number however I set the number of bars default to 3,000 so it should be pretty close to ideal. I haven't found a perfect way of getting a consistent maximum on the oscillator as a benchmark yet so if anyone has any ideas please contact me and I'll do an update. I may look into using percentage rank instead of normalization.
I like to see it as both an oscillator and on the main chart so I generally have two copies.
The settings are certainly not optimized so set to whatever suits your needs as my defaults will probably be wrong for you.
The code is structured to easily drop into a bigger system so use it as a lone indicator or add the code to some bigger project you are creating. If you do, send me a note, it would be nice to know it's being well used.
Finally, if you find value please do make a comment, give a thumbs up etc.
Enjoy and good luck!

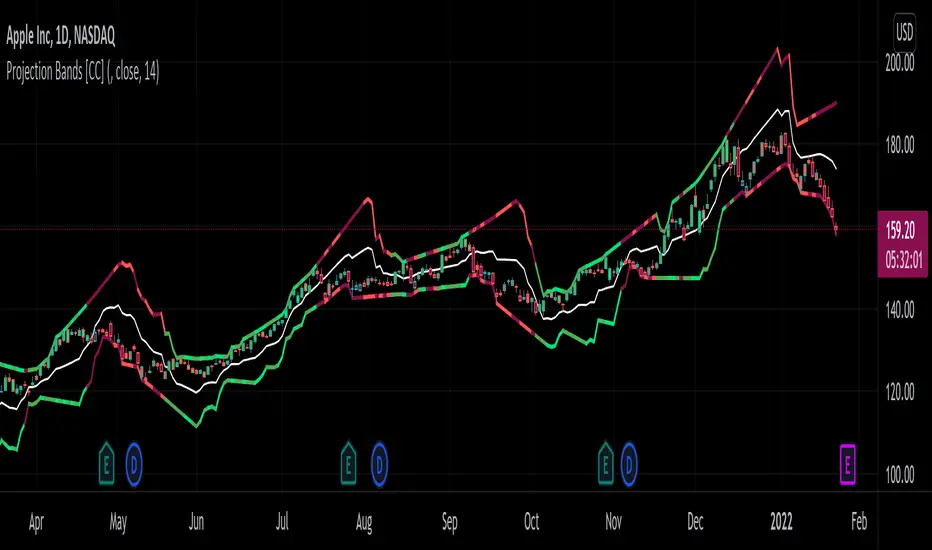
Projection Bands [CC]The Projection Bands were created by Mel Widner (Stocks and Commodities Jul 1995) and this indicator and the other two that rely on this one (I will publish them later) are very underappreciated in my humble opinion. The biggest strength of this indicator is the fact that it is a leading indicator for dramatic price movements. As you can see in my example chart it consistently gives great exit points before a downturn. I have included strong buy and sell signals in addition to normal ones so strong signals are darker in color and normal signals are lighter in color. Buy when the line turns green and sell when it turns red.
Let me know if there are any other indicators or scripts you would like to see me publish!
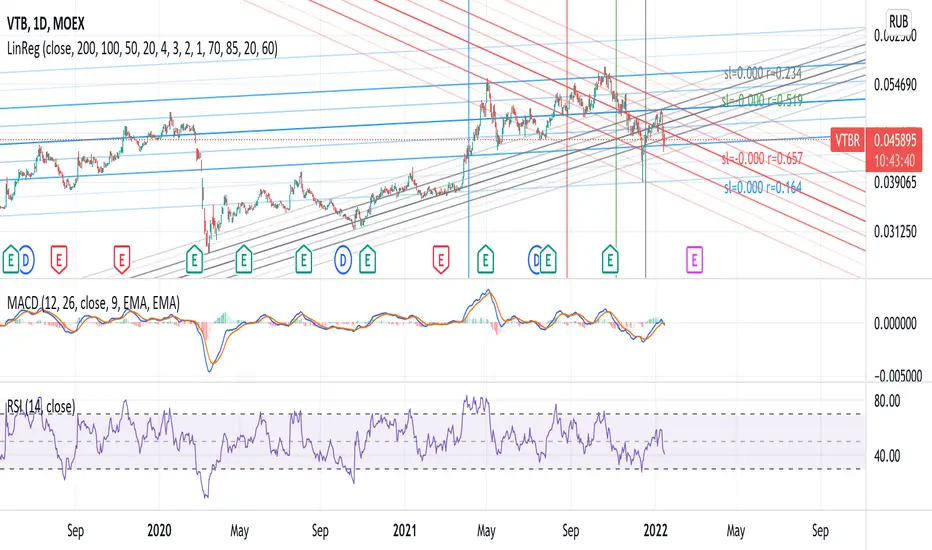
Linear Regression 200/100/50/20Four time frames in one indicator in different colors, showing current price trend in different scopes.
If the slope of the smaller time frame is in a (0,75;1,25) interval of some of the bigger ones the smaller one is omitted (different signs near zero are not coalesced in that way though).
Every time frame has four deltas of range in trend lines of different grade of transparency (2-1-4-3), as well as a vertical line denoting regression date range start, also bearing the same color (blue-red-green-gray for 200/100/50/20).
On the right of the latest bar are Pearson coefficients and slopes of the regressions, 200/100/50/20 bottom-up, also appropriately colored.
Linear Regression Histogram [LuxAlgo]This indicator is inspired by traditional statistical histograms. It will return the number of occurrences of price falling within each interval (bins) of the linear regression channel. This can be useful to highlight zones of interest within a trend.
Settings
Length: Number of recent closing prices used for the computation of the linear regression.
Bins Number: Number of intervals constructed from the linear regression channel.
Mult: Multiplicative factor for the RMSE. Controls the width of the linear regression channel.
Src: Input source of the indicator.
Usage
The indicator is constructed by dividing the linear regression channel range into a series of intervals (bins) of equal width. We then count the number of price values falling within each interval.
If a significant number of price values fall within a specific interval then that interval can highlight a potential zone of interest within a trend.
The zone of interest is highlighted in blue.
