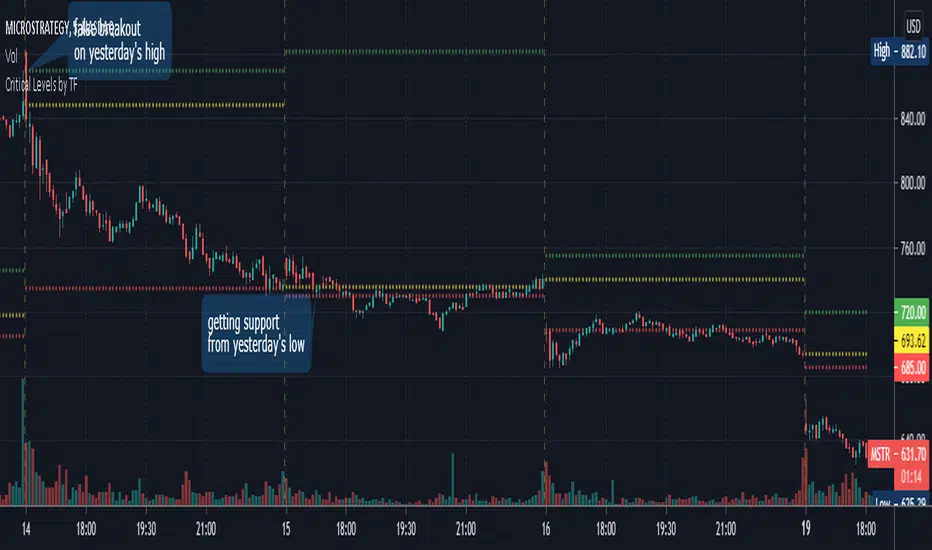
Critical Levels by Time FrameDescription
This indicator will help you present critical levels from a certain time frame.
Purpose and Usage
Many day traders are using the previous day high, close and low, as critical levels in their trading. in order to easily present those levels on your chart, I created this indicator in which you can define which of those you would like to present on your chart.
You may choose the best time frame for your needs, I suggest using the daily time frame which is also the default time frame, but you can use the weekly time frame to present the critical levels from the previous week, or you can choose any other time frame you would like.
Pre-market and after-market prices will not be taken into consideration.
Restrict to current DAY
There is an option to present the critical levels only today.
if you’re looking at a wide range of bars and don’t wanna present the critical levels among the entire chart, you may use this restriction to show a cleaner chart.
Filtering critical levels
To present only one or two critical levels (and not all three of them) you may use the style settings. uncheck any critical level that you’re not interested in.
I hope you enjoy this indicator and find it useful,
if you do, please like the script , and feel free to comment below.
Good luck with your trading.
Levels
donchain support&resistance levels [LM]Hello Traders,
I would like to introduce you donchain support&resistance levels. The idea is to look for important levels that are identified by donchain line, where donchain usualy spents a lot of time without any move usualy turns out to be good level for bounces.
Also note that when there is a big spread between first line and second line it usually leads to some pullback.
Here you have an example of big spread:
You are also able to show donchain lines and not only horizontals this you can find in settings:
Enjoy!

Chart Champions - Part 1 - nPOC - Levels - VWAPsThank you for sparing you time to read my indicator.
This indicator has been created as a suite of 3. This was to ensure that those with only the Free Trading View account could benefit (with their restriction to 3 indicators). Please ensure you install each indicator and read each indicator write up to fully understand what has tried to achieved.
Chart Champions – Part 1 –Lvls nPOC VWAPS
This indicator is broken down into:
• Levels
• VWAPS
• Naked Point of Control
Levels
It displays the levels to the right of the price Axis to enable the user to have a cleaner chart.
The below levels will automatically appear:
dOpen – pdHigh – pdLow – pdEQ – pwEQ
Optional Levels include:
mOpen – pmOpen – pdOpen – dbyOpen – wOpen – pwOpen
VWAPs
Optional VWAPs
Daily (including pdVWAP close) – Weekly – Monthly
Naked Points of Control (nPOC)
To view the nPOC move the chart back in time to pick up the nPOCs.
Chart Champions – Part 2 – CCV IBs POC
This indicator is broken down into:
• Chart Champions Value
• Initial Balance
• Points of Control
Chart Champions Value (CCV)
CCV is based on the 80% rule of the dOpen opening outside of the pdVAH/pdVAL. Please do you own research to fully understand how this trading strategy works (readily avaliable online).
Initial Balance (IB)
IB is based on the first 60 minutes of the market opening. It captures the highest and lowest points within that 60 minutes. Please do you own research to fully understand how this trading strategy works (readily avaliable online).
Points of Control (POCs)
POC are the price levels where the most volume was traded.
Developing POC (dPOC) will constantly move with volume/price action through out the day.
Optional POCs
Previous Day POC (pdPOC) – Day Before Yesterday POC (dbyPOC)
Chart Champions – Part 3 – Sessions - Manual Input
This indicator is broken down into:
• Manual Inputs (daily, weekly, monthly)
• IGOR SessionsTtimes
• Pre + Market Openings
Manual Input
Daily x3
Weekly x 3
Monthly x 3
This allows the trader to put in specific levels.
IGOR Session Times
This is a user specific requirement to highlight cetain times during the day, displayed at the bottom of the chart in the colour strip.
Pre + Market Openings
This allows the user to see when pre market trading has started and with the live maket has started, displayed at the top of the chart in colours.
A huge thank you goes out to:
Stackoverflow users AnyDozer and Bjorn.
TV user ahancock for allow me use of this code.
Disclaimer the lower the timeframe the more information it processes.

[SK] Fibonacci Auto Trend ScouterThe FATS - Fibonacci Auto Trend Scouter automatically draws active trends from 2 different timeframes along with Fibonacci Support and Resistance levels. It also has a Sights feature for each timeframe which points from it's middle towards the current price. The tool is also highly customizable for you to take this indicator over 9000. If you like the tool and it adds value to you - share the love on the like button and visit my profile to check out my other indicators and subscribe, so you're notified of my next scripts and ideas!
Automatic Trend Lines
The indicator takes in 2 timeframes to detect High and Low values from which to draw the trend lines of each timeframe.
As the values change with price movement, the lines are updated. They are color coded for uptrend and downtrend based on the direction of each individual line. Trend lines can be set up to color with only the default value on the configurations panel.
- Toggle on/off Color Coded
- Change Default, Uptrend, Downtrend color
- Change Line Width
- Change Line Style
- Toggle on/off Line Extensions
- Change Extended Line Width
- Change Extended Line Style
- Toggle On/Off labels for 7 data points of each timeframe
Automatic Trend Sights
This is a neat feature that may help you get a better feel for the direction the current movement is heading towards in correlation with the short or medium length timeframe trends. The sight draws a line from the middle vertical point of the trend coordinates towards the current price. They are toggled off by default but can be enabled in the configurations panel.
- Toggle on/off sight on each timeframe
- Change Width
- Change Line Style
Automatic Fibonacci Levels
The tool has a very useful feature to automatically detect the highest and lowest value from the short timeframe to calculate Fibonacci support and resistant levels. To keep the chart area clean, the lines are drawn short by default towards the right side of the price but provide inputs to increase the size of the level lines towards the left and right direction. A triangle label appears to the side of each line which holds the Fibonacci level and price data inside the tooltip, hover over them to activate.
- Toggle on/off color coded
- Change Default, Resistance, Support colors
- Change line size towards the left and right side
- Change line width
- Change Resistance line style
- Change Support line style
- Toggle on/off High and Low source line
- Toggle on/off High and Low source labels

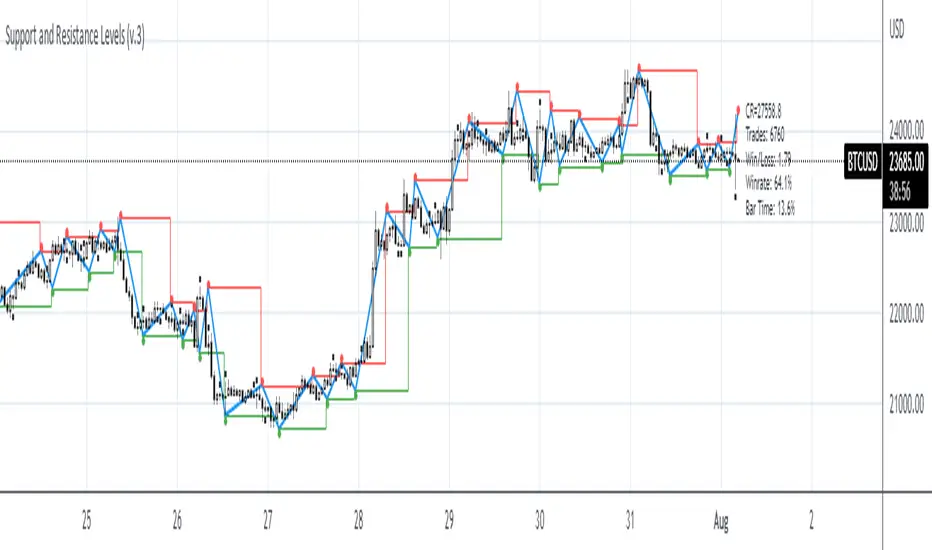
Support and Resistance Levels (v.3)Support and Resistance Levels augmanted and reprocessed
Description:
This is an augmented version of my earlier script that can be found here:
This time it features zigzag and channel lines, signal generation and filtering and performance testing. Signal generation and filtering procedures are used only for performance testing, not for the actual labelling. The labelling is governed by zigzag logic.
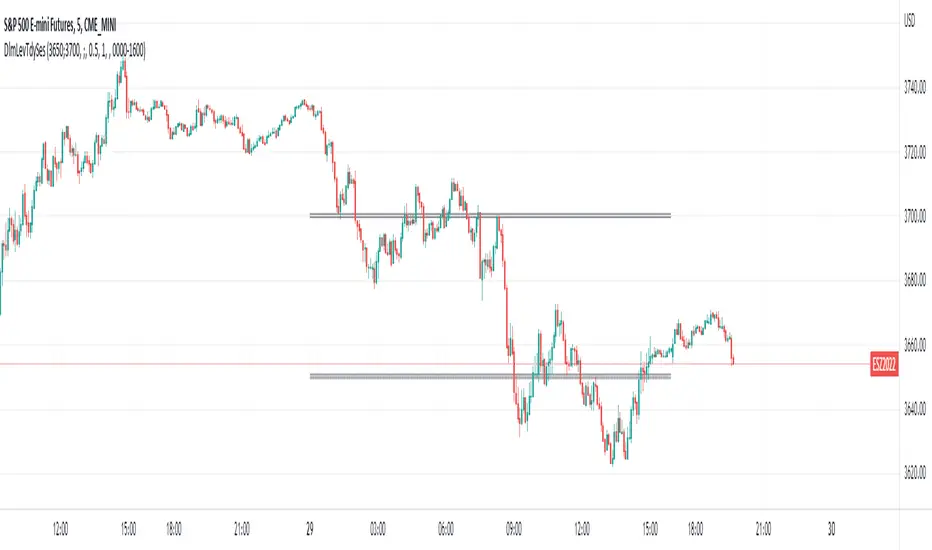
Delimited Levels Today SessionThis script takes a delimited string of level values (up to 12) and plots them on the chart as per parameters.
Alerts can be set up for crossing, etc, using the Alerts panel as per usual.
Very handy if you have a spreadsheet or list of values to plot.
For example, say your spreadsheet has a list of these 12 levels to plot:
3800
3811
3822
3837
3851
3862
3877
3887
3902
3913
3928
The values could be copied to notepad / text editor, and the line breaks replaced with a delimiter, such as the ';' character (note: no trailing delimiter), to produce a delimited string:
3800;3811;3822;3837;3851;3862;3877;3887;3902;3913;3928
And then simply copy / paste this delimited string into the "Levels Delimited String" parameter.
Note: This script builds upon earlier script:
Enhancements include:
- Plot only for latest day (weekends factored in)
- Plot only for specified session
- Plot as bands or as lines
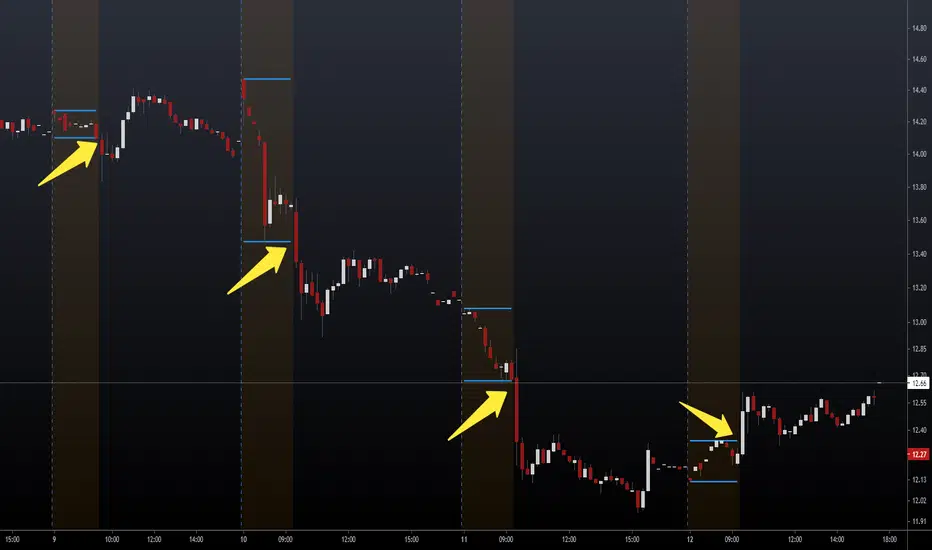
NSDT Pre-Market Breakout LevelsA simple way to identify potential breakouts at the New York market open. This indicator plots the high and low of the New York Pre-Market, providing a great visual of a potential breakout levels.
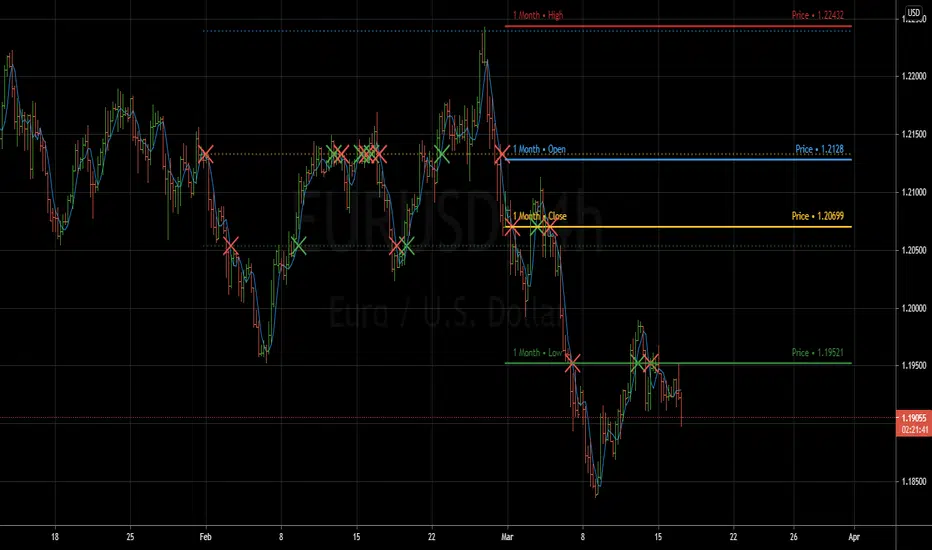
Previous Period Levels - X Alerts====== ABOUT THIS INDICATOR
- A simple but highly customisable display of previous higher time-frame
OHLC values, drawn using line.new and label.new. Nothing fancy but...
- Customised resolution input which excludes time frames lower than 1 hour
while extending the common higher reference inputs to include:
• 6, and 12 Hour
• 5 Day
• 3, and 6 Month
• 1 Year
- Alert conditions using an adjustable SMA to help reduce false positive
spam.
- Full visual customisation options for (almost) every aspect, so it can be
tuned to suit most individual preferences.
- In line with the miriad visual customisation options is the ability to
change the display format of the Labels, to show more or less information,
or disable them altogether.
====== REASON FOR STUDY
- To practice advanced user input option handling to allow for a full visual
customisation experience without stepping outside of, or interfering with,
the intended function of the indicator.
- Provide reasonably clear code commenting and structure in order to be
useful as a potential learning aid for others, and future reference for
myself.
====== DISCLAIMER
Any trade decisions you make are entirely your own responsibility.
I've made an effort to squash all the bugs, but you never know!
NSDT Daily Key LevelsSimple script to show key levels of current day and previous day. Labels can be turned on and off as needed. Line colors, thickness and style can be changed. Modified the "M/W/D Level" script from paaax. Credit for original code goes to him. Link to script and profile posted in code of this script.

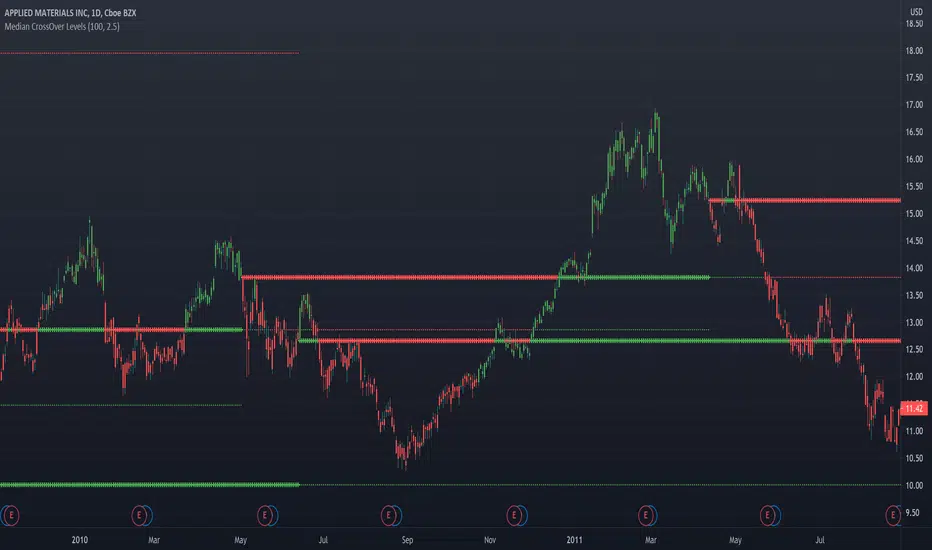
Median CrossOver LevelsPlots levels representing the prices that the stock closed above its n-period moving median(default=100).
2 thickest lines represents the two most recent crossover levels.
Candles are colored green if the price is currently above its moving median and red if below.
Previous OHLCThe scripts places horizontal levels on your charts indicating the previous Daily, Weekly or Monthly OHLC values over the current timeframe.
Slightly modified version of Nanda86's "Previous OHLC" script. I corrected a couple of bugs and added more control over colors and labels in general. I also removed the hourly OHLCs.

RK's 13 - Moving Average with Fibonacci Lines█ OVERVIEW
After some chart measures, I noticed that if we took the difference between fast and slow Moving Average lines and apply the Fibonacci ratios, we get a very reliable support and resistance level for each bar.
So, I made this script to help me (and anyone who wants to use it) know where we should close or put stops in our orders.
█ HOW TO USE IT:
Choose your preferred Moving Average type and Lengths;
Select the Fibonacci Ratios and test Reverse Lines option to get better levels.
Other useful input options:
Show Labels: Display every Fibonacci Ratio you are using;
Labels Offset Position: Place where the Fibonacci Ratio will appear and get the price in that position;
Project Moving Average Lines in the Future: Draws project Line in the chart.
Tips:
• If you put your mouse in the ratio label, it will show the price in that position
• This script works better when the lines are well apart.

[ST] S/R density study v3This algorithm draws supports/resistance levels automatically based on historic candle density at each height. The basic idea is the levels where price is rejected quickly is likely to have fewer candles in the past than the levels above and below. This does not take volume into account. The lookback and number of levels has to be kept low to prevent too many calculations. I haven't looked if there's new pinescript features to let me do this more efficiently yet.
It checks for candle density to decrease once or twice and then increase once or twice before it draws a line at that lowest level. There's an option to draw more lines by only checking for a single decrease and increase.
It likely won't catch all the levels but it seems to get a good amount to help me position stops on other side of S/R or exits on the trade side of S/R.
I've been meaning to share more scripts but keep forgetting. Keeping my scripts free but feel free to like or tip haha.

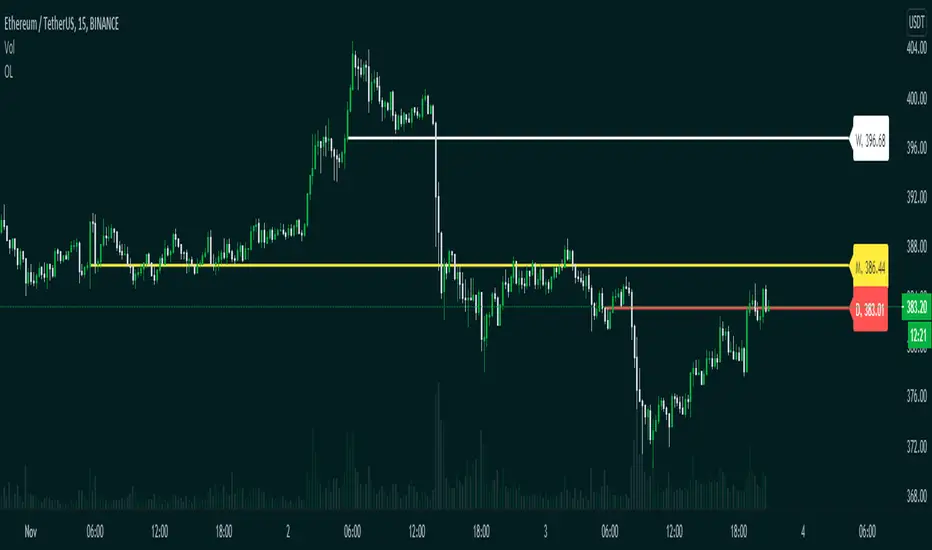
Opening LevelsOpening Levels is an indicator to draw lines on the opening prices of the current day, week, and month.
Inputs:
1. Line Width :- Opening Levels Line width, from 1 to 10
2. Right Offset :- Right offset from current bar, from 0 to 50
3. Line Style :- Select line styles from
4. Show Label :- Show or hide price labels
5. Day Level Color :- Current day opening level color
6. Week Level Color :- Current week opening level color
7. Month Level Color :- Current month opening level color
8. Day Label Text Color :- Current day label text color
9. Week Label Text Color :- Current Week label text color
10. Month Label Text Color :- Current month label text color
Happy trading.
BB Indicator - Marks High and low of premarket,daily,yesterdayThis indicator marks what is known as the BB system - Marks on your chart the premarket high and low, current intraday high and low and yesterday's high and low. For the style of the line you can only change the colour, if you make the line a different style it shouldn't show up because if it did it makes the lines ugly.
Pick and select which levels you would like using the indicator and you can also turn on and off the labels if you don't want them.

Support and Resistance Levels with Breaks [LuxAlgo]This script provides basic pivot point Support and Resistance Levels to the user whilst displaying Break signal tags. It also has the ability to let the user display more significant breaks by filtering using the Volume Oscillator.
Only more significant breaks of these basic levels are displayed to the user when optimized which avoids noise and messy signals.
It will also display breaks with candles it deems to be bullish (e.g. having a longer upper or lower wick).
Notation
The notation of "B" denotes a break of either a Support or Resistance level with a volume greater than the threshold.
The notation of "Bull or Bear Wick" denotes a bullish or bearish candle on the break.
Settings:
Left Bars - the number of bars left hand side of the pivot.
Right Bars - the number of bars right hand side of the pivot.
Volume Threshold - the threshold value (%) for the Volume Oscillator.
Usage & Details:
Knowing when a pivot S/R level is broken with significance can be of great help to a trader. Many times significant levels may not be broken with significant force and the move is therefore weaker and possibly not worth trading.

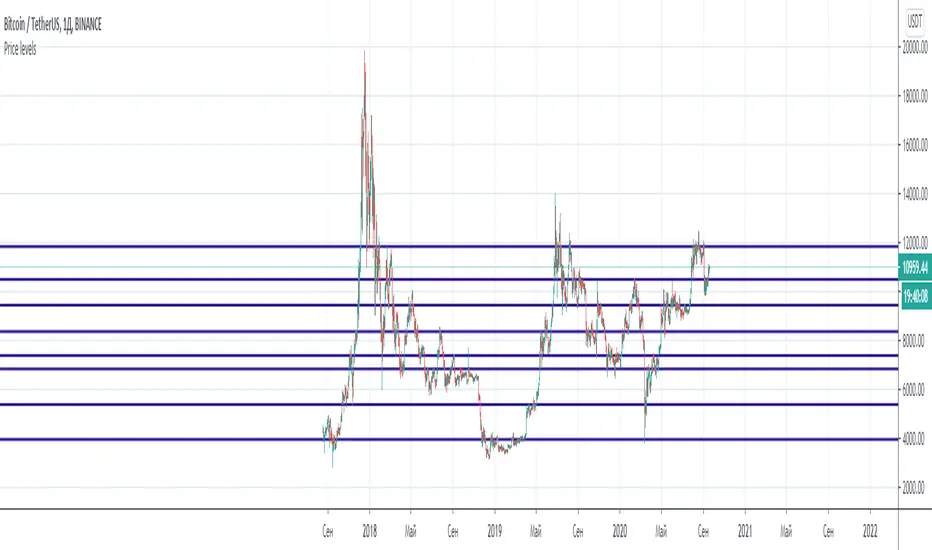
Price levelsThanks to the developers for adding arrays to TradingView. This gives you more freedom in Pine Script coding.
I have created an algorithm that draws support and resistance levels on a chart. The algorithm can be easily customized as you need.
This algorithm can help both intuitive and system traders. Intuitive traders just look at the drawn lines. For system traders, the "levels" array stores all level values. Thus, you can use these values for algorithmic trading.
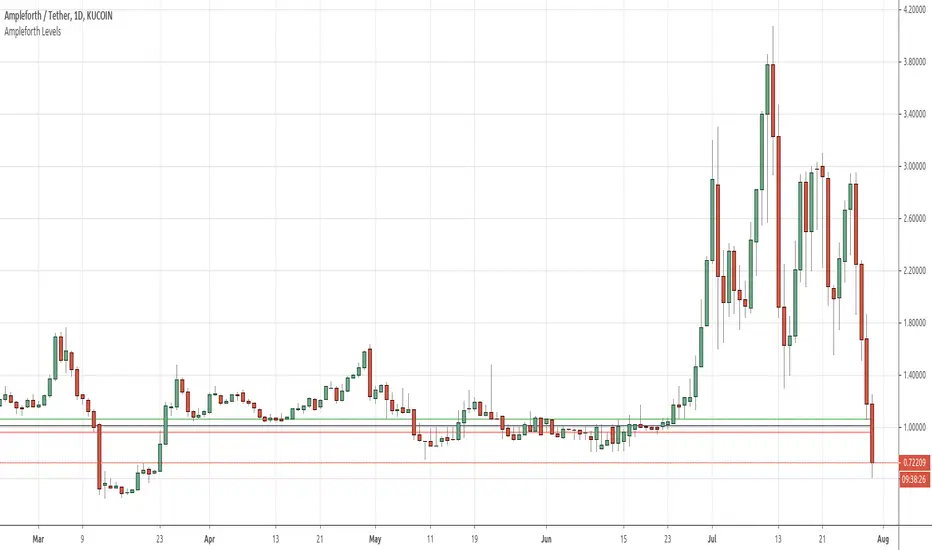
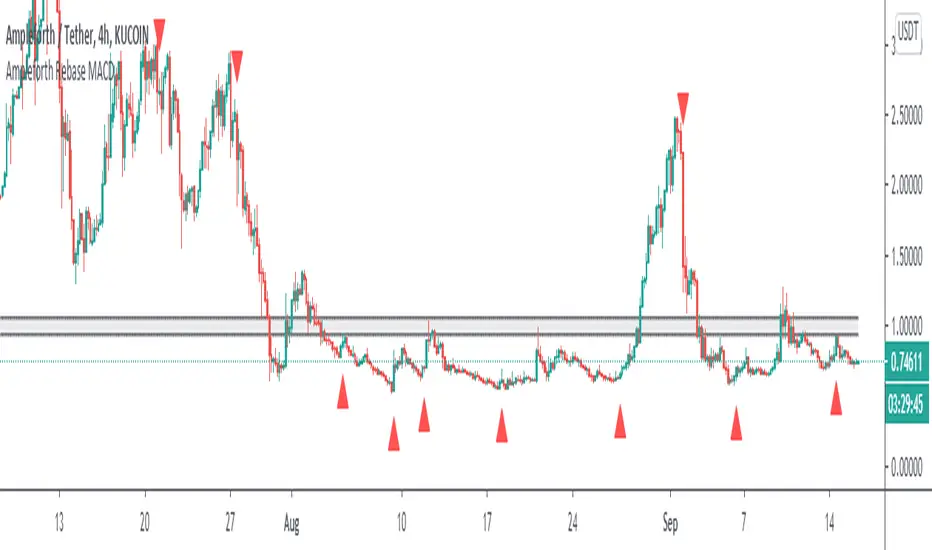
Ampleforth Rebase MACDThis script reveals Ampleforth rebase levels which are going to always work. In addition to that is MACD crossovers serving as potential buy/sell entries. You can set alerts for MACD crossovers and price entering balanced value area (0.96 - 1.06).
MACD signals can be used to automatically open a position and entering a balanced value area can be used as take-profit. Since the price will always move to this level, using this strategy without leverage should be profitable.
Ampleforth seems like a nice asset to trade since it is unlikely to correlate with anything else. At least not when it gets to the extreme levels.
SHARP PIVOTS (INTRADAY LEVELS) Hi friends,,
This indicator is based on modified fib levels.
Buy above 23.7% from recent low and sell below 72.7% from recent high.
15 mins close above or below the entry levels Recommended.
use Heiken Ashi candles for trend confirmation.
USE RSI 60/40(UNCONVENTIONAL) For additional conformation

ATR Daily LevelsPlots the daily ATR on the chart as upper and lower levels.
It can be use to adapt your trading in high and low periods of market volatility, determine reasonable target or take profit, entry at likely mean reversion, stop loss beyond normal flows etc...
More on the script behavior:
- Daily ATR upper/lower levels are applied on the current day low/high;
- The ATR value is defined by the last D1 bar;
- Shows up to D1 timeframe;
- Configuration for the indicator's period (default: 20 period ATR);
- Configuration for plotting the indicator on the the x axis with an offset/at begining of the day (default: offset);

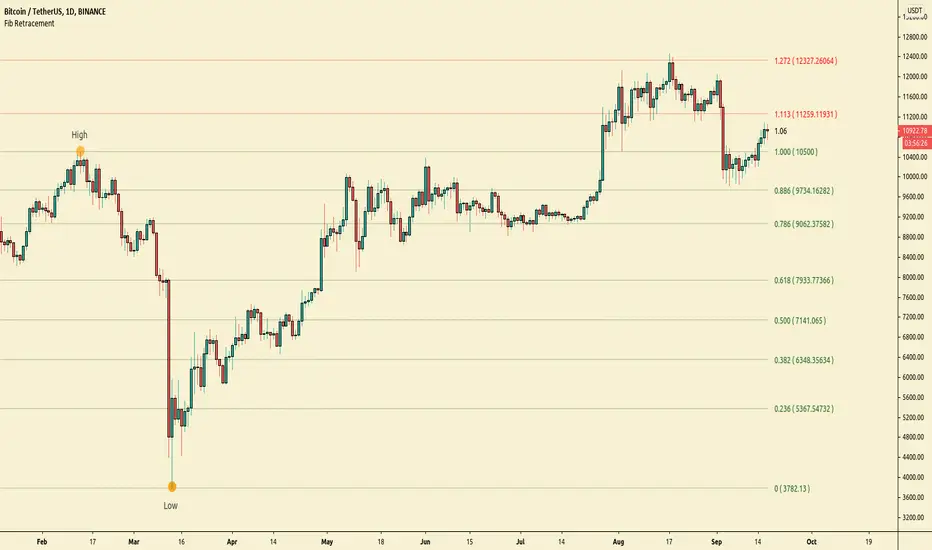
Simple Fibonacci RetracementSimple Fibonacci Retracement is a free and easy to use script to plot Fibonacci levels, for any assets like Stocks, Forex, Commodities , Cryptocurrencies etc. on any time frame chart.
Fibonacci Levels can be plotted using Lookback or manual Price input from the settings.
1. Lookback type - Candles
Determines the High and Low price of the user input number of Candles back (100 default) and plots Fibonacci Levels based on the calculated High and Low for the number of candles in the past from the current candle. The levels stay intact on any time frame as long as no new Highs or Lows are formed.
2. Lookback type - Days
Determines the High and Low price of the user input number of Days back (100 default) and plots Fibonacci Levels based on the calculated High and Low for the number of days in the past from the day of the current bar. The levels stay intact on any time frame as long as no new Highs or Lows are formed.
3. Manual Price Input
Plots Fibonacci Levels based on the user specified High and Low Price in the settings input fields. The levels stay intact on any time frame irrespective of new Highs or Lows being formed. Manual Price Input will enable the trader to keep the Levels intact and visually see the higher Fibonacci Retracement levels, when the price crosses beyond 100% retracement. On the other two lookback types, the Fibonacci levels are displayed only upto 100% retracement.
The Fibonacci levels can also be reversed by enabling 'Reverse' option from the settings.
Efficient Support & Resistance LevelsThis script is a mixture of my two previous scripts "True Strong Classical Support/Resistance Levels" and "Hidden Supports & Resistances + Round Levels". This combination brings on better identification of the most efficient support/resistance levels.
Note that "Hidden SnR Levels" part of the code is only expected to work on Forex charts, but apart from that, the other parts could be applied to any chart.
The script may:
- Draw classical support/resistance levels which retraced the price previously, aided by multi-timeframe analysis
- Draw hidden support/resistance levels based on psychological patterns of the price
- Adjust to wicks better than Pine Script built-in pivot functions
- Differ the levels color based on chart reactions
- Merge nearby classical levels to avoid congestion on the chart
Feel free to use it and send me your thoughts.

Ampleforth LevelsDisplays relevant Ampleforth (AMPL) levels:
- Target price, based on CPI (PCE)
- Equilibrium levels between which there is no rebase