SN Intraday BundleThe intraday bundle is a combination of this item:
1 ) Buy and Sell trailing based on the Average True Range (ATR) with an alert
2 ) 3 customizable moving average line
Blue: MA 1 (5)
Red: MA 2 (18)
Green: MA 3 (13)
3 ) Trend line indicator
Green: when CCI is positive
Orange: when CCI is negative
4 ) Trend card background-color based on EMA trend direction
Green: Uptrend
Red: Downtrend
Yellow: Neutral
5 ) Bursa Malaysia Limit Up and Limit Down indicator
Green Dotted Line: + 30% from last day closed priced
Red Dotted Line: - 30% from last day closed priced
6 ) Daily, weekly, and monthly VWAP line
Grey: Daily VWAP
Blue: Weekly VWAP
Silver: Monthly VWAP
7 ) Above and below daily VWAP indicator with alert
Blue Arrow Up: Price above daily VWAP
Blue Arrow Down: Price below daily VWAP
Trade with caution ✌️
Intraday

NeverBot Basic Momentum ShiftNeverBots Basic Momentum Shift Script
This script is a basic up/down indicator to tell you which way momentum has shifted, this should be used as part of another system to add confluence to your already existing long or short thesis. Uses a simple algebraic equation to define the momentum and when up or down has shifted above/below the other.
Combine this with an MA strategy to get entries for a good hit rate. Typically used for intraday but you can still use this as an indicator for higher time frames.
Crypto is very volatile and momentum can shift within a few minutes which is why you will see some failed signals, but typically it works very well for catching the big moves in crypto as momentum becomes very strong due to FOMO etc..

asw Intraday SetBest for intraday trading!
Key levels to watch during intraday include Open price, high & low of the the and of yesterday's.
These lines are plotted on the chart with VWAP in addition.
Hope it helps!

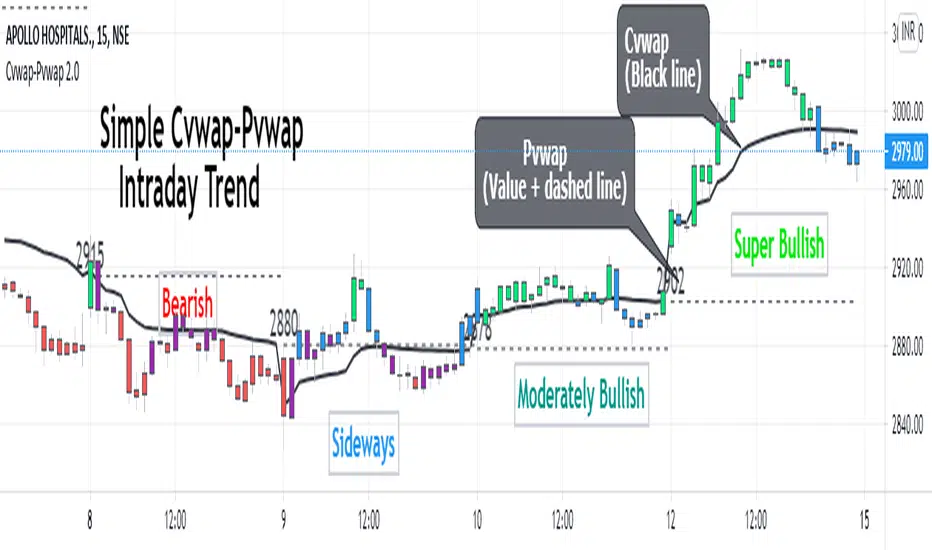
Cvwap-Pvwap 2.0A simple vwap based Intraday trend indicator.
Volume-Weighted Average Price (VWAP) - the average price weighted by volume, starts when trading opens and ends when it closes. This can help institutions buy or sell in large orders, without disturbing the market.
After buying or selling, institutions compare instrument price to closing VWAP values at end of the day.
For big financial institutions;
A buy order executed below the VWAP value, considered a good fill because the security was bought at a below average price.
A sell order executed above the VWAP would be deemed a good fill because it was sold at an above average price.
Simple price based moving average is not helpful for them; = as it doesn't incorporates volume traded. Hence - VWAP :)
So how it helps us in decoding the IntraDay-trend? - Through a 2 day vwap co-relation.
So, Closing value of previous day vwap = Pvwap
Today's running vwap = Cvwap
Defining the IntraDay Trend:
Moderately Bullish = candle closing price above Pvwap but below Cvwap
Super Bullish = Closing price is above both (Cvwap and Pvwap)
Moderately Bearish = Closing price is above Cvwap but below Pvwap
Super Bearish = Closing Price is below both (Cvwap and Pvwap)
A big gap between the Cvwap and the candle closing price defines the strong participation from institutions in that direction. (Strong Trend)
Moving with the smart money, in the overall trend is a wise decision for any intraday trader and this helps at its best.
DX24 Version 2.0Indicator «DX24 Version 2.0»
Class : scalpel hybrid
Period : 5 minutes – 15 minutes
Designed for short-term intraday trading.
The indicator consists of three blocks: level-block, trend-block and statistical-block.
The level block is used to determine the entry points, as well as the basic parameters of the trade (stop loss and take profit).
The trend block is used to determine the priority direction of the trade.
The statistical block is used to provide additional information to the two base blocks.
Level block
Consists of dynamic support (blue lines) and resistance (red lines) levels. Accordingly, near these lines positions should be opened: the long ones from support lines and short ones from resistance lines.
Trend block
Contains two linier regression lines (based on close prices): slow (default period = 89) and fast (default period = 21).
The purpose of this block is to ensure that trade is in the trend. That is, only trades in the direction of BOTH linier regression lines are allowed.
Statistical block
Contains a modified version of the classical indicator Bollinger Bands and allows to determine the maximum upper bounds of the current movement and the minimum lower ones. On the graph it is represented by black lines of the dynamic channel. The behavior of these lines can determine the current state of the market - the narrowing of lines - a signal for more aggressive trading, expansion - a signal of a surge in volatility and an reason for more conservative trading. The coincidence of the level lines with the lines of the dynamic channel is an confirmatory signal, that is, the probability of a correct entry into the position in this case significantly increases.
Trading rules
This version of the indicator is designed for intraday scalping trade and should be used on charts from 5 min to 15 min intervals.
The general rules of trade are as follows:
- linier regressions indicate the permitted direction of transactions (both averages should be unidirectional and transactions are allowed only in this direction. For example, if both regression lines grow, you can only buy and vice versa).
- sell from the red line (take-profit is located in the area of the blue line; the stops are respectively above the red line);
- buy from blue line (take-profit is located in the area of the red lines, stop respectively below the blue line).
Version 2.0 updates:
- linier regression lines are used instead EMAs;
- periods for the fast and slow regressions are optimized;
- colored zones are used to mark current dominating direction;
- visualization parameters of indicator are updated.
Access to the indicator
Please address all questions about this indicator (including access to it) in private messages.

Implied volatility indicator - Bouhmidi-Bands Volatility trading with the Bouhmidi-Bands
Most known indicators such as Bollinger Bands or Keltner Channel focus only on historical volatility. Bouhmidi bands follow a different approach, namely an indicator based on implied volatility.
Style tags: Implied Volatility, Volatility Trading, Trend Analysis
Asset class: Equities, Futures, Commodities
Dataset: Minutes / Hours
Description
The most famous volatility indicators such as Bollinger Bands , Keltner Channel , Donchian Channels , etc. all use the historical volatility of the underlying asset. However, volatility is determined not only by historical volatility but also by implied volatility. The additional analysis of implied volatility sharpens the view and improves trading.
The Bouhmidi Bands ® were developed by myself and are based on implied volatility. They calculate an expected daily bandwidth under the assumption of normally distributed returns. The bandwidth is based on 1σ or 2σ. This means that an underlying closes with a probability of 68% or 95% within the expected Bouhmidi bandwidth at the end of the day. Check the historical development. The track record over the past 20 years shows a strong robustness of the indicator.
Benefits using Bouhmidi bands
- The Bouhmidi bands can be used to identify and filter "invisible" resistance and support that cannot be detected with simple chart analysis.
- The Bouhmidi bands can be used for different trading approaches. For example, they are suitable for mean reversion and volatility breakouts.
- If you combine the Bouhmidi bands with e.g. Keltner channel or Bollinger bands, you have the historical and implied volatility in one view in your tradingview chart.
Which underlyings can I trade with the Bouhmidi bands?
To determine the Bouhmidi bands, we need the underlying and the corresponding implied volatility index:
- S&P 500 - VIX
- DAX - VDAX-NEW
- Dow Jones - VXD
- Nasdaq 100 - VXN
- Gold - GVZ
- WTI - OVX
- Apple - VXAPL
- Amazon - VXAZN
- Google - VXGOG
- IBM - VXIBM

Intraday SeasonalityDay trading trend filter indicator designed to hep get better entries or exits based on historical opens and closes each hour.
This indicator is NOT designed as an entry or exit signal. The purpose behind it is to give you statistical information about how likely certain times of day are either bullish, bearish or neutral and use that to confirm or reject other trading signals.
For example you might be anticipating a breakout based on your strategy or another indicator but see that the next few hours are usually bearish and re-evaluate entering the trade.
The Intraday Seasonality indicator calculates the percentage of candles per hour that had a higher close than open.
Default settings are:
- a look-back of 90 days.
- extreme bullish (bright green) above 74%
-extreme bearish (bright red) below 25%
- bullish (green) above 55%
- bearish (red) below 45%
- neutral (white) exactly 50%
- no trend (gray) 46% - 54%
All of these are updatable via the settings.
This indicator is designed to work only on the 1 hour timeframe.
To use the indicator set your local timezone offset in the indicator settings.
*Due to daylight savings and certain timezones changing throughout the year there is a timezone override in the indicator settings if the indicator doesn't pick up the correct local time.

Intraday Trading Tool [VK]This Indicator is all you need to day trade.
Overview: This is a intraday/scalp trading Indictor works using MTF- MA,MACD,RSI for trend ,SRSI For Entries , Murrey Lines for Targets and ATR For Stop Loss , it is designed for all type of markets (crypto, forex, stocks, commodity etc.) and works on all commonly used timeframes .
About The Indicator :
This indicator uses the most commonly used indicators in The markets, MA channel + MACD (Background Trend) + RSI (Trend On Top) . This Three Indicators Are Used For Trend In Higher Time Frame. We Have to take trades based on Trend In Higher Time Frames. We are using SRSI For entries which Has the function to show entries from Higher Time Frames .
Stop Loss And Take Profit : we have used ATR for Stop Loss which will show up with Buy/Sell Signals. and for Taking Profit We Have used Murrey Lines Which Can be used to see Support/Resistance as Targets And also has the function to show Support/Resistance from Higher Time Frame.
Extra Function :
The Cross And Triangles On the Bottom of the Chart Indicates MACD Cross on Higher Time Frames .
How to get access:
Send a Private Massage for getting access to the script.

ak commodity gold,silver intradayHi friends this is Ak commodity gold , silver INTRADAY
It analyse price action when price makes higher high or higher low and it scalps and take profit ..It scalp on 1 min time frame..its occur in moment of time so for that algo trading require..it automatically take profit and stoploss and close trade near session end.it close all trade at 11pm..before commodity session close.. u can also change time for close trade...it automatically calculate previous candles high and low and when it breaks it generate buy and sell signal and take profit and loss
it is not holly grill strategy..it has drawdown...so before use be cauction..it calculates previous more than 200 candles high and low and than generate buy and sell signal.. its main advantage is it close all trade near session end so its more help full for intraday trader for backtesting..
if u want to use my strategy pls personal msg me

ak crude oil intradayHi friends this is Ak CRUDEOIL INTRADAY
It calculate rsi over bought and over sell from different period and generate buy and sell signale
It analyse price action when price makes higher high or higher low and it scalps and take profit ..It scalp on 1 min time frame..its occur in moment of time so for that algo trading require..it automatically take profit and stoploss and close trade near session end.it close all trade at 11pm..before commodity session close.. u can also change time for close trade...it automatically calculate previous candles high and low and when it breaks it generate buy and sell signal and take profit and loss
if u want to use this strategy pls personal message me

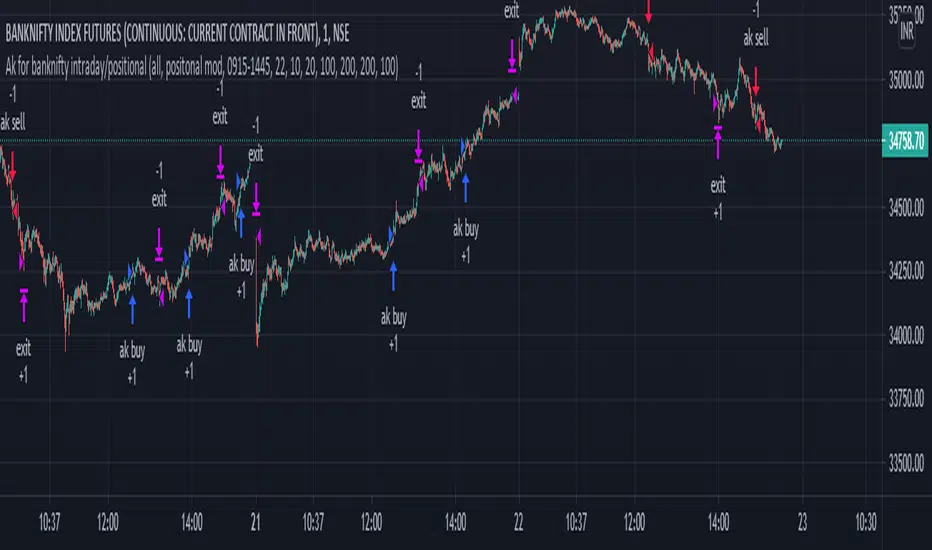
Ak for Banknifty intradayHi friends this is Ak for Banknifty Intraday
It analyse price action when price makes higher high or higher low and it scalps and take profit ..its occur in moment of time so for that algo trading require..it automatically take profit and stoploss and close trade near session end. u can also change time for close trade...it automatically calculate previous candles high and low and when it breaks it generate buy and sell signal...
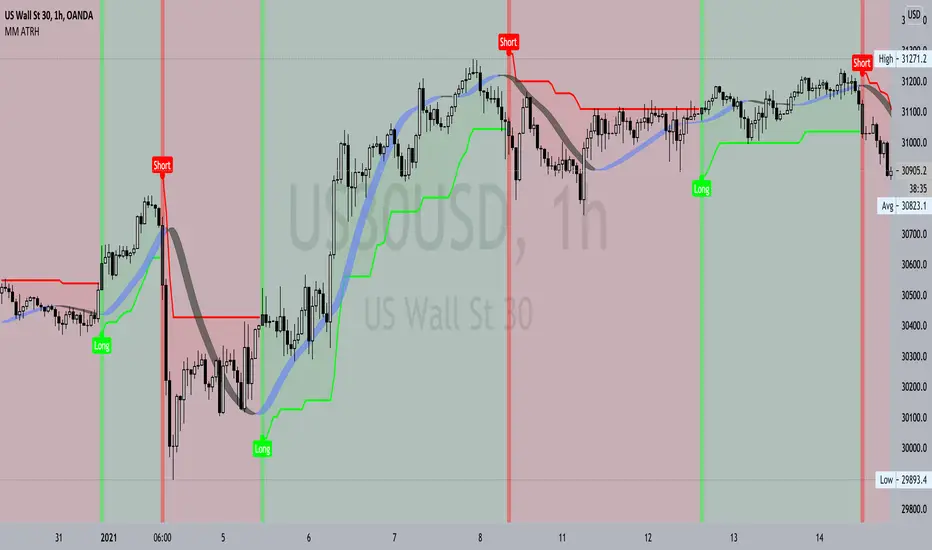
MM AverageTrueRangehUllFeatures:
- Powerful 2 calculation used in one. Average True Range Multiplier & Sensitivity.
- Clearly shows trend direction, volatility , momentum & sentiment of any financial market.
- Dynamic stop loss levels formed by the help of average true range calculation which are produce right from the long or short signal and does stretch until the opposite directional signal appears.
- Generates potential long and short trade signals using complex formula of volatility , momentum and trend following.
- ATR calculation method can be changed from normal (ATR) to SMA version true range inside setting by ticking or unticking the input function named “Change ATR Calculation Method?”.
- Long and short signals labels can be turn off/on using “Reveal Long/Short Signals?”. - Background color can be shown/hidden using “Signal-light Show/Hide?”.
- Alert feature available for long and short signals.
Important two main settings of ATRH indicator:
1. ATR Multiplier
o A retail trader should adjust the setting depending on the financial market, instrument and timeframe as per required.
o Basically, higher timeframe has more range in price so ATR multiplier can be set higher.
o ATR multiplier value lower can produce more signals which will be as more trades opportunities but it can also lead to fake signals. 3-5 value is producing reasonable signals in any timeframe either it be lower or it be higher. If a trader by mistake doesn’t set a proper input value then the whole indicator could even function poorly so this setting must be used wisely.
2. Sensitivity
o Sensitivity can be from 0 to 1. It can be also integer or floating-point number example: 0.1, 0.3, 0.8 etc.
o It is used to control the signal generation speed by 3 to 5 candle bars before (if the value is set higher) or after (if the value is set lower) during the time of condition meeting for either long or short signals.
o Depending on any financial market or instrument sensitivity value should be managed well by a trader for his/her needs taking consideration on the nature of that particular financial market or instrument & timeframe.
Use link below or PM us for access you this indicator. Happy Trading
Key Levels SpacemanBTC IDWMKey levels, plotted automatically
Additional timeframes can be added on request
Useful for seeing strength of the trend in the market

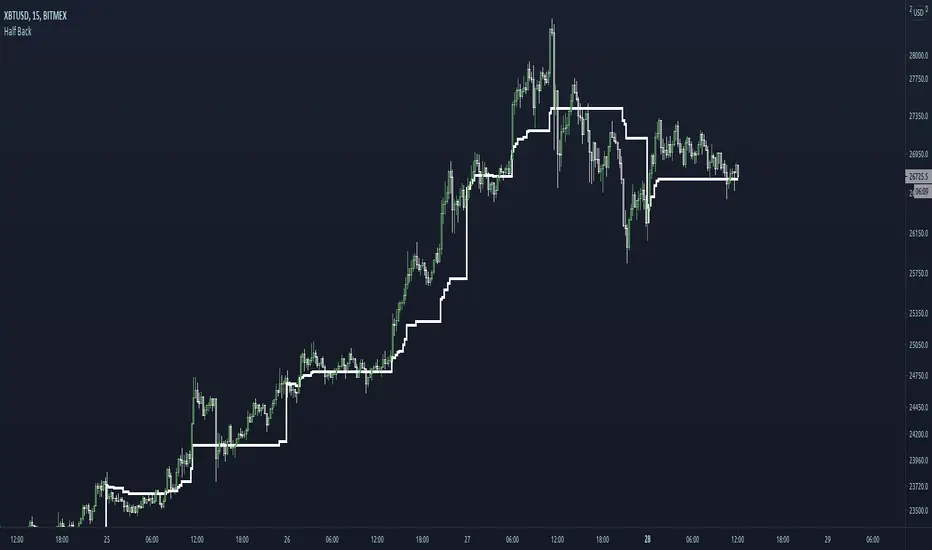
Half BackA dynamic intraday midpoint for Day Timeframe trader reference.
Midpoint is halfway between the day's highest high and lowest low.
Midpoint resets daily.
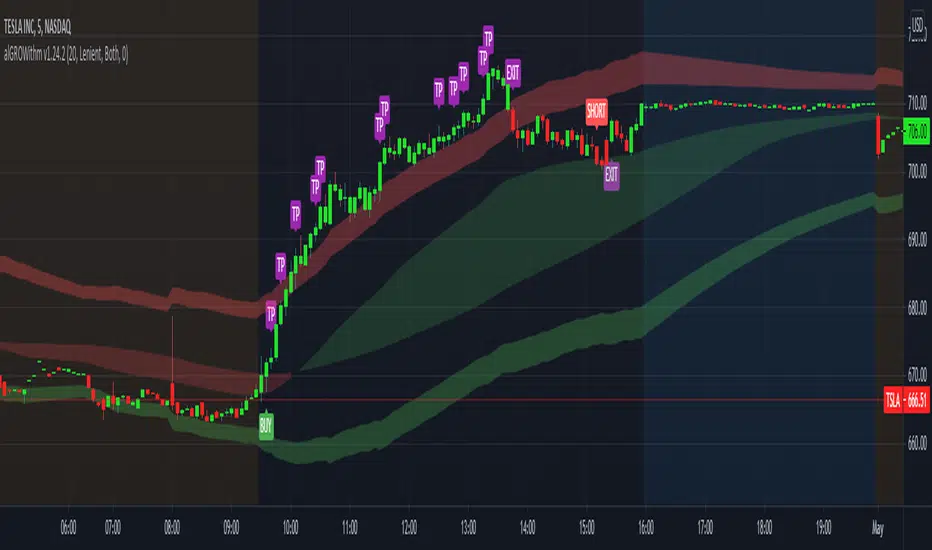
alGROWithm PremiumIntroducing the alGROWithm indicator!
Years of trading experience and endless hours of screen time has undeniably proven to me that the most fundamental rule of any market is: price moves from supply to supply and demand to demand. Specifically, this means that a breakout of a supply zone , the probability of it reaching the next supply zone before starting consolidate is very high. Similarly, a breakdown from previous demand zone will likely continue to the next demand zone . The identification method of these supply and demand channels is one of the features that sets this indicator apart from other available tools.
What separates alGROWithm from other available tools?
- Proprietary method for identifying supply & demand channels combined with a directional bias computation based on recent historical prices
- Only signaling precise entries based on supply & demand that maximize R/R
- Tracking open positions and displaying a trading plan directly on the chart immediately after signaling entry points
- Indicating precise exit levels to help you avoid exiting too early or trading by emotion
What are the features included in alGROWithm?
Trading Plan Lines : These are the Buy/Short/Take Profit/Exit lines plotted directly on the chart
Show Long Signals : These are the green "BUY" labels that appear on the chart when alGROWithm identifies a critical breakout to the next supply level
Show Short Signals : These are the red "SHORT" labels that appear on the chart when alGROWithm identifies a critical breakdown to the next demand level
Show Take Profit Signals : These are the purple "TP" labels that appear on the chart when alGROWithm identifies that the subsequent supply/ demand level has been hit
Show Exit/Stop Loss Signals : These are the purple "EXIT" labels that appear on the chart when alGROWithm identifies that the trade has run its course and it's time to exit
Show Dashboard : This is a dashboard that is displayed to the right of the latest candle, and contains the following information:
- Current Position : "Long", "Short", or "None"
- Next Profit Target : Only displays if there is an active Position
- Current Bias : alGROWithm computes a directional bias based on recent historical prices. Text will say "Long" or "Short"
- Long/Short Bias Until : alGROWithm's bias will change if this price is hit. Note that these are not BUY or SELL levels - this simply indicates whether things are looking up or down
- Enter Short/Long At : Only displays if Current Position = "None"
Note that you can enable/disable any of these chart overlays at anytime through the indicator settings.
The alGROWithm indicator works on any timeframe, any market, and standard OR Heikin Ashi candlesticks .
I have been working very hard on this indicator and I personally use it on a daily basis with options trading. I am so excited to share the wealth with you!
You can use the link below to visit our website and gain access to the script.
GMS: Market Performance IndicatorThis is just an easy way to visualize what the market's performance is (in price or percent) in any given session for any chosen time frame. The magnitude of price moves are not the same today as they were 50 years ago, which is why I included the percent selection to better compare historical movements. Time frame selections are Daily, Weekly, Monthly, Quarterly, and Yearly. I added in a little background highlight to show the start of a new session as well.
The source code is open so feel free to poke around!
Hope this helps,
Andre

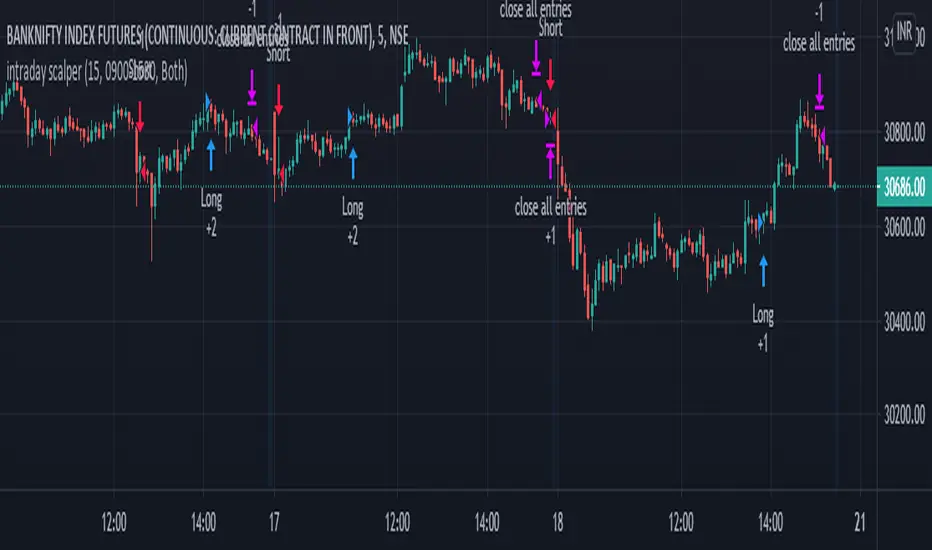
intraday scalper with stopHi friends....publishing intraday scalper which shows the movement of price over time and how strong those movements are/will be, regardless of the direction the price moves, up, or down. Indicator specifically useful, as it helps traders and analysts spot points where the market can and will reverse by providing signals long (buy) and short (sell). Show the relative strength of price movements but leave out the directionality of the price movements, best utilized in combination with other technical indicators – such as trend lines and moving averages – which show price trends and directions. Having an alert feature to make aware market players from signals provided by the indicator.
u can start and close your trades at your define period. Use full for stockmarkets, mcx and forex because all movement occur in new York session....u can set your time to start trading and also for closing. you can also hold position if u want...by changing just close hours at 24..this way u can hold your trade untill next buy/sell signal come..
hope it will help intraday traders
and best of luck to all..
****you can use it any stocks ,forex and crypto**********
some tips for new traders to become sucessful trader
1: always follow risk management...
2: every stock/ forex / crypto has it own cycle.. So pls dont jump from one stock / forex pair to another when u hear some stock / crypto has
made new high or low... Bcs after that consolidation period starts.. During consolidation we can not make more profit as in trending market.. So be patient when u had made some position or tarde in one stock/ pair...
3 : we dont require to trade in every stocks / forex/crypto.. Just one stock and pair trading daily make u profitable beyond ur expection.. Bcs
trading in one stock / forex pair.. make u very comfortable and u may always know its movement... And u also trade in every cycle of this
stock/ pair.. So u also trdae its trend days which made highest profit. We dont know when is trend of any stock... Compare with it
business... Trading is business not one day rich game... Its business... It takes time and u have to do same thing agian and again to become
sucessfull trader for this u can use tradingview alerts. .for that u dont need to seat infrot of ur terminal screen.. u can also do algo trading
by using tradingview alerts
4 : By following risk management and incerase lot size as profit increased... This is the key 🔑 of sucess in stocks / forex / crypto market.
I thinks this tips may help new trader. U can modified according to ur trading style..
You can personal message me if u want to use this strategy
Swing Algo For Allhi friends....publishing Swing Algo For All .. which shows the movement of price over time and how strong those movements are/will be, regardless of the direction the price moves, up, or down. Indicator specifically useful, as it helps traders and analysts spot points where the market can and will reverse by providing signals long (buy) and short (sell). Show the relative strength of price movements but leave out the directionality of the price movements, best utilized in combination with other technical indicators – such as trend lines and moving averages – which show price trends and directions. Having an alert feature to make aware market players from signals provided by the strategy.
There are mainly 3 tyes of swing traders
1 intraday swing trader
2 weekly positional swing trader
3 monthly/yearly positional swing trader
This strategy solves problem of all the type of swing trader. you have to just select type of swing which u want to trade suppose u chose intraday swing it automatically calculate intraday swing high and low and shows buy and sell sign according to it...if it shows buy signal than in lower part it shows plotted line when this line break it automatically generate sell signal and vice versa for sell signal.
same for weekly , monthly and yearly
u can use it in any time frame bcs swing structure are same in any time frame
*********************************************************************************************************
*************** And also use for any stocks, forex and crypto*****************
screenshot on Banknifty weekly swing
some tips for new traders to become successful trader
1: always follow risk management...
2: every stock/ forex / crypto has it own cycle.. So pls dont jump from one stock / forex pair to another when u hear some stock / crypto has
made new high or low... Bcs after that consolidation period starts.. During consolidation we can not make more profit as in trending market.. So be patient when u had made some position or tarde in one stock/ pair...
3 : we dont require to trade in every stocks / forex/crypto.. Just one stock and pair trading daily make u profitable beyond ur expection.. Bcs
trading in one stock / forex pair.. make u very comfortable and u may always know its movement... And u also trade in every cycle of this
stock/ pair.. So u also trdae its trend days which made highest profit. We dont know when is trend of any stock... Compare with it
business... Trading is business not one day rich game... Its business... It takes time and u have to do same thing agian and again to become
sucessfull trader for this u can use tradingview alerts. .for that u dont need to seat infrot of ur terminal screen.. u can also do algo trading
by using tradingview alerts
4 : By following risk management and incerase lot size as profit increased... This is the key 🔑 of sucess in stocks / forex / crypto market.
I thinks this tips may help new trader. U can modified according to ur trading style..
You can personal message me if u want to use this strategy
u can personal message me if u want to use it..

MAST TrendHello Traders !!
This is a simple super trend based MAST trend.
By default the supertrend is 10 period with 3 ATR multiplier.
A moving average is used to benefit from the pullback entries.
Bullish Pullback : Price above Supertrend & below MA
Bullish: Price above Supertrend and above MA
Bearish pullback : Price below Supertrend & above MA
Bearish : Price below Supertrend & below MA
Refer to investopedia or any relevant articles for in detail about Supertrend.

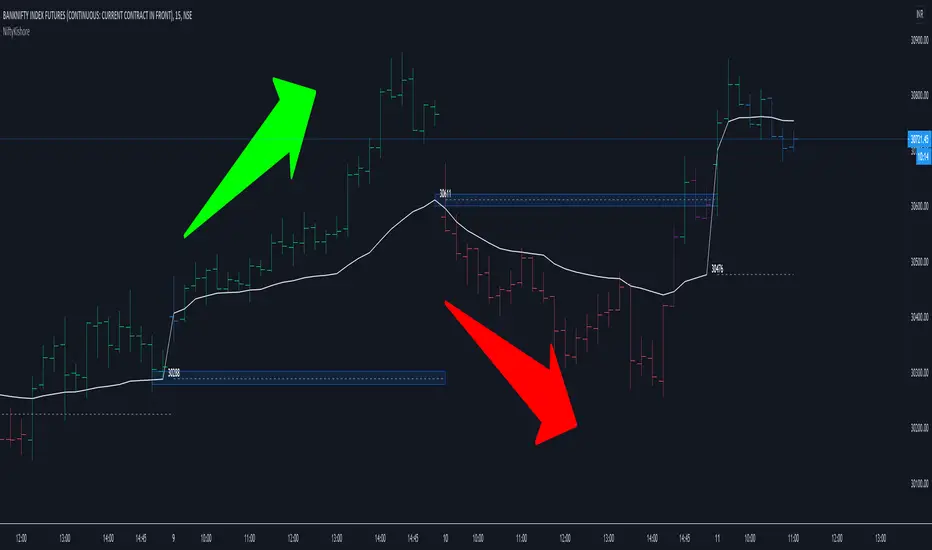
Vwap Pvwap Intraday Trend - NiftyKishoreHello Traders !!
This is a simple trend identification script which is based on the current vwap (Cvwap) and previous vwap (Pvwap).
Pvwap in the sense; previous day vwap closing value.
Bullish: price is closing above the current day vwap and previous day vwap(pvwap).
Bearish : Price is closing below the current day vwap and previous day vwap (pvwap).
Made a change to the barcolors as well :)
Bullish
Green Bar: close is above Pvwap and Cvwap.
Blue bar: close is above Pvwap but below Cwap.
Bearish
Red bar: close is below Pvwap and Cvwap.
Purple bar: close is below Pvwap but above Cvwap.
Simple but effective
Cheers !!
Intraday Caja de AlfredoThis indicator is not a strategy by itself, and only works intraday.
A box will start to draw an hour after the market open and continue being drawn for the next two hours. This is being done due to the theory of it being the time where small investors and institutions are moving the price with less volatility than the first hour.
Once the Box has been closed support and resistance of the day will be drawn. Price should try remaining between t his two.
There are alerts for the breakthrough of the box to either upside or downside. This should be followed by a corresponding direction candle pattern, in order to expect a higher/lower break.

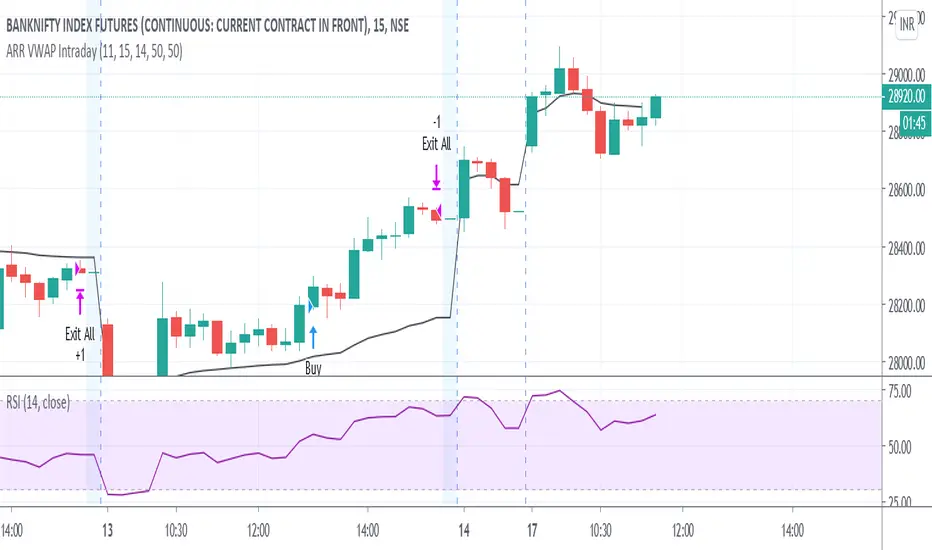
ARR VWAP IntradayIntra day VWAP Strategy
Strategy is
Buy when vwap goes up and RSI above 50 (Can be modified) .
Sell wehn vwap goes down and rsi bellow 50 (Can be modified)
Exit all at market close hour specified
Intraday Mid PointA moving indicator that is overlaid main chart. Identifies the start of the day, and then applies this formula:
( Current High of Day + Current Low of Day ) / 2, to get the mid point. It is a useful tool to identify buy side or sell side control, along with vwap.
