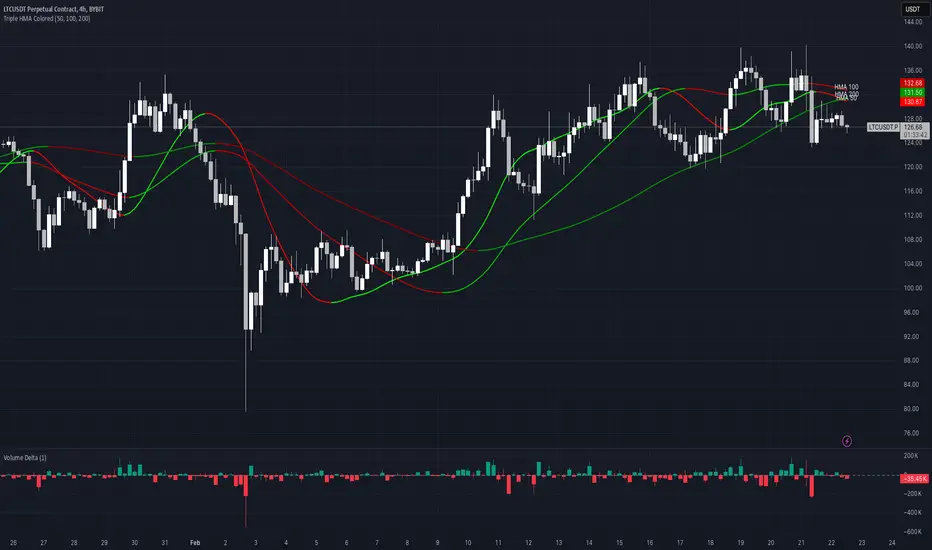
Triple HMA Colored [Chichomax]Triple HMA Colored Indicator Description
The Triple HMA Colored indicator is a sophisticated technical analysis tool designed to enhance trend identification by displaying three Hull Moving Averages (HMAs) on your chart, each with fully customizable periods and dynamic color settings. This indicator is built on the refined HMA calculation method, which leverages weighted moving averages (WMAs) to generate smooth and responsive trend lines with minimal lag.
Key Features:
- Triple HMA Setup:
Displays three HMAs, each computed with different, user-configurable periods, enabling multi-timeframe analysis in a single indicator.
- Dynamic Color Coding:
Each HMA line is color-coded based on its directional movement. When the current HMA value exceeds the previous value, the line is drawn in the designated "up" color, and when it falls below, it switches to the "down" color. This provides immediate visual cues for trend shifts.
- Customizable Inputs:
Users can adjust the period lengths for each of the three HMAs and select from six different color options (two for each HMA) directly from the indicator’s settings panel, ensuring that the tool can be tailored to match various trading strategies and visual preferences.
- Efficient Trend Detection:
By combining the speed of WMAs with the smoothness of the Hull Moving Average, this indicator offers a reliable method to detect market momentum changes, making it a valuable asset for both trend-following and counter-trend strategies.
Ideal for traders who demand flexibility and clarity in their chart analysis, the Triple HMA Colored indicator simplifies the process of tracking market trends across multiple timeframes while providing clear, visual signals for potential entry and exit points.
Hullmovingaverage
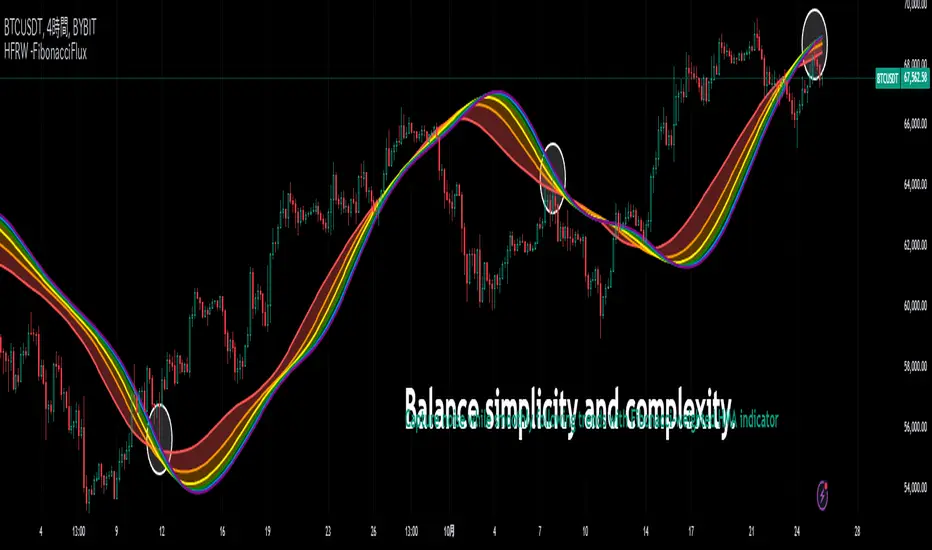
HMA Fibonacci Rainbow Waves[FibonacciFlux]HMA Fibonacci Rainbow Waves
Overview
The HMA Fibonacci Rainbow Waves script is designed for traders who strive for simplicity in their trading strategies while navigating the complexities of chart analysis. By utilizing the Hull Moving Average (HMA) for smoothing, this indicator provides a refined view of price action. However, over-smoothing can sometimes filter out essential market noise. To address this, the indicator incorporates a unique approach by applying Fibonacci weighting to seven HMA200 calculations. This enables traders to capture noise while effectively following market trends.
BTCUSDT 4hour
Key Features
1. Hull Moving Average (HMA)
- The HMA is known for its responsiveness and ability to filter out noise, providing a clear view of the underlying trend.
- The indicator balances smoothness with responsiveness, making it suitable for various trading styles, from day trading to swing trading and scalping.
2. Fibonacci Weighting
- By applying Fibonacci numbers to the HMA calculations, the indicator enhances its ability to adapt to market dynamics.
- This unique approach allows traders to maintain clarity while accommodating fluctuations in price action, ensuring they do not miss critical entry points.
3. Multi-Timeframe Functionality
- The HMA Fibonacci Rainbow Waves indicator operates effectively across multiple timeframes, including daily, 4-hour, 5-minute, and 1-minute charts.
- This adaptability makes it a valuable tool for traders, regardless of their preferred trading style, facilitating seamless transitions between different market conditions.
4. Noise Capture and Trend Following
- The indicator is designed to capture essential market movements while filtering out excessive noise.
- It helps traders follow trends without being overwhelmed by market fluctuations, allowing them to act on advantageous entry conditions that might otherwise be obscured.
Signal Generation and Alerts
- The indicator generates buy and sell signals based on the relationship between the HMAs, providing clear entry and exit points.
- Customizable alerts keep traders informed of significant changes in market conditions, enabling timely decisions that reflect the nuances of market behavior.
BTCUSDT 15min
Benefits
1. Simplified Trading Approach
- Traders can focus on core market movements without being distracted by excessive noise, enhancing decision-making efficiency and minimizing emotional trading.
2. Flexibility Across Timeframes
- The ability to function across different timeframes allows traders to apply the same principles in various trading scenarios, from quick scalps to strategic swing trades.
3. Enhanced Market Insights
- The combination of HMA smoothing and Fibonacci weighting offers a comprehensive view of market trends, aiding traders in identifying potential opportunities, including those that institutional investors might exploit.
4. Resolving Complexity with Simplicity
- This indicator elegantly bridges the gap between simplicity and complexity, providing a single tool that addresses the inherent contradictions in trading psychology. It allows traders to simplify their strategies while still capturing the dynamic nature of the market.
BTCUSDT 1min
Conclusion
The HMA Fibonacci Rainbow Waves script is a powerful tool for traders seeking to streamline their analysis while effectively capturing market dynamics. By integrating advanced smoothing techniques with Fibonacci weighting, this indicator empowers traders to follow market trends confidently across various timeframes. Its design makes it an essential asset for both novice and experienced traders alike, offering insights that can reveal entry points often missed by traditional indicators.
Open Source Collaboration
This script is released as an open-source project on TradingView, inviting the global trading community to contribute and enhance its functionality. By collaborating on this project, traders can help improve its capabilities, ensuring it remains a valuable resource for market participants around the world.
Important Note
As with any trading tool, it is crucial to conduct thorough analysis and risk management when using this indicator. Past performance does not guarantee future results, and traders should always be prepared for potential market fluctuations.
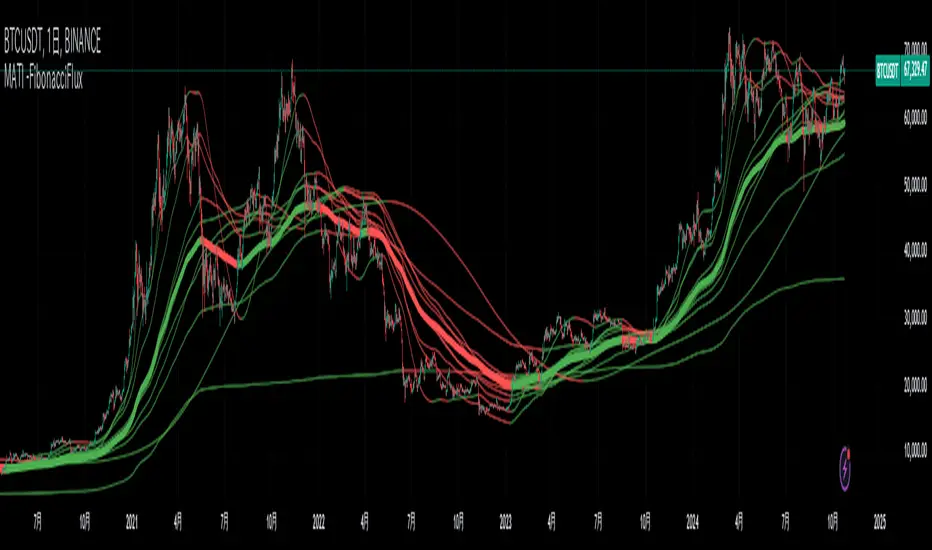
Multi-Average Trend Indicator (MATI)[FibonacciFlux]Multi-Average Trend Indicator (MATI)
Overview
The Multi-Average Trend Indicator (MATI) is a versatile technical analysis tool designed for traders who aim to enhance their market insights and streamline their decision-making processes across various timeframes. By integrating multiple advanced moving averages, this indicator serves as a robust framework for identifying market trends, making it suitable for different trading styles—from scalping to swing trading.
MATI 4-hourly support/resistance
MATI 1-hourly support/resistance
MATI 15 minutes support/resistance
MATI 1 minutes support/resistance
Key Features
1. Diverse Moving Averages
- COVWMA (Coefficient of Variation Weighted Moving Average) :
- Provides insights into price volatility, helping traders identify the strength of trends in fast-moving markets, particularly useful for 1-minute scalping .
- DEMA (Double Exponential Moving Average) :
- Minimizes lag and quickly responds to price changes, making it ideal for capturing short-term price movements during volatile trading sessions .
- EMA (Exponential Moving Average) :
- Focuses on recent price action to indicate the prevailing trend, vital for day traders looking to enter positions based on current momentum.
- KAMA (Kaufman's Adaptive Moving Average) :
- Adapts to market volatility, smoothing out price action and reducing false signals, which is crucial for 4-hour day trading strategies.
- SMA (Simple Moving Average) :
- Provides a foundational view of the market trend, useful for swing traders looking at overall price direction over longer periods.
- VIDYA (Variable Index Dynamic Average) :
- Adjusts based on market conditions, offering a dynamic perspective that can help traders capture emerging trends.
2. Combined Moving Average
- The MATI's combined moving average synthesizes all individual moving averages into a single line, providing a clear and concise summary of market direction. This feature is especially useful for identifying trend continuations or reversals across various timeframes .
3. Dynamic Color Coding
- Each moving average is visually represented with color coding:
- Green indicates bullish conditions, while Red suggests bearish trends.
- This visual feedback allows traders to quickly assess market sentiment, facilitating faster decision-making.
4. Signal Generation and Alerts
- The indicator generates buy signals when the combined moving average crosses above its previous value, indicating a potential upward trend—ideal for quick entries in scalping.
- Conversely, sell signals are triggered when the combined moving average crosses below its previous value, useful for exiting positions or entering short trades.
Insights and Applications
1. Scalping on 1-Minute Charts
- The MATI excels in fast-paced environments, allowing scalpers to identify quick entry and exit points based on short-term trends. With dynamic signals and alerts, traders can react swiftly to price movements, maximizing profit potential in brief price fluctuations.
2. Day Trading on 4-Hour Charts
- For day traders, the MATI provides essential insights into intraday trends. By analyzing the combined moving average and its relation to individual moving averages, traders can make informed decisions on when to enter or exit positions, capitalizing on daily price swings.
3. Swing Trading on Daily Charts
- The MATI also serves as a valuable tool for swing traders. By evaluating longer-term trends through the combined moving average, traders can identify potential swing points and adjust their strategies accordingly. The flexibility of adjusting the lengths of the moving averages allows for tailored approaches based on market volatility.
Benefits
1. Clarity and Insight
- The combination of diverse moving averages offers a clear visual representation of market trends, aiding traders in making informed decisions across multiple timeframes.
2. Flexibility and Customization
- With adjustable parameters, traders can adapt the MATI to their specific strategies, making it suitable for various market conditions and trading styles.
3. Real-Time Alerts and Efficiency
- Built-in alerts minimize response times, allowing traders to capitalize on opportunities as they arise, regardless of their trading style.
Conclusion
The Multi-Average Trend Indicator (MATI) is an essential tool for traders seeking to enhance their technical analysis capabilities. By seamlessly integrating multiple moving averages with dynamic color coding and real-time alerts, this indicator provides a comprehensive approach to understanding market trends. Its versatility makes it an invaluable asset for scalpers, day traders, and swing traders alike.
Important Note
As with any trading tool, thorough analysis and risk management are crucial when using this indicator. Past performance does not guarantee future results, and traders should always be prepared for market fluctuations.
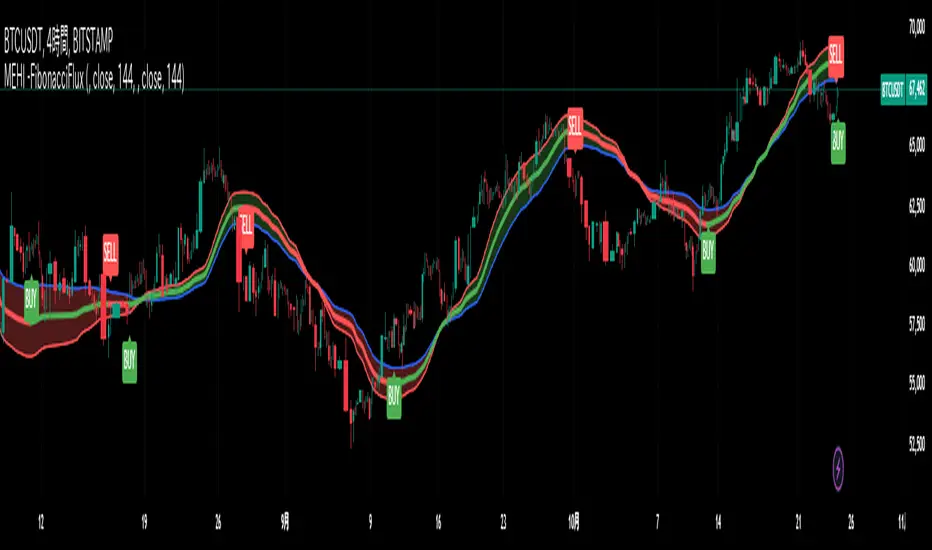
MTF EHMA & HMA Insights [FibonacciFlux]MTF EHMA & HMA Insights
Overview
The Multi-Timeframe EHMA, HMA, and Midline with Fill script is a powerful technical analysis tool designed for traders seeking to enhance their market insights and decision-making processes. By integrating two advanced moving averages—Exponential Hull Moving Average (EHMA) and Hull Moving Average (HMA)—along with a dynamic midline, this indicator provides a comprehensive view of market trends across multiple timeframes.
Key Features
1. Dual Moving Averages
- Exponential Hull Moving Average (EHMA) :
- Offers a rapid response to price changes, making it particularly useful for identifying short-term trends.
- Utilizes a unique calculation method that reduces lag, allowing traders to react quickly to market movements.
- Hull Moving Average (HMA) :
- Known for its smoothness and ability to filter out noise, the HMA presents a clear picture of the underlying trend.
- The HMA is specifically designed to achieve a balance between responsiveness and smoothness, enabling traders to make informed decisions.
2. Midline Calculation
- Dynamic Midline (m) :
- The midline is calculated as the average of EHMA and HMA, providing a neutral reference point for evaluating price movements.
- It visually represents market sentiment; a rising midline suggests bullish conditions, while a declining midline indicates bearish trends.
3. Visual Components
- Fill Areas :
- Color-coded fills between the EHMA and HMA enhance visual clarity by indicating the relative position of these moving averages.
- The fill color dynamically changes based on the relationship between the two averages (green for EHMA below HMA and red for EHMA above HMA), allowing traders to quickly assess market conditions.
4. Signal Generation and Alerts
- Buy/Sell Signals :
- The indicator generates buy signals when the midline crosses above its previous value, indicating a potential upward trend.
- Conversely, sell signals are triggered when the midline crosses below its previous value, suggesting a possible downward movement.
- Alert Conditions :
- Built-in alerts notify traders in real-time when significant changes occur, allowing them to act swiftly on potential trading opportunities.
- Customizable alert messages ensure traders receive relevant information tailored to their strategies.
Technical Details
Input Parameters
- Timeframe Settings :
- Traders can customize the timeframes for both EHMA and HMA, enabling them to adapt the indicator to different trading styles and market conditions.
- Length Settings :
- Adjustable lengths for both moving averages impact their sensitivity, allowing traders to optimize their performance based on volatility and market dynamics.
Plotting and Visualization
- Plotting :
- The script plots the EHMA, HMA, and midline directly on the chart for easy visualization.
- Signal labels (BUY and SELL) are displayed prominently, helping traders to identify potential entry and exit points without ambiguity.
Benefits
1. Clarity and Insight
- The combination of EHMA, HMA, and midline provides a clear and concise visual representation of market trends, aiding traders in making informed decisions.
2. Flexibility
- Customizable parameters allow traders to tailor the indicator to their specific needs, making it suitable for various market conditions and trading styles.
3. Efficiency
- Real-time alerts and visual signals minimize response times, enabling traders to capitalize on opportunities as they arise.
4. Enhanced Trading Conditions
- When utilizing the Fibonacci number 144 on a daily chart, the indicator facilitates optimal trading conditions:
- "The entry was made before the bubble began, using 144 as the Fibonacci variable."
- "The exit occurred right before the bubble burst, or alternatively, a short position was initiated."
- "When the next bubble started, a long entry was made again."
- "Despite some lag, the position was exited and a long entry was made."
- "The exit or short entry took place at the second double top peak."
- "A short position was already established before the double top formation occurred."
- On a 4-hour chart, traders can effectively set stop losses at HMA levels, achieving a risk-reward ratio between 4 and 8.
- Additionally, analyzing the 15-minute chart with a multi-timeframe approach allows for more precise entry points.
Conclusion
The Multi-Timeframe EHMA, HMA, and Midline with Fill script is a robust tool for traders looking to enhance their technical analysis capabilities. By combining multiple moving averages with a dynamic midline and alert system, this indicator offers a comprehensive approach to understanding market trends. Its flexibility, clarity, and efficiency make it an invaluable asset for both novice and experienced traders alike.
Important Note
As with any trading tool, it is crucial to conduct thorough analysis and risk management when using this indicator. Past performance does not guarantee future results, and traders should always be prepared for potential market fluctuations.
HMA Z-Score Probability Indicator by Erika BarkerThis indicator is a modified version of SteverSteves's original work, enhanced by Erika Barker. It visually represents asset price movements in terms of standard deviations from a Hull Moving Average (HMA), commonly known as a Z-Score.
Key Features:
Z-Score Calculation: Measures how many standard deviations the current price is from its HMA.
Hull Moving Average (HMA): This moving average provides a more responsive baseline for Z-Score calculations.
Flexible Display: Offers both area and candlestick visualization options for the Z-Score.
Probability Zones: Color-coded areas showing the statistical likelihood of prices based on their Z-Score.
Dynamic Price Level Labels: Displays actual price levels corresponding to Z-Score values.
Z-Table: An optional table showing the probability of occurrence for different Z-Score ranges.
Standard Deviation Lines: Horizontal lines at each standard deviation level for easy reference.
How It Works:
The indicator calculates the Z-Score by comparing the current price to its HMA and dividing by the standard deviation. This Z-Score is then plotted on a separate pane below the main chart.
Green areas/candles: Indicate prices above the HMA (positive Z-Score)
Red areas/candles: Indicate prices below the HMA (negative Z-Score)
Color-coded zones:
Green: Within 1 standard deviation (high probability)
Yellow: Between 1 and 2 standard deviations (medium probability)
Red: Beyond 2 standard deviations (low probability)
The HMA line (white) shows the trend of the Z-Score itself, offering insight into whether the asset is becoming more or less volatile over time.
Customization Options:
Adjust lookback periods for Z-Score and HMA calculations
Toggle between area and candlestick display
Show/hide probability fills, Z-Table, HMA line, and standard deviation bands
Customize text color and decimal rounding for price levels
Interpretation:
This indicator helps traders identify potential overbought or oversold conditions based on statistical probabilities. Extreme Z-Score values (beyond ±2 or ±3) often suggest a higher likelihood of mean reversion, while consistent Z-Scores in one direction may indicate a strong trend.
By combining the Z-Score with the HMA and probability zones, traders can gain a nuanced understanding of price movements relative to recent trends and their statistical significance.

Hullinger Percentile Oscillator [AlgoAlpha]🚀 Introducing the Hullinger Percentile Oscillator by AlgoAlpha! 🚀
This versatile Pine Script™ indicator is designed to help you identify swing trends and potential reversals with precision. Whether you're looking to catch market swings or spot divergences, the Hullinger Percentile Oscillator offers a comprehensive suite of features to enhance your trading strategy.
Key Features
🎯 Customizable Hullinger Settings: Adjust the main length, source, and standard deviation multipliers to fine-tune the indicator to your preferred trading style.
🔄 Dynamic Oscillator Modes: Switch between "Swing" mode for trend identification and "Contrarian" mode for reversal spotting, adapting the indicator to your market view.
📉 Divergence Detection: The indicator includes parameters to control the sensitivity and confirmation of divergence signals, helping to filter out noise and highlight significant market moves.
🌈 Color-Coded Visuals: Easily distinguish between bullish and bearish signals with customizable color settings for a clear visual representation on your chart.
🔔 Alert Integration: Stay ahead of the market with built-in alerts for key conditions, including strong and weak reversals, as well as bullish and bearish swings.
Quick Guide to Using the Hullinger Percentile Oscillator
Maximize your trading edge with the Hullinger Percentile Oscillator by following these steps! 📈✨
🛠 Add the Indicator: Add the indicator to favorites by pressing the star icon ⭐. Customize settings like Main Length, Oscillator Mode, and Appearance to fit your trading needs.
📊 Market Analysis: Use "Swing" mode to track trends and "Contrarian" mode to spot reversals. Watch for divergence signals to catch potential trend changes.
🔔 Alerts: Set up alerts to be notified of significant market movements without constantly monitoring your chart.
How It Works
The Hullinger Percentile Oscillator calculates its signals by applying a modified standard deviation approach to the Hull Moving Average (HMA) of a selected price source. It creates both inner and outer bands based on different multipliers. The oscillator then measures the position of the price relative to these bands, smoothing the result for swing trend detection. Depending on the chosen mode, the oscillator either highlights swing trends or potential reversals. Divergences are detected by comparing recent pivot highs and lows in both price and the oscillator, allowing you to spot bullish or bearish divergence setups. Alerts are triggered based on key crossovers or when specific conditions are met, ensuring that you are always informed of crucial market developments.

Hullinger Bands [AlgoAlpha]🎯 Introducing the Hullinger Bands Indicator ! 🎯
Maximize your trading precision with the Hullinger Bands , an advanced tool that combines the strengths of Hull Moving Averages and Bollinger Bands for a robust trading strategy. This indicator is designed to give traders clear and actionable signals, helping you identify trend changes and optimize entry and exit points with confidence.
✨ Key Features :
📊 Dual-Length Settings : Customize your main and TP signal lengths to fit your trading style.
🎯 Enhanced Band Accuracy : The indicator uses a modified standard deviation calculation for more reliable volatility measures.
🟢🔴 Color-Coded Signals : Easily spot bullish and bearish conditions with customizable color settings.
💡 Dynamic Alerts : Get notified for trend changes and TP signals with built-in alert conditions.
🚀 Quick Guide to Using Hullinger Bands
1. ⭐ Add the Indicator : Add the indicator to favorites by pressing the star icon. Adjust the settings to align with your trading preferences, such as length and multiplier values.
2. 🔍 Analyze Readings : Observe the color-coded bands for real-time insights into market conditions. When price is closer to the upper bands it suggests an overbought market and vice versa if price is closer to the lower bands. Price being above or below the basis can be a trend indicator.
3. 🔔 Set Alerts : Activate alerts for bullish/bearish trends and TP signals, ensuring you never miss a crucial market movement.
🔍 How It Works
The Hullinger Bands indicator calculates a central line (basis) using a simple moving average, while the upper and lower bands are derived from a modified standard deviation of price movements. Unlike the traditional Bollinger Bands, the standard deviation in the Hullinger bands uses the Hull Moving Average instead of the Simple Moving Average to calculate the average variance for standard deviation calculations, this give the modified standard deviation output "memory" and the bands can be observed expanding even after the price has started consolidating, this can identify when the trend has exhausted better as the distance between the price and the bands is more apparent. The color of the bands changes dynamically, based on the proximity of the closing price to the bands, providing instant visual cues for market sentiment. The indicator also plots TP signals when price crosses these bands, allowing traders to make informed decisions. Additionally, alerts are configured to notify you of crucial market shifts, ensuring you stay ahead of the curve.

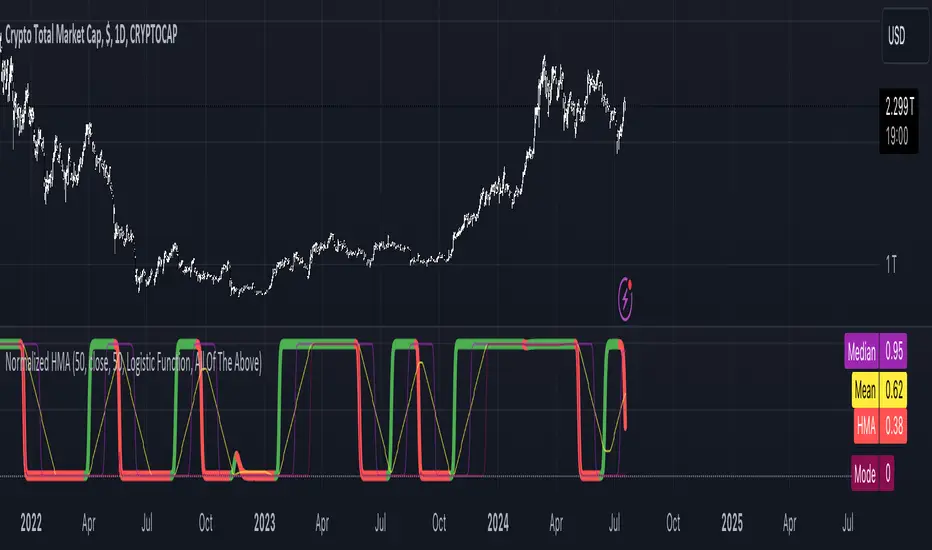
Normalized Hull Moving Average Oscillator w/ ConfigurationsThis indicator uniquely uses normalization techniques applied to the Hull Moving Average (HMA) and allows the user to choose between a number of different types of normalization, each with their own advantages. This indicator is one in a series of experiments I've been working on in looking at different methods of transforming data. In particular, this is a more usable example of the power of data transformation, as it takes the Hull Moving Average of Alan Hull and turns it into a powerful oscillating indicator.
The indicator offers multiple types of normalization, each with its own set of benefits and drawbacks. My personal favorites are the Mean Normalization , which turns the data series into one centered around 0, and the Quantile Transformation , which converts the data into a data set that is normally distributed.
I've also included the option of showing the mean, median, and mode of the data over the period specified by the length of normalization. Using this will allow you to gather additional insights into how these transformations affect the distribution of the data series.
Types of Normalization:
1. Z-Score
Overview: Standardizes the data by subtracting the mean and dividing by the standard deviation.
Benefits: Centers the data around 0 with a standard deviation of 1, reducing the impact of outliers.
Disadvantages: Works best on data that is normally distributed
Notes: Best used with a mid-longer length of transformation.
2. Min-Max
Overview: Scales the data to fit within a specified range, typically 0 to 1.
Benefits: Simple and fast to compute, preserves the relationships among data points.
Disadvantages: Sensitive to outliers, which can skew the normalization.
Notes: Best used with mid-longer length of transformation.
3. Mean Normalization
Overview: Subtracts the mean and divides by the range (max - min).
Benefits: Centers data around 0, making it easier to compare different datasets.
Disadvantages: Can be affected by outliers, which influence the range.
Notes: Best used with a mid-longer length of transformation.
4. Max Abs Scaler
Overview: Scales each feature by its maximum absolute value.
Benefits: Retains sparsity and is robust to large outliers.
Disadvantages: Only shifts data to the range , which might not always be desirable.
Notes: Best used with a mid-longer length of transformation.
5. Robust Scaler
Overview: Uses the median and the interquartile range for scaling.
Benefits: Robust to outliers, does not shift data as much as other methods.
Disadvantages: May not perform well with small datasets.
Notes: Best used with a longer length of transformation.
6. Feature Scaling to Unit Norm
Overview: Scales data such that the norm (magnitude) of each feature is 1.
Benefits: Useful for models that rely on the magnitude of feature vectors.
Disadvantages: Sensitive to outliers, which can disproportionately affect the norm. Not normally used in this context, though it provides some interesting transformations.
Notes: Best used with a shorter length of transformation.
7. Logistic Function
Overview: Applies the logistic function to squash data into the range .
Benefits: Smoothly compresses extreme values, handling skewed distributions well.
Disadvantages: May not preserve the relative distances between data points as effectively.
Notes: Best used with a shorter length of transformation. This feature is actually two layered, we first put it through the mean normalization to ensure that it's generally centered around 0.
8. Quantile Transformation
Overview: Maps data to a uniform or normal distribution using quantiles.
Benefits: Makes data follow a specified distribution, useful for non-linear scaling.
Disadvantages: Can distort relationships between features, computationally expensive.
Notes: Best used with a very long length of transformation.
Conclusion
This indicator is a powerful example into how normalization can alter and improve the usability of a data series. Each method offers unique insights and benefits, making this indicator a useful tool for any trader. Try it out, and don't hesitate to reach out if you notice any glaring flaws in the script, room for improvement, or if you just have questions.
Kalman Hull RSI [BackQuant]Kalman Hull RSI
At its core, this indicator uses a Kalman filter of price, put inside of a hull moving average function (replacing the weighted moving averages) and then using that as a price source for the the RSI, very similar to the Kalman Hull Supertrend just processing price for a different indicator.
This also allows it to make it more adaptive to price and also sensitive to recent price action. This indicator is also mainly built for trend-following systems
PLEASE Read the following, knowing what an indicator does at its core before adding it into a system is pivotal. The core concepts can allow you to include it in a logical and sound manner.
1. What is a Kalman Filter
The Kalman Filter is an algorithm renowned for its efficiency in estimating the states of a linear dynamic system amidst noisy data. It excels in real-time data processing, making it indispensable in fields requiring precise and adaptive filtering, such as aerospace, robotics, and financial market analysis. By leveraging its predictive capabilities, traders can significantly enhance their market analysis, particularly in estimating price movements more accurately.
If you would like this on its own, with a more in-depth description please see our Kalman Price Filter.
OR our Kalman Hull Supertrend
2. Hull Moving Average (HMA) and Its Core Calculation
The Hull Moving Average (HMA) improves on traditional moving averages by combining the Weighted Moving Average's (WMA) smoothness and reduced lag. Its core calculation involves taking the WMA of the data set and doubling it, then subtracting the WMA of the full period, followed by applying another WMA on the result over the square root of the period's length. This methodology yields a smoother and more responsive moving average, particularly useful for identifying market trends more rapidly.
3. Combining Kalman Filter with HMA
The innovative combination of the Kalman Filter with the Hull Moving Average (KHMA) offers a unique approach to smoothing price data. By applying the Kalman Filter to the price source before its incorporation into the HMA formula, we enhance the adaptiveness and responsiveness of the moving average. This adaptive smoothing method reduces noise more effectively and adjusts more swiftly to price changes, providing traders with clearer signals for market entries or exits.
The calculation is like so:
KHMA(_src, _length) =>
f_kalman(2 * f_kalman(_src, _length / 2) - f_kalman(_src, _length), math.round(math.sqrt(_length)))
Use Case
The Kalman Hull RSI is particularly suited for traders who require a highly adaptive indicator that can respond to rapid market changes without the excessive noise associated with typical RSI calculations. It can be effectively used in markets with high volatility where traditional indicators might lag or produce misleading signals.
Application in a Trading System
The Kalman Hull RSI is versatile in application, suitable for:
Trend Identification: Quickly identify potential reversals or confirmations of existing trends.
Overbought/Oversold Conditions: Utilize the dynamic RSI thresholds to pinpoint potential entry and exit points, adapting to current market conditions.
Risk Management: Enhance trading strategies by integrating a more reliable measure of momentum, which can lead to improved stop-loss placements and exit strategies.
Core Calculations and Benefits
Dynamic State Estimation: By applying the Kalman Filter, the indicator continually adjusts its calculations based on incoming price data, providing a real-time, smoothed response to price movements.
Reduced Lag: The integration with HMA significantly reduces lag, offering quicker responses to price changes than traditional moving averages or RSI alone.
Increased Accuracy: The dual filtering effect minimizes the impact of price spikes and noise, leading to more accurate signaling for trades.
Thus following all of the key points here are some sample backtests on the 1D Chart
Disclaimer: Backtests are based off past results, and are not indicative of the future.
INDEX:BTCUSD
INDEX:ETHUSD
BINANCE:SOLUSD

Trend Continuation Signals [AlgoAlpha]Introducing the Trend Continuation Signals by AlgoAlpha 🌟🚀
Elevate your trading game with this multipurpose indicator, designed to pinpoint trend continuation opportunities as well as highlight volatility and oversold/overbought conditions. Whether you're a trading novice or a seasoned market veteran, this tool offers intuitive visual cues to boost your decision-making and enhance your market analysis. Let's explore the key features, how to use it effectively, and delve into the operational mechanics that make this tool a game-changer in your trading arsenal:
Key Features:
🔥 Advanced Trend Detection : Leverages the Hull Moving Average (HMA) for superior trend tracking as compared to other MAs, offering unique insights into market momentum.
🌈 Volatility Bands : Implements adjustable bands around the trend line, which evolve with market conditions to highlight potential trading opportunities.
⚡ Trend Continuation Signals : Identifies bullish and bearish continuation signals, equipping you with actionable signals to exploit the prevailing market trend.
🎨 Intuitive Color Coding : Employs a vibrant color scheme to distinguish between uptrends, downtrends, and neutral phases, facilitating easy interpretation of the indicator's insights.
🛠 How to Use "Trend Continuation Signals ":
🔍 Setting Up : Incorporate the indicator onto your chart and customize the indicator to suite your preferences.
👀 Reading the Signals : Pay attention to the color-coded trend lines and volatility bands. Green indicates an uptrend, red signifies a downtrend, and gray denotes a neutral market condition.
📈 Identifying Entry Points : Look for bullish (▲) and bearish (▼) continuation icons below or above the price bars as signals for potential entry points for long or short positions, respectively.
🔄 Confirmation : Validate your trades with further analysis or other indicators. The Trend Continuation Signals are most effective when complemented by other technical analysis tools or fundamental insights.
📉 Risk Management : Implement stop-loss orders in line with your risk appetite and adjust them based on the volatility bands provided by the indicator to safeguard your investments.
How It Operates:
The essence of the indicator is captured through the hull moving averages for both the primary and secondary lines, set at periods of 93 and 50, respectively, to reflect market trends and pullbacks that trigger the continuation signals every time price recovers from a detected pullback.
Volatility is quantified through the standard deviation of the midline, magnified by a factor, establishing the upper and lower trend band boundaries.
Further volatility bands are plotted around the main volatility band, providing a granular view of market volatility and potential breakout or breakdown zones.
Market trend direction is determined by comparing the HMA line's current position to its previous value, enhanced by the secondary line to identify continuation patterns.
Embrace the power of the Trend Continuation Signals to enhance your trading strategy! It is important to note that all indicators are best used in confluence with other forms of analysis, happy trading! 📊💥

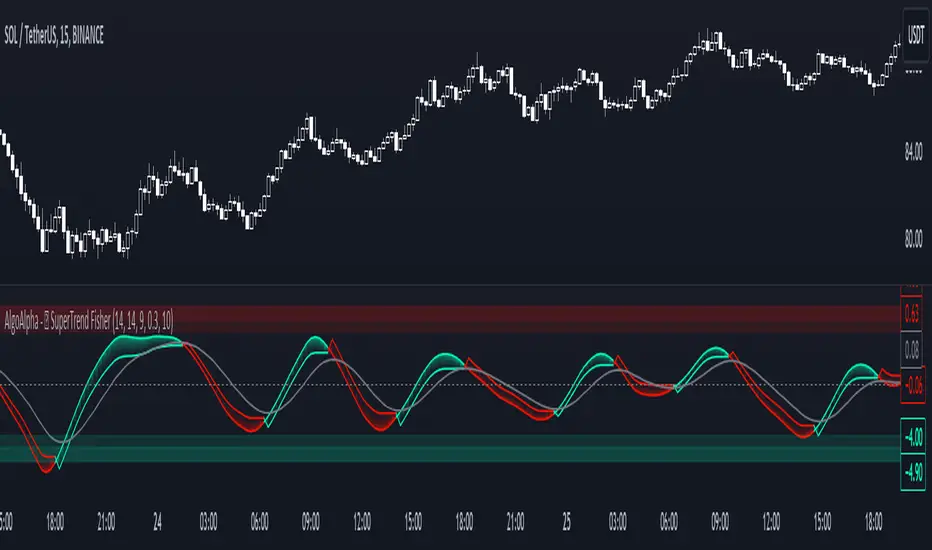
SuperTrend Fisher [AlgoAlpha]🚀🌟 Introducing the "Super Fisher" by AlgoAlpha, a sophisticated and versatile tool crafted for the discerning trader. This innovative indicator merges the precision of the Fisher Transform with the adaptability of the SuperTrend methodology, offering a fresh perspective on market analysis. 📈🔍
Key Features:
🔶 Customizable Settings: Tailor the indicator to your trading style with adjustable inputs like "Fair-value Period" and "EMA Length". Choose your preferred "Up Color" and "Down Color" for a personalized visual experience.
🔶 Advanced Fisher Transform: At the heart of this tool is the Fisher Transform, an algorithm renowned for pinpointing potential price reversals by normalizing asset prices.
🔶 Integrated SuperTrend Functionality: This feature adds a layer of trend analysis, using the refined Fisher Transform values to generate dynamic, trend-following signals.
🔶 Enhanced Visualization: Clearly distinguishable bullish and bearish market phases, thanks to the color-coded plots of Fisher Transform and SuperTrend values.
🔶 Overbought/Oversold Levels: Visual plots and fills for these levels provide additional insights into market extremities.
🔶 Configurable Alerts: Stay informed with alerts for critical market movements like crossing the zero line or the SuperTrend.
Logic:
The "Super Fisher" operates on a sophisticated algorithm:
1. Fisher Transform Calculation: It starts by calculating the Detrended Price Oscillator (DPO) and its standard deviation. These values are then transformed using the Fisher Transform formula, which is subsequently smoothed with a Hull Moving Average.
2. SuperTrend Integration: The SuperTrend function employs the Fisher Transform values to create a dynamic trend-following tool. It calculates upper and lower bands and determines which one to use for market direction based on whether the fisher is above or below the bands, offering an insightful view of the price trend.
3. Overbought/Oversold Identification: The tool plots specific levels to indicate overbought and oversold conditions, aiding in the identification of potential reversal points.
Here's a closer look at the core calculations:
Calculates the Fisher Transform:
value = 0.0
value := round_(.66 * ((src - low_) / (high_ - low_) - .5) + .67 * nz(value ))
fish1 = 0.0
fish1 := .5 * math.log((1 + value) / (1 - value)) + .5 * nz(fish1 )
fish1 := ta.hma(fish1, l)
Calculates the SuperTrend:
supertrend(factor, atrPeriod, srcc) =>
src = srcc
atr = atrr(srcc, atrPeriod)
upperBand = src + factor * atr
lowerBand = src - factor * atr
prevLowerBand = nz(lowerBand )
prevUpperBand = nz(upperBand )
lowerBand := lowerBand > prevLowerBand or srcc < prevLowerBand ? lowerBand : prevLowerBand
upperBand := upperBand < prevUpperBand or srcc > prevUpperBand ? upperBand : prevUpperBand
int direction = na
float superTrend = na
prevSuperTrend = superTrend
if na(atr )
direction := 1
else if prevSuperTrend == prevUpperBand
direction := srcc > upperBand ? -1 : 1
else
direction := srcc < lowerBand ? 1 : -1
superTrend := direction == -1 ? lowerBand : upperBand
How to Use:
📊 To maximize the potential of the "Super Fisher", follow these steps:
1. Customize Settings: Adjust the inputs to match your trading preferences. This includes setting the periods for the Fisher Transform and SuperTrend, as well as choosing colors for better visualization.
2. Analyze the Market: Observe the Fisher Transform and SuperTrend plots to gauge market direction. Pay special attention to color changes, as they indicate shifts in market sentiment.
3. Identify Extremes: Use the overbought and oversold plots to understand potential reversal points.
4. Set Alerts: Utilize the alert functionality to stay informed about significant market movements, ensuring you never miss an opportunity.
🔥 In summary the "Super Fisher" is a comprehensive market analysis tool designed to enhance your trading insights and decision-making process. 📉🌟🚨
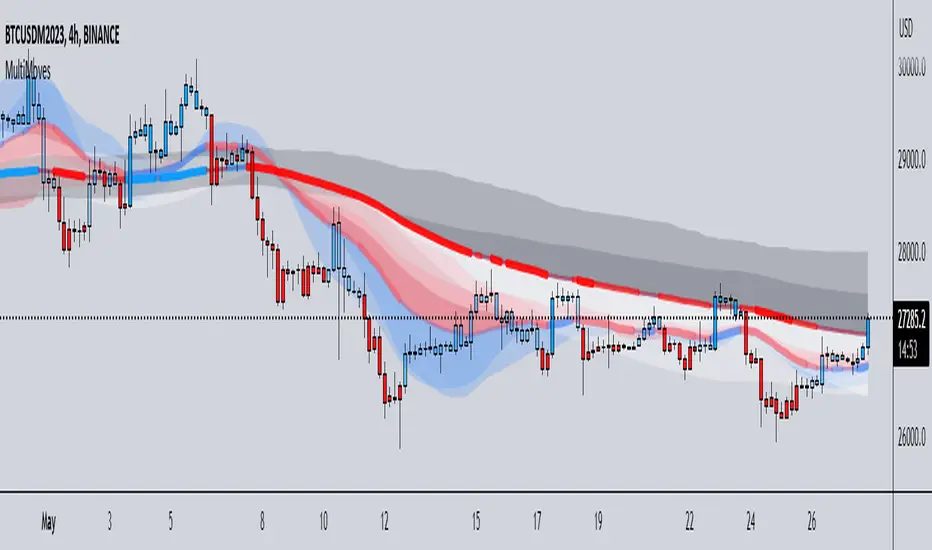
MultiMovesCombines 3 different moving averages together with the linear regression. The moving averages are the HMA, EMA, and SMA. The script makes use of two different lengths to allow the end user to utilize common crossovers in order to determine entry into a trade. The edge of each "cloud" is where each of the moving averages actually are. The bar color is the average of the shorter length combined moving averages.
-The Hull Moving Average (HMA), developed by Alan Hull, is an extremely fast and smooth moving average. In fact, the HMA almost eliminates lag altogether and manages to improve smoothing at the same time. A longer period HMA may be used to identify trend.
-The exponential moving average (EMA) is a technical chart indicator that tracks the price of an investment (like a stock or commodity) over time. The EMA is a type of weighted moving average (WMA) that gives more weighting or importance to recent price data.
-A simple moving average (SMA) is an arithmetic moving average calculated by adding recent prices and then dividing that figure by the number of time periods in the calculation average.
-The Linear Regression Indicator plots the ending value of a Linear Regression Line for a specified number of bars; showing, statistically, where the price is expected to be. Instead of plotting an average of past price action, it is plotting where a Linear Regression Line would expect the price to be, making the Linear Regression Indicator more responsive than a moving average.
The lighter colors = default 50 MA
The darker colors = default 200 MA
Hull Suite Oscillator - Normalized | IkkeOmarThis script is based off the Hull Suite by @InSilico.
I made this script to provide and calculate the Hull Moving Average (HMA) based on the chosen variation (HMA, TMA, or EMA) and length to then normalize the HMA values to a range of 0 to 100. The normalized values are further smoothed using an exponential moving average (EMA).
The smoothed oscillator is plotted as a line, where values above 80 are colored red, values below 20 are colored green, and values between 20 and 80 are colored blue. Additionally, there are horizontal dashed lines at the levels of 20 and 80 to serve as reference points.
Explanation for the code:
The script uses the close price of the asset as the source for calculations. The modeSwitch parameter allows selecting the type of Hull variation: Hma, Thma, or Ehma. The length parameter determines the calculation period for the Hull moving averages. The lengthMult parameter is used to adjust the length for higher timeframes. The oscSmooth parameter determines the lookback period for smoothing the oscillator.
There are three functions defined for calculating different types of Hull moving averages: HMA, EHMA, and THMA. These functions take the source and length as inputs and return the corresponding Hull moving average.
The Mode function acts as a switch and selects the appropriate Hull variation based on the modeSwitch parameter. It returns the chosen Hull moving average.
The script calculates the Hull moving averages using the selected mode, source, and length. The main Hull moving average is stored in the _hull variable, and aliases are created for the main Hull moving average (HULL), the main Hull value (MHULL), and the secondary Hull value (SHULL).
To create the normalized oscillator values, the script finds the highest and lowest values of the Hull moving average within the specified length. It then normalizes the Hull values to a range of 0 to 100 using a formula. This normalized oscillator represents the strength of the trend.
To smooth out the oscillator values, an exponential moving average is applied using the oscSmooth parameter.
The smoothed oscillator is plotted as a line chart. The line color is determined based on the oscillator value using conditional statements. If the oscillator value is above or equal to 80, the line color is set to red. If it is below or equal to 20, the color is green. Otherwise, it is blue. The linewidth is set to 2.
Additionally, two horizontal reference lines are plotted at levels 20 and 80 for visual reference. They are displayed in gray and dashed style.

Trend forecasting by c00l75----------- ITALIANO -----------
Questo codice è uno script di previsione del trend creato solo a scopo didattico. Utilizza una media mobile esponenziale (EMA) e una media mobile di Hull (HMA) per calcolare il trend attuale e prevedere il trend futuro. Il codice utilizza anche una regressione lineare per calcolare il trend attuale e un fattore di smorzamento per regolare l’effetto della regressione lineare sulla previsione del trend. Infine il codice disegna due linee tratteggiate per mostrare la previsione del trend per i periodi futuri specificati dall’utente. Se ti piace l'idea mettimi un boost e lascia un commento!
----------- ENGLISH -----------
This code is a trend forecasting script created for educational purposes only. It uses an exponential moving average (EMA) and a Hull moving average (HMA) to calculate the current trend and forecast the future trend. The code also uses a linear regression to calculate the current trend and a damping factor to adjust the effect of the linear regression on the trend prediction. Finally, the code draws two dashed lines to show the trend prediction for future periods specified by the user. If you like the idea please put a boost and leave a comment!

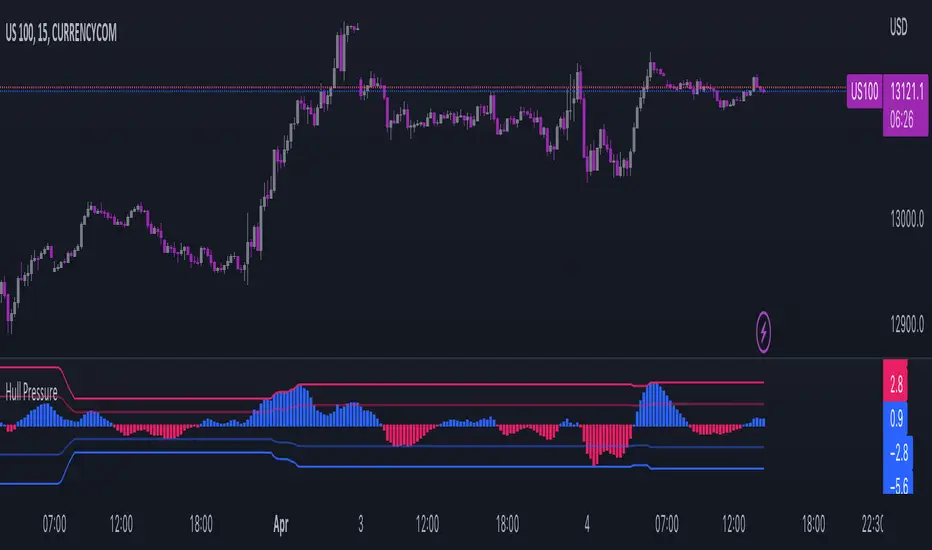
Hull PressureThis amazing oscillator displays the difference between the hull average calculated on the close of the candles and the one calculated between the average of the highs and lows.
This allows the user to identify the pressure of the closing price over the average, useful to identify trends, divergences, and reversals.
This indicator also has two dynamic overbought and oversold areas, calculated over the past extreme highs and lows of the oscillator.
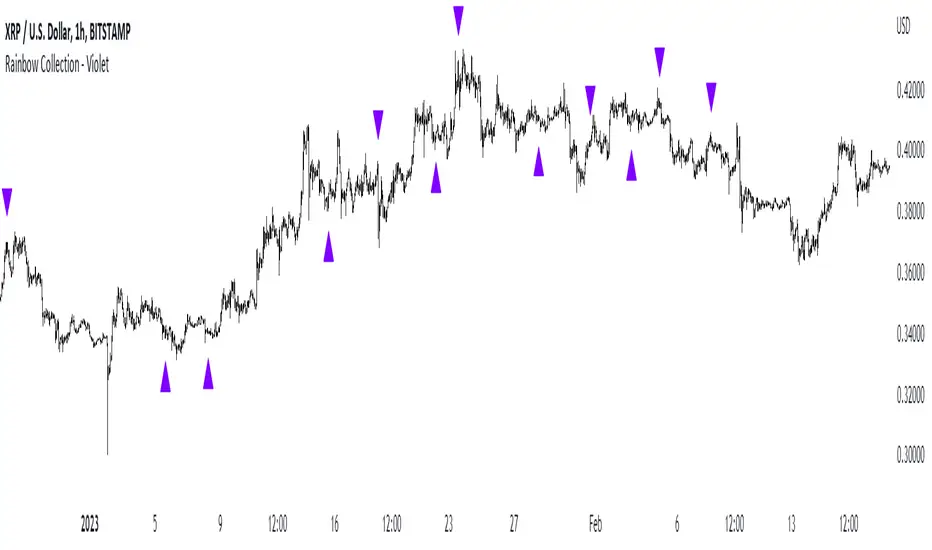
Rainbow Collection - VioletMoving averages come in all shapes and types. The most basic type is the simple moving average which is simply the sum divided by the quantity. Therefore, the simple moving average is the sum of the values divided by their number.
In technical analysis, you generally use moving averages to understand the underlying trend and to find trading signals. In the case of the Violet indicator, we are using a Hull moving average which is a special variation based on different weights to minimize lag.
The Violet indicator is therefore used as follows:
* A bullish signal is generated whenever the close price surpasses the 20-period Hull moving average while the previous close prices from periods were all below their respective Hull moving average of the period.
*A bearish signal is generated whenever the close price breaks the 20-period Hull moving average while the previous close prices from periods were all above their respective Hull moving average of the period.
The aim of the Violet indicator is to capture reversals as early as possible through a combination of lagged conditions based on the Fibonacci sequence.
Hull OscillatorThis oscillator comprehends two different indicators:
- The first one is a MACD but calculated using the Hull Moving Average.
- The second one is to show the direction in which the Hull Moving Average is going.
Notice that in the first indicator, the histogram is colored as follows:
- If the volume pressure (difference between the volume-weighted moving average and the normal one) is positive both for the short term and the long term, it's green, if negative it's red, and if not is simply gray.
This tool can be used both for:
- Analyze the direction to have a bias to follow
- Analyze the divergences
- Obtain the signal to enter and exit the trade
- Analyze the market strength with volume to confirm the signal

Strategy Myth-Busting #9 - HullSuite+LSMA - [MYN]This is part of a new series we are calling "Strategy Myth-Busting" where we take open public manual trading strategies and automate them. The goal is to not only validate the authenticity of the claims but to provide an automated version for traders who wish to trade autonomously.
Our 9th one is an automated version of the "I Tested The Best 1 Minute Scalping Strategy That Will Blow Your Mind 100 Times" strategy from "Profit Now" who claims to have achieved 36.7% profit scalping XRPUSDT on the 1 minute timeframe in only 15 days. As you can see from the backtest results below, I was unable to substantiate anything remotely close to that that claim on any timeframe or symbol. Myth 10000% busted.
This strategy uses a combination of 2 open-source public indicators: Hull Suite by InSilico and Least Squares Moving Average (LSMA)
The Hull Moving Average (HMA) is a faster version of the traditional moving average and is designed to reduce lag and improve the responsiveness of the average to price changes. In this strategy the HMA is used as a trend-following indicator, When the HMA is rising it is indicative of an upwards trend and when its falling its indicative of a downtrend.
The Least Squares Moving Average (LSMA) used in this strategy is similar to the HMA in that it is designed to reduce lag and improve the responsiveness of the average to price changes. In this strategy the LSMA is used to also not only identify trends but also confirm signals, it also is used to identify possible changes in the trend and market conditions.
When we use these together, the Hull Suite and LSMA indicators provide a complimentary confirmation of trend direction and trend swings. The Hull Suite helps to identify and confirm trends, while the LSMA aids to confirm signals and identify potential changes in market conditions.
The way this strategy is designed is when the Hull Suite HMA is trending up and the LSMA crosses above the HMA, we enter a long condition. When the Hull Suite is trending down and the LSMA crosses below the HMA we take a short position. Because of the low latency of these two indicators this strategy can be used on lower time frames down to 1 minute. On high volatility crypto on the lowest time frames, a 1:4 Risk Ratio should be used. A lower less risk ratio should be used on less volatile archetypes of securities.
If you know of or have a strategy you want to see myth-busted or just have an idea for one, please feel free to message me

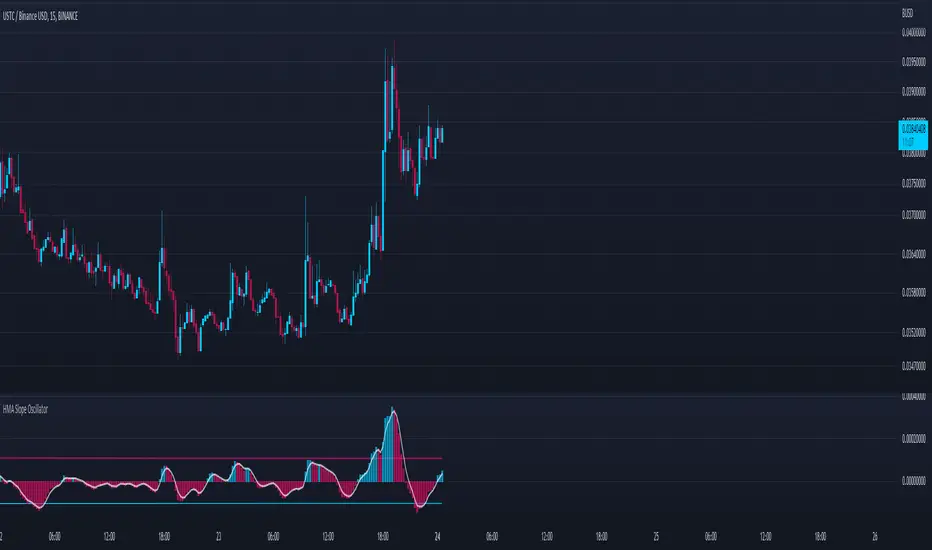
HMA Slope OscillatorA Hull Moving Average (HMA) slope oscillator. It uses a HMA slope to identify up/down trends. Usage is simple: adjust the HMA and signal length according to your needs. Long orders start when the bar changes from under (the zero line) to over the zero line. You can also spot "early" long entries when the bar moves close to the zero line. Short orders should be placed when a red bar appears after blue bars (top of the mountain).
"Play" with the length to find the best settings for your trading strategy.
** I have not added alerts. If you need alerts just let me know and I will be happy to update this indicator.
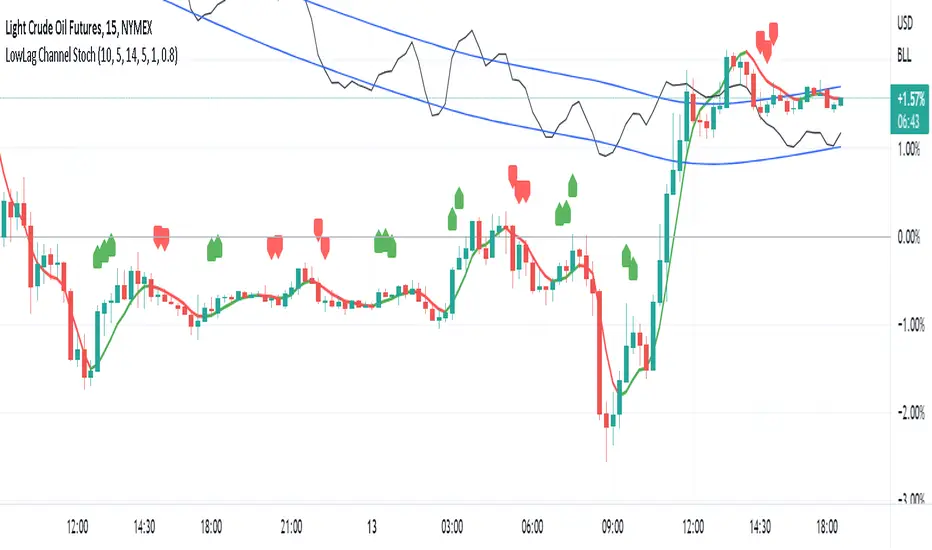
LowLag Channel StochThis study is an experiment utilizing the Hull Filter technique applied to an exponential moving average that has a relatively low lag to analyze trend activity. The Hull method is adjusted by the length.
A modified stochastic is used to help confirm buy/sell opportunities. The stochastic limits of 0.2 and 0.8 may be adjusted.
The up/down arrows indicate buy/sell opportunities. At the color change a buy/sell condition is indicated. Confirmation is by the stochastic passing through the appropriate limits. A third confirmation should be considered.
The initial signals are occasionally repeated because of the wait for 2 time instants. This is included because some buy/sell opportunities were missed without the wait.
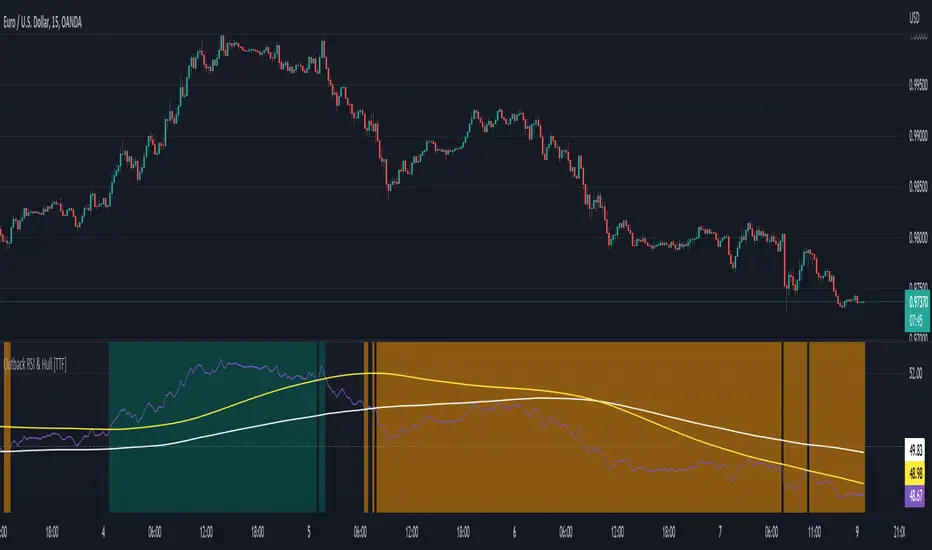
Outback RSI & Hull [TTF]This indicator was originally made to help users following along with one of our strategies that we call The Outback (hence the name).
One of the component indicators of that strategy is an RSI with a Hull Moving Average added on top of the RSI as an additional reference for the momentum of the RSI. Many people either had difficulty setting this up correctly, or were having issues with the Indicator on Indicator component, so we built this indicator to assist in that regard.
As we continued to use it, we found it to be a pretty sound momentum indicator that had much to offer by enhancing the more normal RSI, and wanted to make this indicator generally available to the public.
The basic premise of this indicator is as follows:
The core is a traditional RSI with a "normal" (usually Simple) moving average
The "secret sauce" is adding a 2nd moving average (a Hull Moving Average, inspired by Insilico's awesome Hull Suite) based off the RSI
By leveraging the RSI's position relative to both the Simple and Hull moving averages, you can better gauge the relative strength of the current momentum, as well as better visualize longer-term momentum direction and strength based on the moving average slopes and direction.
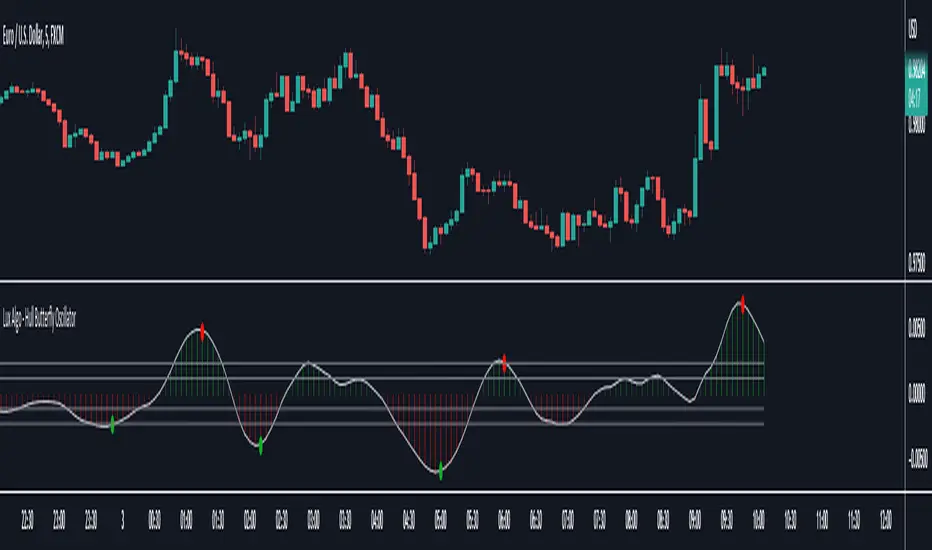
Hull Butterfly Oscillator [LuxAlgo]The Hull Butterfly Oscillator (HBO) is an oscillator constructed from the difference between a regular Hull Moving Average (HMA) and another with coefficients flipped horizontally.
Levels are obtained from cumulative means of the absolute value of the oscillator. These are used to return dots indicating potential reversal points.
Settings
Length: Number of past price inputs processed by the oscillator.
Levels Multiplier: Determine how far the levels are from 0.
Src: Input source of the indicator.
Usage
The oscillator can be used like most available oscillators. The sign of the HBO allows determining the current trend direction, while divergences with price might indicate potential reversals.
The displayed levels can additionally indicate whether the market is overbought or oversold. When the direction of the oscillator changes while being above the upper or lower level a red dot (if above upper level) or green dot (if under lower level) will be displayed, indicating a potential reversal.
Details
The name of the indicator is directly derived behind the coefficients used for its calculation. Displaying regular Hull coefficients alongside those flipped horizontally slightly resemble a butterfly, the difference between these sets of coefficients allows obtaining the HBO.
This operation allows to obtain a more structured impulse response, potentially giving less undesired performances on the frequency domain compared to simpler operation involving subtracting the HMA to a SMA, EMA or WMA.
STD-Filtered, Adaptive Exponential Hull Moving Average [Loxx]STD-Filtered, Adaptive Exponential Hull Moving Average is a Kaufman Efficiency Ratio Adaptive Hull Moving Average that uses EMA instead of WMA for its computation. I've also added standard deviation stepping to further smooth the signal. Using EMA instead of WMA turns the Hull into what's called the AEHMA. You can read more about the EHMA here: eceweb1.rutgers.edu
What is the traditional Hull Moving Average?
The Hull Moving Average (HMA) attempts to minimize the lag of a traditional moving average while retaining the smoothness of the moving average line. Developed by Alan Hull in 2005, this indicator makes use of weighted moving averages to prioritize more recent values and greatly reduce lag. The resulting average is more responsive and well-suited for identifying entry points.
What is Kaufman's Efficiency Ratio?
The Efficiency Ratio (ER) was first presented by Perry Kaufman in his 1995 book ‘Smarter Trading‘. It is calculated by dividing the price change over a period by the absolute sum of the price movements that occurred to achieve that change. The resulting ratio ranges between 0 and 1 with higher values representing a more efficient or trending market.
The value of the ER ranges between 0 and 1. It has the value of 1 when prices move in the same direction for the full time over which the indicator is calculated, e.g. n bars period. It has a value of 0 when prices are unchanged over the n periods. When prices move in wide swings within the interval, the sum of the denominator becomes very large compared to the numerator and ER approaches zero.
Some uses for ER:
A qualifier for a trend following trade; a trend is considered “persistent” only when RE is above a certain value, e.g. 0.3 or 0.4 .
A filter to screen out choppy stocks/markets, where breakouts are frequently “fakeouts”.
In an adaptive trading system, helping to determine whether to apply a trend following algorithm or a mean reversion algorithm.
It is used in the calculation of Kaufman’s Adaptive Moving Average (KAMA).
How to calculate the Hull Adaptive Moving Average (HAMA)
Find Signal to Noise ratio (SNR)
Normalize SNR from 0 to 1
Calculate adaptive alphas
Apply EMAs
Included
Bar coloring
Signals
Alerts
Loxx's Expanded Source Types
