Trinity Ultimate 10 MA Ribbons)I got tired of trying to find a multi MA ribbon that could also color change and allow different types, if it exists then I could not find it... So here it is...
The **Trinity Ultimate 10 MA Ribbon** is a highly customizable, professional-grade moving average ribbon that combines extreme flexibility with beautiful visual feedback. Designed for traders who want full control without sacrificing clarity, it allows you to build a ribbon using up to ten completely independent moving averages — each with its own length, type, color, thickness, and visibility setting — while automatically coloring both the lines and the fills according to bullish or bearish conditions.
### Key Features
- Ten fully independent moving averages that can be mixed and matched exactly as you want.
- Each MA has its own selectable type: EMA (default), SMA, WMA, HMA, RMA, VWMA, or ALMA — perfect for combining fast EMAs with a slow HMA or a classic 200-period SMA.
- Every single MA line automatically changes color in real time: bright green when price is above the MA (bullish) and red when price is below the MA (bearish), making trend strength instantly visible across all timeframes.
- Smart, reactive ribbon fills that appear only between consecutive enabled MAs. Turn any MA on or off and the fills instantly adjust — no gaps, no broken bands, no manual rework.
- Nine layered fills with individually adjustable transparency (default is gradually increasing transparency from the fastest to the slowest MA), creating a smooth, depth-like ribbon effect that looks stunning on any chart background.
- Fill color itself is dynamic: green for bullish candles (close > open) and red for bearish candles, or you can customize both colors to any shade you prefer.
- Full control over every visual element: base colors, line thickness (1–10), lengths, and show/hide toggles for each of the ten MAs.
- Clean and lightweight code that compiles instantly in Pine Script v5 and works on all markets and timeframes without lag.
In short, this is the most flexible and visually informative moving-average ribbon available on TradingView today. Whether you want a classic 9-EMA ribbon, a Guppy-style multiple-timeframe setup, a hybrid EMA/HMA mix, or just three or four key levels, the indicator adapts perfectly while always telling you at a glance where the bulls and bears are in control.
Rata-Rata Pergerakan Hull / Hull Moving Average (HMA)

Supertrend + MACD + HMAIndicator Description: Supertrend + MACD + HMA
General Summary
It is a composite technical indicator that combines three analysis tools to generate buy and sell signals in institutional trading. It uses confirmation from multiple indicators to increase the precision of market entries.
Components
1. Supertrend (ST)
Function: Identifies the main market trend (bullish or bearish)
Parameters: ATR Length 10, Factor 3.0
Visualization:
Green line = Bullish trend
Red line = Bearish trend
Semi-transparent green/red background that fills the area according to direction
How it works: Uses ATR (Average True Range) to calculate dynamic support and resistance bands
2. MACD (Moving Average Convergence Divergence)
Function: Measures price momentum and direction
Parameters: Fast 18, Slow 144, Signal Smoothing 9
Components:
MACD Line (orange): Difference between two EMAs
Signal Line (purple): EMA of the MACD
Histogram (green/red columns): Difference between MACD and its signal
Green = Positive histogram (bullish momentum)
Red = Negative histogram (bearish momentum)
3. HMA 100 (Hull Moving Average)
Function: Identifies support/resistance level and price direction
Parameters: Length 100
Visualization: Blue thick line
Characteristics:
Less lag than traditional moving averages
Price > HMA = Bullish trend
Price < HMA = Bearish trend
Signal Logic
🟢 BUY SIGNAL
Generated when ANY of these conditions is met:
Total Confluence:
MACD positive (histogram > 0)
Price above HMA 100
Supertrend in Bullish mode
Supertrend Change:
Supertrend changes from Bearish to Bullish
MACD remains positive
Price above HMA
Price Crossover:
Price crosses above HMA (at candle close)
Supertrend is in Bullish mode
MACD is positive
🔴 SELL SIGNAL
Generated when ANY of these conditions is met:
Total Confluence:
MACD negative (histogram < 0)
Price below HMA 100
Supertrend in Bearish mode
Supertrend Change:
Supertrend changes from Bullish to Bearish
MACD remains negative
Price Crossover:
Price crosses below HMA (at candle close)
Supertrend is in Bearish mode
MACD is negative
Important Features
✅ Single Signal Per Type
Once a BUY is generated, no other BUY is generated until a SELL appears
Avoids multiple entries in the same direction
✅ Crossover Detection
The indicator generates signals at candle close when price crosses HMA
Allows capturing quick market moves
✅ Trend Changes
Detects when Supertrend changes direction
Provides early exits from the market
✅ Automatic Alerts
Push notifications when BUY or SELL is generated
Ideal for automated trading

Responsive ADX (RADX)Introducing the new Responsive ADX (RADX), running with a (length = 9) and exactly how it differs from the standard built-in ADX you see on TradingView chart.
This indicator is still a true ADX at its core — it measures trend strength from 0 to 100 and uses the classic +DI and –DI lines to show direction — but it has been carefully "tuned" to react noticeably faster while staying smooth and usable. With the length set to 9, it is one of the most responsive versions you can run without turning into noise.
How it behaves differently from the normal (Wilder) ADX
Normal ADX is lagging, now this version gives you the same trend-strength reading 4–8 bars earlier than the built-in ADX. On a daily chart that can easily be 4–8 calendar days of earlier warning. On a 4-hour chart it’s 16–32 hours earlier. That head-start is the whole point.
The ADX line rises and falls much quicker.
When a new trend actually starts, you will often see this Fast ADX cross above 18–20 while the built-in ADX is still sleeping below 15. Conversely, when a trend dies, this version drops faster, so you’re not left holding a dead trade for an extra week.
The +DI and –DI lines are almost identical to the original, but lightly smoothed with a 5-period EMA (you can turn this off). This makes the DI crossovers cleaner and reduces whipsaws without adding meaningful lag.
The final ADX smoothing uses a lightweight Hull-style technique instead of Wilder’s very slow RMA. This is the main “secret sauce” that removes roughly half the lag while keeping the line smooth and readable.
Values are realistic and tradable.
With length 9 you will typically see:
– 0–18 = flat / chop
– 15–20 = emerging trend (background starts colouring)
– 20–50 = strong trend (most people take this as confirmation)
– above 50–60 only in very powerful moves (same as normal ADX)
The aqua / purple background only appears when both conditions are met: the correct DI is on top and Fast ADX is above your chosen “weak-to-trending” level (default 18).
This prevents the background from flashing on and off in sideways markets — exactly the same logic you liked in the original Trinity ADX, but now much earlier.
In very simple terms
Think of the normal built-in ADX as a diesel truck — reliable but slow to accelerate and slow to stop. Fast Responsive ADX with length 9 is the same truck with a turbocharger — same destination and same load capacity, but it gets up to speed twice as fast and brakes earlier when the road turns.
We would recommend people who switch to this version keep the (length 9–12) because the edge in timing is obvious on the chart.
That’s it — this is a new more responsive version, still-logical ADX!

Hull Moving Averages x 4Default Hull Lengths Included
The defaults are:
HMA 14
HMA 35
HMA 55
HMA 89
These are classic Fibonacci-style progression lengths, which work well for trend structure.

paigep.llc - SuperMASuperMA is a multi-layered moving-average and candle-coloring system that combines SMA, EMA, and optional HMA logic to help traders visualize trend shifts, pullbacks, and momentum changes in a clean, structured way.
The script includes multiple modules: trend-based moving averages, pullback signals, exit logic, and an optional HMA cross engine.
📌 Core Features
1. Full SMA + EMA Framework
The indicator plots multiple moving averages (8, 9, 13, 20, 50, 200) using both SMA and EMA calculations. Each line automatically colors bullish or bearish based on its relationship to the 200-period baseline.Users can toggle SMAs and EMAs independently for clearer chart control.
2. Main Trend Entry & Exit Logic (8×200 and 8×20)
Built-in crossover logic detects:
Main Entry: SMA 8 crossing above/below EMA 200
Main Exit: SMA 8 and SMA 20 cross (with an option to choose which SMA is treated as the “fast” leg)
A “first exit only” option allows the script to ignore additional exit signals until a new trend regime begins.
3. Pullback Module (20 SMA Interaction)
Pullback entries and exits occur when price crosses the 20 SMA during existing trend conditions.
This includes:
Pullback entries through the 20 SMA
Pullback exits back across the 20 SMA
Labels and candle colors are available for all pullback events.
4. Optional HMA Cross Module
A separate module allows traders to use two Hull Moving Averages (HMA) with customizable:
Lengths
Independent timeframes
Line colors
Cross-based entries and exits
This module has its own events, labels, and optional candle coloring.
5. Advanced Candle Coloring System
Candle coloring is layered in priority order, based on:
Main trend entries
Main exits
HMA entries
HMA exits
Pullback entries
Pullback exits
Trend-only candles (based on SMA 8 relative to EMA 200)
Users may also independently color wicks and borders.
6. Configurable Alerts (Fully Decoupled from Visuals)
Alerts are available for all major events, including:
Main Entries (8×200)
Main Exits (8×20)
Pullback Entries and Exits
HMA Entries and Exits
Bull or Bear Trend candles
Any colored candle event
Alerts can fire on bar close only or intrabar, depending on user preference.
📌 Use Cases
SuperMA helps traders visualize:
Trend direction using SMA/EMA structure
Momentum shifts through HMA crosses
Pullback zones around the 20 SMA
Early regime transitions based on the 8×200 relationship
Candle-level context through color-coded bars
The indicator works across all markets and timeframes.
⚠️ Note
This tool is for visual and analytical assistance only. It does not guarantee future performance and should be combined with additional analysis and risk management.

paigep.llc - SuperMA
SuperMA is a multi-layered moving-average and candle-coloring system that combines SMA, EMA, and optional HMA logic to help traders visualize trend shifts, pullbacks, and momentum changes in a clean, structured way.
The script includes multiple modules: trend-based moving averages, pullback signals, exit logic, and an optional HMA cross engine.
📌 Core Features
1. Full SMA + EMA Framework
The indicator plots multiple moving averages (8, 9, 13, 20, 50, 200) using both SMA and EMA calculations. Each line automatically colors bullish or bearish based on its relationship to the 200-period baseline. Users can toggle SMAs and EMAs independently for clearer chart control.
2. Main Trend Entry & Exit Logic (8×200 and 8×20)
Built-in crossover logic detects:
Main Entry: SMA 8 crossing above/below EMA 200
Main Exit: SMA 8 and SMA 20 cross (with an option to choose which SMA is treated as the “fast” leg)
A “first exit only” option allows the script to ignore additional exit signals until a new trend regime begins.
3. Pullback Module (20 SMA Interaction)
Pullback entries and exits occur when price crosses the 20 SMA during existing trend conditions.
This includes:
Pullback entries through the 20 SMA
Pullback exits back across the 20 SMA
Labels and candle colors are available for all pullback events.
4. Optional HMA Cross Module
A separate module allows traders to use two Hull Moving Averages (HMA) with customizable:
Lengths
Independent timeframes
Line colors
Cross-based entries and exits
This module has its own events, labels, and optional candle coloring.
5. Advanced Candle Coloring System
Candle coloring is layered in priority order, based on:
Main trend entries
Main exits
HMA entries
HMA exits
Pullback entries
Pullback exits
Trend-only candles (based on SMA 8 relative to EMA 200)
Users may also independently color wicks and borders.
6. Configurable Alerts (Fully Decoupled from Visuals)
Alerts are available for all major events, including:
Main Entries (8×200)
Main Exits (8×20)
Pullback Entries and Exits
HMA Entries and Exits
Bull or Bear Trend candles
Any colored candle event
Alerts can fire on bar close only or intrabar, depending on user preference.
Use Cases
SuperMA helps traders visualize:
Trend direction using SMA/EMA structure
Momentum shifts through HMA crosses
Pullback zones around the 20 SMA
Early regime transitions based on the 8×200 relationship
Candle-level context through color-coded bars
The indicator works across all markets and timeframes.
⚠️ Note
This tool is for visual and analytical assistance only. It does not guarantee future performance and should be combined with additional analysis and risk management.

EMA CrossMoving averages based trend indicator
Plots
Hull Moving average 34
Simple MA 200
Exponential MA 5
Signals on crossing and turn around points.

Buy/Sell Hull Crossover Signals (Fast & Slow)This indicator generates buy and sell signals using fast- and slow-period Hull Moving Averages (HMAs). A bullish signal occurs when the fast HMA crosses above the slow HMA, while a bearish signal triggers when it crosses below. To reduce repainting, you can optionally require confirmation on bar close.
The script includes visual tools such as a color-shifting ribbon between HMAs, optional background shading to show market regime, and lightweight buy/sell labels for quick signal recognition. Alerts are built in so you can automate notifications when crossover conditions occur.
Designed to be simple, responsive, and easy to layer into existing strategies, this indicator helps traders spot momentum shifts and trend transitions with clarity.

Colored HMASimply a colored HMA. Perfect for trend following systems in combination with other indicators.

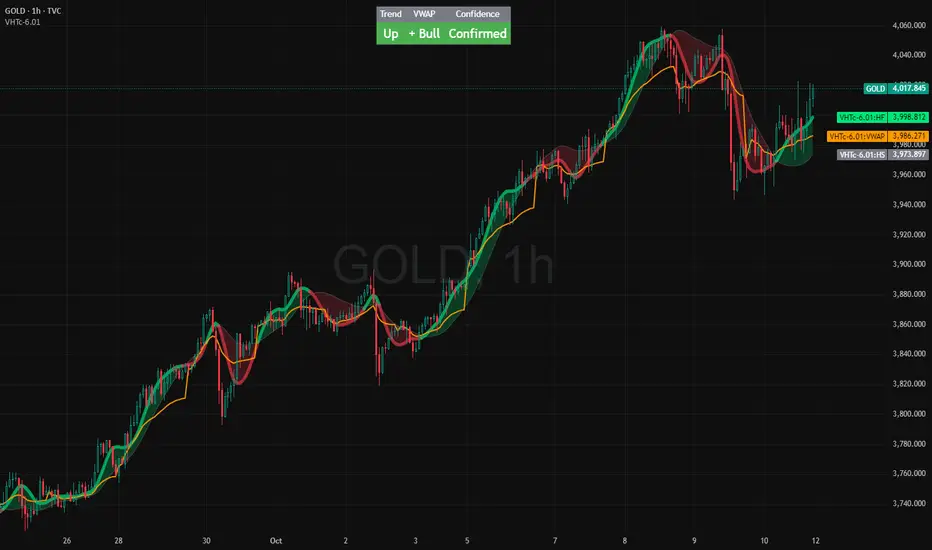
VWAP HMA Trends
It visually syncs Trend, VWAP, and Confidence — giving you instant clarity to trade with calm precision.
⚙️ The Three Core Gauges:
1. 📈 Trend Green for up, Red for down (Trend: Confirms direction)
2. 💰 VWAP Price vs. Volume Weighted Average Price. Institutional Fair Value. (Bull or Bear)
3. 🎯 Confidence Agreement between trend & VWAP. Dont fight the trend.
Bonus Feature: Confidence Turns 🟢 Confident when aligned, 🟡 Cautious when mixed.
Together, these create a clean, visual readout of the market’s health.
🧩 How to Use
Watch the Color Flow:
🟢 Green Cloud → Buyers in control.
🔴 Red Cloud → Sellers in control.
Check VWAP (Orange Line):
Price above VWAP → bullish strength.
Price below VWAP → bearish control.
Hovering at VWAP → indecision. Wait.
---
Act With Discipline:
Trade only when all gauges agree.
Add size only in Confident conditions.
Trim or tighten stops when it shifts to Cautious.
⚡ Quick Reference:
🟢 Green cloud + above VWAP + Confident | Uptrend continuation | Favor long bias
🔴 Red cloud + below VWAP + Confident | Downtrend continuation | Favor short bias
Mixed colors or Cautious: Wait or scale back
Cloud flips color: Possible shift. Reassess bias next bar
⚖️ Disclaimer: Educational and informational use only. Not financial advice. Always use independent judgment and position sizing.
TGFA Flexible Alerts Multi-MA CrossoversTGFA Flexible Alerts, Multi-MA Crossovers
Description
Flexible MA crossovers with BUY/SELL alerts, customizable candle colors, and an info box for ATR/volatility insights. Supports EMA/SMA/HMA/VWAP on any chart.
Overview
TGFA Flexible Alerts is a versatile Pine Script indicator for traders seeking customizable moving average (MA) crossovers, visual signals, and quick-reference metrics. It overlays crossover lines (e.g., fast EMA over slow SMA), generates BUY/SELL labels and alerts, colors candles based on themes, and includes an optional info box with ATR bands, support/resistance, and trend projections. Built for any symbol and timeframe (optimized for 1H intraday), it auto-detects Heikin Ashi charts and handles mixed MA types like responsive HMA with lagging EMAs. All logic uses built-in TA functions for reliability—no repainting on confirmed bars.
Key Features
MA Crossover Engine: Configurable lines (EMA, SMA, HMA, VWAP) with dynamic colors (HMA tints green/red based on slope). Enable/disable via inputs.
Invert Signals Toggle: Flips BUY/SELL logic for mixed MA setups (e.g., HMA as fast line over EMA).
Reasoning: Traditional crossovers assume a fast line (low lag) crossing above a slow line (high lag) for buys. HMA's hull design makes it ultra-responsive, so it may "lead" too aggressively—causing premature signals. Inverting aligns it with user intuition (e.g., HMA dipping below then recovering signals strength), reducing false positives in trending markets. Test on your pairs!
Visual Alerts: BUY/SELL labels at crossover price (with optional price display and offset adjustment).
Single MA Overlays: Independent plots for EMA/SMA/HMA/VWAP (length 0 to hide).
Info Box: Real-time table with current price, ±1/2 ATR bands, median price (over lookback), trend (SMA50 slope), volatility % (ATR normalized), support/resistance (recent highs/lows), and reversal projections (tied to SMA50 pivot for up/down bias).
Candle Coloring: 20+ themes (dark/light canvases) for bull/bear/reversal/low-volume bars—e.g., Emerald Blaze greens uptrends, dims on low vol. Toggle off for no changes.
Chart Source Flexibility: Auto-switches to Heikin Ashi if detected; manual override for Regular/HA.
Alerts fire on crossovers/crossunders (custom messages with ticker/interval). Open-source for forking.
How to Use
Add to Chart: Search in TradingView's public library, apply to any symbol (e.g., stocks, forex). Best on 1H for intraday, but works on daily/weekly too.
Setup Crossovers: Choose Line 1/2 types/lengths (e.g., HMA 9 over SMA 20). Enable "Invert Signals" if using HMA—prevents lag mismatches in volatile assets.
Alerts & Labels: Toggle labels for visuals; set TradingView alerts on "Buy"/"Sell" conditions. Use offset for crowded charts.
Info Box Insights: Enable for quick scans—e.g., enter long near support if trend is bullish and price > median. Adjust ATR length (default 14) for sensitivity.
Candle Themes: Pick a scheme (e.g., Neon Pulse for dark mode); it overrides bar colors without altering data.
Customization Tip: For HMA-heavy setups, invert + short lengths (5-9) catch turns early; pair with volume filter in alerts.
Limitations & Disclaimers - Designed for overlay on price charts; may overlap in tight ranges—adjust transparency via styles.
HMA can repaint intra-bar; signals confirm on close. Not back tested for all assets—validate with strategy tester.
Info box projections use SMA(50) as a trend pivot (same for up/down as reference); customize via code for advanced calcs. Candle colors are cosmetic only.
This is an analysis tool, not advice. Trading involves risk; combine with fundamentals/news. Past performance isn't indicative of future results. No liability for losses.
I'm still a newbie, so feedback encouraged!
Thank you!!
ThisGirl

HMA Trend Line (Croc Signal Line)HMA Trend Line (Croc Signal Line) — The Ultimate Hull Moving Average Trend Indicator
Full English description here:
What is the HMA Trend Line (Croc Signal Line)?
The HMA Trend Line (Croc Signal Line) is a powerful, adaptive trend indicator for TradingView, based on the Hull Moving Average (HMA). This indicator is designed to help traders identify real market trends with less lag and reduced noise compared to traditional moving averages like SMA (Simple Moving Average) and EMA (Exponential Moving Average).
Why use the HMA Trend Line?
+ Faster Trend Detection: The Hull Moving Average (HMA) responds more quickly to price action, giving you earlier buy and sell signals.
+ Smoother and Cleaner: It provides a visually clean trend line that avoids the choppiness of classic EMAs and SMAs.
+ Reduced Lag: The HMA Trend Line follows the market closer, helping you avoid late entries or exits and spot trend reversals sooner.
+ Dynamic Support and Resistance: Use the line as a dynamic support or resistance to manage trades and identify pullbacks or breakouts.
What does “Croc Signal Line” mean?
The “Croc” in Croc Signal Line stands for:
+ Clean
+ Responsive
+ Optimized
+ Curve
This highlights the unique advantage of this indicator: a curve that is both fast-reacting and smooth, helping traders focus on real trends and filter out market noise.
How does the Hull Moving Average (HMA) work?
The HMA was developed by Alan Hull and uses weighted moving averages and a unique calculation to deliver both responsiveness and smoothness. Unlike standard moving averages, the HMA reacts faster to new price moves and avoids false signals in ranging or volatile markets.
How to use the HMA Trend Line (Croc Signal Line) on TradingView?
+ Watch for price crossing above the trend line for potential bullish signals, and below for bearish signals.
+ Use on any timeframe: from 1-minute scalping to daily, weekly, or even monthly charts.
+ Works with all asset classes: Forex, stocks, indices, cryptocurrencies, commodities, and futures.
+ Combine with other indicators (like Stochastics, RSI, or volume) for confirmation and to build your unique trading strategy.
+ Adjust the Signal Line Period for your market and style: shorter periods for faster markets, longer for smoother trends.
Who should use this indicator?
+ Day traders, swing traders, and long-term investors looking for reliable, actionable trend signals.
+ Anyone seeking a cleaner, more responsive alternative to the classic moving averages.
+ Traders who want a simple, visually clear way to filter out market noise and see real price direction.
Disclaimer:
This indicator is for educational and study purposes only. Please perform your own backtesting and analysis before using it in live trading. This script does not constitute financial advice. Use at your own risk.
--------

RSI-BBGun-v6.1RSI BB Gun – Operator's Guide
“Eyes on target. Wait for the right moment. Then strike.”
________________________________________
🎯 Mission Objective
RSI BB Gun identifies extreme market conditions using RSI and Bollinger Bands, then overlays trend and volatility intelligence so you know when the setup is real.
The ❌ is your target acquisition signal—price just moved from an extreme zone back into play. Now you’ve got a clean radar lock.
________________________________________
📡 How to Operate
🟣 Step 1: Watch for the ❌'s (Black X = RSI & Bollinger Band Extremes Encountered)
• The Purple X means price and RSI are both stretched—and just snapped back into range.
• The target is now in the cross hairs and potentially ready for engagement.
🟥 Step 2: Confirm the Trend
• The thick ribbon tells you if the trend is with you:
o 🟢 Green = Uptrend. Focus on long setups.
o 🔴 Red = Downtrend. Focus on puts or short plays.
• Align with trend. Only engage when the field favors your position.
🔺 Step 3: Evaluate Signal Context
• Green Triangles = price just crossed below lower Bollinger Band (oversold).
• Red Triangles = price crossed above upper Band (overbought).
• Horizontal Lines Disappeared = The bar after the green or red horizontal line disappears means its time. We patiently wait for this as it means the momentum may be changing.
• These are your early indicators—they scout the setup on the GO / NO GO DECISION.
• ❌ + triangle + trend = clean shot.
________________________________________
☁️ Avoid These Situations
• ❌ in a choppy/no-trend zone = false alarm. Don’t engage.
• Repeated black ❌s without a purple ❌confirmation = low conviction. Let it go.
________________________________________
________________________________________
🪖 Operator's Mindset
“You don’t chase trades. You stalk them. When the ❌ flashes, the system has found a target. What you do next is up to your discipline, your tools, and your plan.”
________________________________________
Note: This is a free version. Upcoming paid version includes multi-timeframes working together. Multiple strategies. Volatility meter. Make money and master the BB Gun so that you can elevate to the Snipers weapon.
🔒 Want More Firepower?
Upgraded version coming soon. Unlocks next-gen targeting tools:
• Multi-timeframe RSI intelligence in a live dashboard
• Precision-timed combo signals based on layered volatility + RSI logic
• Advanced trend filters, trade zone overlays, and sniper-level entry indicators
• Ideal for swing traders and options strategists who want clarity under pressure
💥 Budget-friendly. No subscription. Upgrade when you're ready to go Pro.
Tip: Make 4+ trades mastering this setup. Then use a small portion of the trades to gain more features. Always be in a position you cannot lose.
🆚 Why This Beats Standard RSI/BB Tools
Mission Feature Basic Indicators RSI Ribbon Lite
Trend Confirmation ❌ ✅ Ribbon Overlay
Multi-Timeframe Awareness ❌ ✅ 5-Timeframe RSI Grid
Volatility Confirmation ❌ ✅ Weighted ATR Scoring
Combo Signal Alerts ❌ ✅ ❌ Reentry Combo Alerts
TradingView Alerts ❌ ✅ Built-In Radar Ping
#rsi #bb #bollingerbands #hull ma #trend

Normalized EMA Cycle (NEC)Normalized EMA Cycle (NEC)
The Normalized EMA Cycle (NEC) is a versatile momentum and trend reversal tool designed to detect high-probability turning points and gauge the strength of price cycles.
It combines fast and slow Exponential Moving Averages (EMAs), dynamic normalization, and adaptive transparency to create clear, intuitive reversal signals on the chart.
🔹 How It Works
EMA Differencing
The NEC calculates the difference between a fast EMA and a slower EMA:
Fast EMA Length (default 6) captures short-term momentum.
Slow EMA Length (default 16) tracks broader trends.
The slope of this difference identifies accelerating or decelerating momentum.
Normalization to 0–100 Scale
The raw EMA difference is scaled relative to the recent Alpha Period range (default 6 bars).
This transforms the value into a normalized oscillator ranging between 0 and 100.
A 3-period Hull Moving Average (HMA) smooths this series to reduce noise.
Overbought and Oversold Thresholds
By default:
Overbought Level: 75
Oversold Level: 25
Crossovers of these levels are used to detect potential reversals.
Adaptive Alpha Adjustment
The normalized value is transformed into an “Alpha Schaff” line, dynamically shifting between price and normalized cycles.
This helps the model adjust to different volatility regimes.
Trend Reversal Logic
Bullish Reversal:
Normalized oscillator crosses above the Oversold Level.
EMA difference slope is positive.
Bearish Reversal:
Normalized oscillator crosses below the Overbought Level.
EMA difference slope is negative.
Additional confirmation comes when price crosses the Alpha Schaff line in the direction of momentum.
Dynamic Confidence Visualization
The indicator calculates a trend confidence score based on the normalized separation of the EMAs.
The transparency of reversal markers dynamically adjusts:
Strong trends = more opaque signals
Weak trends = more transparent signals
🔹 How to Use
✅ Entries
Long Signal: Aqua upward label appears below a bar.
Conditions:
Bullish reversal or price crossing above Alpha Schaff
Normalized slope is rising
Short Signal: Fuchsia downward label appears above a bar.
Conditions:
Bearish reversal or price crossing below Alpha Schaff
Normalized slope is falling
✅ Trend Strength
The less transparent the signal marker, the more significant the trend.
✅ Customization
Use the inputs to fine-tune sensitivity:
Shorter EMAs: Faster signals
Longer EMAs: Smoother trends
Alpha Period: Adjusts the lookback range for normalization
🟢 Best Practices
NEC is best used in combination with other trend confirmation tools (e.g., price structure, volume, or higher timeframe EMAs).
Avoid relying on signals in extremely low-volume or choppy ranges.
⚠️ Disclaimer
This script is intended for educational purposes only and does not constitute financial advice. Trading involves substantial risk, and you should consult your financial advisor before making any investment decisions.

Hull For LoopHull For Loop is a sophisticated trend-following indicator that combines the smoothness of Hull Moving Averages with advanced trend detection algorithms and robust confirmation mechanisms.
## How It Works
At its foundation, Hull For Loop employs a custom-calculated Hull Moving Average using weighted moving average for-loops to achieve optimal smoothness and responsiveness. The system operates through three distinct layers: Hull MA calculation with adjustable smoothing multipliers, advanced trend detection using ATR-based slope thresholds, and multi-bar trend confirmation to filter false breakouts.
The logic flow is elegantly simple yet powerful:
- Hull Calculation combines half-period and full-period weighted moving averages, then applies square-root smoothing for enhanced responsiveness
- Trend Detection analyzes Hull slope against dynamic ATR-based thresholds, classifying market direction as bullish, bearish, or neutral
- Confirmation System requires sustained directional movement across multiple bars before triggering signals, dramatically reducing whipsaws
When Hull slope exceeds the positive threshold, bullish conditions emerge. When it falls below the negative threshold, bearish momentum takes control. The multi-bar confirmation ensures only sustained moves generate actionable signals, making this system ideal for trend-following strategies across volatile markets.
The advanced slope analysis mechanism adapts to market volatility through ATR integration, ensuring sensitivity remains optimal during both high-volatility breakouts and low-volatility consolidations, delivering consistent performance across varying market conditions.
## Features
- Custom Hull Implementation : For-loop calculations for precise weighted moving average control and enhanced smoothness
- Dynamic Trend Detection : ATR-based slope analysis automatically adjusts sensitivity to market volatility conditions
- Multi-Bar Confirmation : Configurable confirmation periods (1-5 bars) eliminate false signals and reduce trading noise
- Advanced Visual System : Dynamic color coding, optional arrows, and statistics table for comprehensive market visualization
- Optimized for Bitcoin : Extensively backtested parameters delivering 128.58% returns with 55% drawdown reduction versus buy-and-hold
- Flexible Configuration : Hull length (1-200), smoothing multiplier (0.1-3.0), sensitivity (1-10), and confirmation settings
- Professional Alerts : Comprehensive alert system for trend changes and entry signals with strength percentages
- Real-time Analytics : Optional statistics table displaying trend direction, strength, Hull value, and current price
## Signal Generation
Hull For Loop generates multiple signal types for comprehensive trend analysis and precise entry/exit timing:
Primary Signals : Confirmed trend changes from bullish to bearish or vice versa - highest probability directional moves
Entry Signals : Initial trend confirmation after multi-bar validation - optimal position entry points
Strength Indicators : Real-time trend strength percentages based on directional momentum over lookback periods
Visual Confirmations : Color-coded Hull line providing instant visual trend status
The confirmation system adds crucial reliability - signals must persist through the specified confirmation period before activation, ensuring only sustained moves trigger trading decisions rather than temporary price fluctuations.
## Visual Implementation
The indicator employs sophisticated visual elements for immediate trend comprehension and professional chart presentation:
- Dynamic Hull Line : Color-changing line (green/red/gray) with configurable width reflecting current trend status
- Optional Directional Arrows : Triangle markers below/above bars marking confirmed trend changes and entry points (disabled by default)
- Statistics Panel : Optional real-time table showing trend direction, strength percentage, Hull value, and current price
- Professional Color Scheme : Customizable bullish (green), bearish (red), and neutral (gray) color system
## Alerts
Hull For Loop includes comprehensive alert conditions for automated trading integration:
- Hull Trend Change - Confirmed trend direction shift with strength percentage
- Hull BUY Signal - Bullish trend confirmation with price and strength data
- Hull SELL Signal - Bearish trend confirmation with price and strength data
- Alert Frequency - Once per bar to prevent spam while maintaining accuracy
All alerts include contextual information: trend direction, current price, and trend strength percentage for informed decision-making.
## Use Cases
Trend Following : Optimized for sustained directional moves with superior drawdown protection compared to buy-and-hold strategies
Swing Trading : Multi-bar confirmation eliminates false breakouts while capturing significant trend changes
Position Trading : Smooth Hull calculation provides stable signals for longer-term directional positioning
Risk Management : Advanced confirmation system dramatically reduces whipsaw trades and false signals
Crypto Trading : Specifically optimized for Bitcoin with parameters delivering exceptional historical performance
The system demonstrates exceptional performance across volatile assets.

Levels Of Interest------------------------------------------------------------------------------------
LEVELS OF INTEREST (LOI)
TRADING INDICATOR GUIDE
------------------------------------------------------------------------------------
Table of Contents:
1. Indicator Overview & Core Functionality
2. VWAP Foundation & Historical Context
3. Multi-Timeframe VWAP Analysis
4. Moving Average Integration System
5. Trend Direction Signal Detection
6. Visual Design & Display Features
7. Custom Level Integration
8. Repaint Protection Technology
9. Practical Trading Applications
10. Setup & Configuration Recommendations
------------------------------------------------------------------------------------
1. INDICATOR OVERVIEW & CORE FUNCTIONALITY
------------------------------------------------------------------------------------
The LOI indicator combines multiple VWAP calculations with moving averages across different timeframes. It's designed to show where institutional money is flowing and help identify key support and resistance levels that actually matter in today's markets.
Primary Functions:
- Multi-timeframe VWAP analysis (Daily, Weekly, Monthly, Yearly)
- Advanced moving average integration (EMA, SMA, HMA)
- Real-time trend direction detection
- Institutional flow analysis
- Dynamic support/resistance identification
Target Users: Day traders, swing traders, position traders, and institutional analysts seeking comprehensive market structure analysis.
------------------------------------------------------------------------------------
2. VWAP FOUNDATION & HISTORICAL CONTEXT
------------------------------------------------------------------------------------
Historical Development: VWAP started in the 1980s when big institutional traders needed a way to measure if they were getting good fills on their massive orders. Unlike regular price averages, VWAP weighs each price by the volume traded at that level. This makes it incredibly useful because it shows you where most of the real money changed hands.
Mathematical Foundation: The basic math is simple: you take each price, multiply it by the volume at that price, add them all up, then divide by total volume. What you get is the true "average" price that reflects actual trading activity, not just random price movements.
Formula: VWAP = Σ(Price × Volume) / Σ(Volume)
Where typical price = (High + Low + Close) / 3
Institutional Behavior Patterns:
- When price trades above VWAP, institutions often look to sell
- When it's below, they're usually buying
- Creates natural support and resistance that you can actually trade against
- Serves as benchmark for execution quality assessment
------------------------------------------------------------------------------------
3. MULTI-TIMEFRAME VWAP ANALYSIS
------------------------------------------------------------------------------------
Core Innovation: Here's where LOI gets interesting. Instead of just showing daily VWAP like most indicators, it displays four different timeframes simultaneously:
**Daily VWAP Implementation**:
- Resets every morning at market open
- Provides clearest picture of intraday institutional sentiment
- Primary tool for day trading strategies
- Most responsive to immediate market conditions
**Weekly VWAP System**:
- Resets each Monday (or first trading day)
- Smooths out daily noise and volatility
- Perfect for swing trades lasting several days to weeks
- Captures weekly institutional positioning
**Monthly VWAP Analysis**:
- Resets at beginning of each calendar month
- Captures bigger institutional rebalancing at month-end
- Fund managers often operate on monthly mandates
- Significant weight in intermediate-term analysis
**Yearly VWAP Perspective**:
- Resets annually for full-year institutional view
- Shows long-term institutional positioning
- Where pension funds and sovereign wealth funds operate
- Critical for major trend identification
Confluence Zone Theory: The magic happens when multiple VWAP levels cluster together. These confluence zones often become major turning points because different types of institutional money all see value at the same price.
------------------------------------------------------------------------------------
4. MOVING AVERAGE INTEGRATION SYSTEM
------------------------------------------------------------------------------------
Multi-Type Implementation: The indicator includes three types of moving averages, each with its own personality and application:
**Exponential Moving Averages (EMAs)**:
- React quickly to recent price changes
- Displayed as solid lines for easy identification
- Optimal performance in trending market conditions
- Higher sensitivity to current price action
**Simple Moving Averages (SMAs)**:
- Treat all historical data points equally
- Appear as dashed lines in visual display
- Slower response but more reliable in choppy conditions
- Traditional approach favored by institutional traders
**Hull Moving Averages (HMAs)**:
- Newest addition to the system (dotted line display)
- Created by Alan Hull in 2005
- Solves classic moving average dilemma: speed vs. accuracy
- Manages to be both responsive and smooth simultaneously
Technical Innovation: Alan Hull's solution addresses the fundamental problem where moving averages are either too slow (missing moves) or too fast (generating false signals). HMAs achieve optimal balance through weighted calculation methodology.
Period Configuration:
- 5-period: Short-term momentum assessment
- 50-period: Intermediate trend identification
- 200-period: Long-term directional confirmation
------------------------------------------------------------------------------------
5. TREND DIRECTION SIGNAL DETECTION
------------------------------------------------------------------------------------
Real-Time Momentum Analysis: One of LOI's best features is its real-time trend detection system. Next to each moving average, visual symbols provide immediate trend assessment:
Symbol System:
- ▲ Rising average (bullish momentum confirmation)
- ▼ Falling average (bearish momentum indication)
- ► Flat average (consolidation or indecision period)
Update Frequency: These signals update in real-time with each new price tick and function across all configured timeframes. Traders can quickly scan daily and weekly trends to assess alignment or conflicting signals.
Multi-Timeframe Trend Analysis:
- Simultaneous daily and weekly trend comparison
- Immediate identification of trend alignment
- Early warning system for potential reversals
- Momentum confirmation for entry decisions
------------------------------------------------------------------------------------
6. VISUAL DESIGN & DISPLAY FEATURES
------------------------------------------------------------------------------------
Color Psychology Framework: The color scheme isn't random but based on psychological associations and trading conventions:
- **Blue Tones**: Institutional neutrality (VWAP levels)
- **Green Spectrum**: Growth and stability (weekly timeframes)
- **Purple Range**: Longer-term sophistication (monthly analysis)
- **Orange Hues**: Importance and attention (yearly perspective)
- **Red Tones**: User-defined significance (custom levels)
Adaptive Display Technology: The indicator automatically adjusts decimal places based on the instrument you're trading. High-priced stocks show 2 decimals, while penny stocks might show 8. This keeps the display incredibly clean regardless of what you're analyzing - no cluttered charts or overwhelming information overload.
Smart Labeling System: Advanced positioning algorithm automatically spaces all elements to prevent overlap, even during extreme zoom levels or multiple timeframe analysis. Every level stays clearly readable without any visual chaos disrupting your analysis.
------------------------------------------------------------------------------------
7. CUSTOM LEVEL INTEGRATION
------------------------------------------------------------------------------------
User-Defined Level System: Beyond the calculated VWAP and moving average levels, traders can add custom horizontal lines at any price point for personalized analysis.
Strategic Applications:
- **Psychological Levels**: Round numbers, previous significant highs/lows
- **Technical Levels**: Fibonacci retracements, pivot points
- **Fundamental Targets**: Analyst price targets, earnings estimates
- **Risk Management**: Stop-loss and take-profit zones
Integration Features:
- Seamless incorporation with smart labeling system
- Custom color selection for visual organization
- Extension capabilities across all chart timeframes
- Maintains display clarity with existing indicators
------------------------------------------------------------------------------------
8. REPAINT PROTECTION TECHNOLOGY
------------------------------------------------------------------------------------
Critical Trading Feature: This addresses one of the most significant issues in live trading applications. Most multi-timeframe indicators "repaint," meaning they display different signals when viewing historical data versus real-time analysis.
Protection Benefits:
- Ensures every displayed signal could have been traded when it appeared
- Eliminates discrepancies between historical and live analysis
- Provides realistic performance expectations
- Maintains signal integrity across chart refreshes
Configuration Options:
- **Protection Enabled**: Default setting for live trading
- **Protection Disabled**: Available for backtesting analysis
- User-selectable toggle based on analysis requirements
- Applies to all multi-timeframe calculations
Implementation Note: With protection enabled, signals may appear one bar later than without protection, but this ensures all signals represent actionable opportunities that could have been executed in real-time market conditions.
------------------------------------------------------------------------------------
9. PRACTICAL TRADING APPLICATIONS
------------------------------------------------------------------------------------
**Day Trading Strategy**:
Focus on daily VWAP with 5-period moving averages. Look for bounces off VWAP or breaks through it with volume. Short-term momentum signals provide entry and exit timing.
**Swing Trading Approach**:
Weekly VWAP becomes your primary anchor point, with 50-period averages showing intermediate trends. Position sizing based on weekly VWAP distance.
**Position Trading Method**:
Monthly and yearly VWAP provide broad market context, while 200-period averages confirm long-term directional bias. Suitable for multi-week to multi-month holdings.
**Multi-Timeframe Confluence Strategy**:
The highest-probability setups occur when daily, weekly, and monthly VWAPs cluster together, especially when multiple moving averages confirm the same direction. These represent institutional consensus zones.
Risk Management Integration:
- VWAP levels serve as dynamic stop-loss references
- Multiple timeframe confirmation reduces false signals
- Institutional flow analysis improves position sizing decisions
- Trend direction signals optimize entry and exit timing
------------------------------------------------------------------------------------
10. SETUP & CONFIGURATION RECOMMENDATIONS
------------------------------------------------------------------------------------
Initial Configuration: Start with default settings and adjust based on individual trading style and market focus. Short-term traders should emphasize daily and weekly timeframes, while longer-term investors benefit from monthly and yearly level analysis.
Transparency Optimization: The transparency settings allow clear price action visibility while maintaining level reference points. Most traders find 70-80% transparency optimal - it provides a clean, unobstructed view of price movement while maintaining all critical reference levels needed for analysis.
Integration Strategy: Remember that no indicator functions effectively in isolation. LOI provides excellent context for institutional flow and trend direction analysis, but should be combined with complementary analysis tools for optimal results.
Performance Considerations:
- Multiple timeframe calculations may impact chart loading speed
- Adjust displayed timeframes based on trading frequency
- Customize color schemes for different market sessions
- Regular review and adjustment of custom levels
------------------------------------------------------------------------------------
FINAL ANALYSIS
------------------------------------------------------------------------------------
Competitive Advantage: What makes LOI different is its focus on where real money actually trades. By combining volume-weighted calculations with multiple timeframes and trend detection, it cuts through market noise to show you what institutions are really doing.
Key Success Factor: Understanding that different timeframes serve different purposes is essential. Use them together to build a complete picture of market structure, then execute trades accordingly.
The integration of institutional flow analysis with technical trend detection creates a comprehensive trading tool that addresses both short-term tactical decisions and longer-term strategic positioning.
------------------------------------------------------------------------------------
END OF DOCUMENTATION
------------------------------------------------------------------------------------

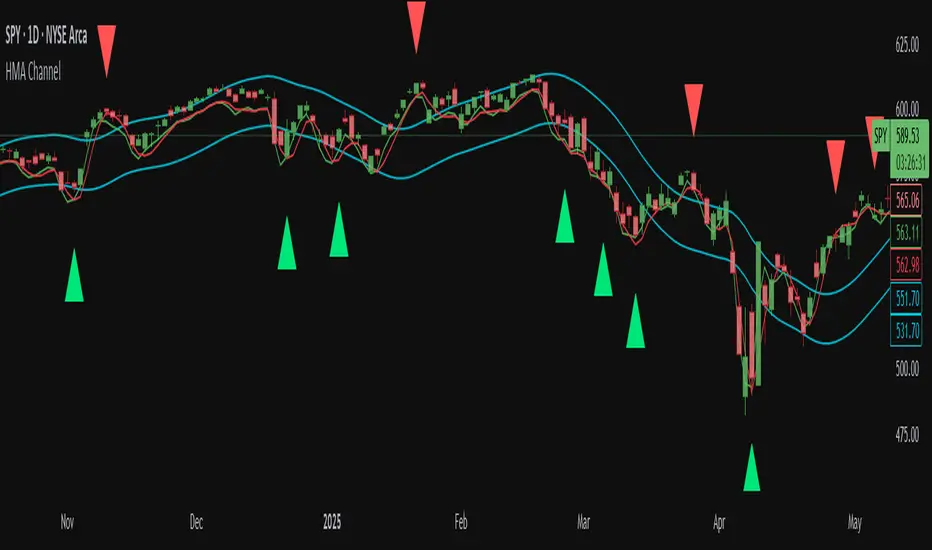
Hull MA Channel with Filtered CrossoversI've created an indicator that let's you create a HMA channel with 2 displaced HMA (A/B). As well as a HMA crossover set (C/D).
Here's how it works:
The HMA crossovers from C and D will not signal unless they are outside of the channel of A and B. As a matter of fact, NO buy signal whatsoever will occur above the channel and NO sell signal will occur below the channel.
The crossover HMA pair (C/D) can have their lengths adjusted to the 0.00 decimal point for VERY fine tuning of the crossovers.
(edit-it doesn't fine tune to the .00. This must not be a feature that is able to be utilized. I tried) The length adjustment still works to the nearest whole number. The .00 are mute :(
In keeping with that same logic, you can adjust the displacement of the channel independently to the 0.00 decimal, again for VERY fine tuning.
This is great for reversals while eliminating noise from false signals, keeping the chart nice and clean. Should be used in combination with other indicators for the best confirmations.
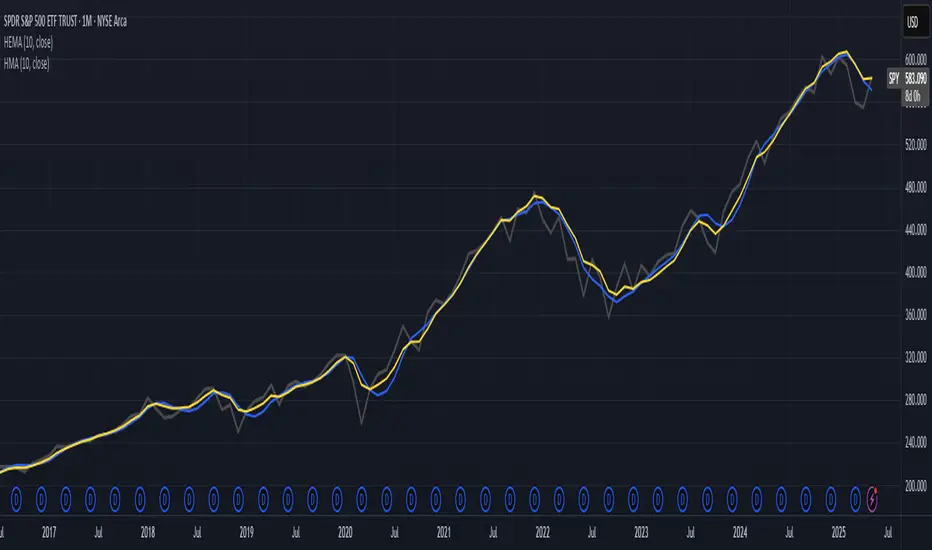
Hull-Exponential Moving Average (HEMA)The Hull Exponential Moving Average (HEMA) is an experimental technical indicator that uses a sequence of Exponential Moving Averages (EMAs) with the same logic as HMA - except with EMAs and not WMAs. It aims to create a responsive yet smooth trend indicator than HMA.
HEMA applies a multi-stage EMA process. Initial EMAs are calculated using alphas derived from logarithmic relationships and the input period. Their outputs are then combined in a de-lagging step, which itself uses a logarithmically derived ratio. A final EMA smoothing pass is then applied to this de-lagged series. This creates a moving average that responds quickly to genuine price changes while maintaining effective noise filtering. The specific alpha calculations and the de-lagging formula contribute to its balance between responsiveness and smoothness.
▶️ **Core Concepts**
Logarithmically-derived alphas: Alpha values for the three EMA stages are derived using natural logarithms and specific formulas related to the input period **N**.
Three-stage EMA process: The calculation involves:
An initial EMA (using **αS**) on the source data.
A second EMA (using **αF**) also on the source data.
A de-lagging step that combines the outputs of the first two EMAs using a specific ratio **r**.
A final EMA (using **αFin**) applied to the de-lagged series.
Specific de-lagging formula: Utilizes a constant ratio **r = ln(2.0) / (1.0 + ln(2.0))** to combine the outputs of the first two EMAs, aiming to reduce lag.
Optimized final smoothing: The alpha for the final EMA (**αFin**) is calculated based on the square root of the period **N**.
Warmup compensation: The internal EMA calculations include a warmup mechanism to provide more accurate values from the initial bars. This involves tracking decay factors (**eS**, **eF**, **eFin**) and applying a compensation factor **1.0 / (1.0 - e_decay)** during the warmup period. A shared warmup duration is determined by the smallest alpha among the three stages.
HEMA achieves its characteristics through this multi-stage EMA process, where the specific alpha calculations and the de-lagging step are key to its responsiveness and smoothness.
▶️ **Common Settings and Parameters**
Period (**N**): Default: 10 | Base lookback period for all alpha calculations | When to Adjust: Increase for longer-term trends and more smoothness, decrease for shorter-term signals and more responsiveness
Source: Default: Close | Data point used for calculation | When to Adjust: Change to HL2, HLC3, or OHLC4 for different price representations
Pro Tip: The HEMA's behavior is sensitive to the **Period** setting due to the non-linear relationships in its alpha calculations. Experiment with values around your typical MA periods. Small changes in **N** can have a noticeable impact, especially for smaller **N** values.
▶️ **Calculation and Mathematical Foundation**
Simplified explanation:
HEMA calculates its value through a sequence of three Exponential Moving Averages (EMAs) with specially derived smoothing factors (alphas).
Two initial EMAs are calculated from the source price, using alphas **αS** and **αF**.
The outputs of these two EMAs are combined into a "de-lagged" series.
This de-lagged series is then smoothed by a third EMA, using alpha **αFin**, to produce the final HEMA value.
All internal EMAs use a warmup compensation mechanism for improved accuracy on early bars.
Technical formula (let **N** be the input period):
1. Alpha for the first EMA (slow component related):
αS = 3.0 / (2.0 * N - 1.0)
2. Lambda for **αS** (intermediate value):
λS = -ln(1.0 - αS)
Note: **αS** must be less than 1, which implies 2N-1 > 3 or N > 2 for **λS** to be well-defined without NaN from ln of non-positive number. The code uses nz() for robustness but the formula implies this constraint.
3. De-lagging ratio **r**:
r = ln(2.0) / (1.0 + ln(2.0))
(This is a constant, approximately 0.409365)
4. Alpha for the second EMA (fast component related):
αF = 1.0 - exp(-λS / r)
5. Alpha for the final EMA smoothing:
αFin = 2.0 / (sqrt(N) / 2.0 + 1.0)
6. Applying the stages:
**OutputS = EMA_internal(source, αS, eS_state, emaS_state)**
**OutputF = EMA_internal(source, αF, eF_state, emaF_state)**
8. Calculate the de-lagged series:
DeLag = (OutputF / (1.0 - r)) - (r * OutputS / (1.0 - r))
9. Calculate the final HEMA:
HEMA = EMA_internal(DeLag, αFin, eFin_state, emaFin_state)
🔍 Technical Note: The HEMA implementation uses a shared warmup period controlled by **aMin** (the minimum of **αS**, **αF**, **αFin**). During this period, each internal EMA stage still tracks its own decay factor (**eS**, **eF**, **eFin**) to apply the correct compensation. The **nz()** function is used in the code to handle potential NaN values from alpha calculations if **N** is very small (e.g., **N=1** would make **αS=3**, **1-αS = -2**, **ln(-2)** is NaN).
▶️ **Interpretation Details**
HEMA provides several key insights for traders:
When price crosses above HEMA, it often signals the beginning of an uptrend
When price crosses below HEMA, it often signals the beginning of a downtrend
The slope of HEMA provides insight into trend strength and momentum
HEMA creates smooth dynamic support and resistance levels during trends
Multiple HEMA lines with different periods can identify potential reversal zones
HEMA is particularly effective for trend following strategies where both responsiveness and noise reduction are important. It provides earlier signals than traditional EMAs while exhibiting less whipsaw than standard HMA in choppy market conditions. The indicator excels at identifying the underlying trend direction while filtering out minor price fluctuations.
▶️ **Limitations and Considerations**
Experimental nature: As an experimental indicator, HEMA may behave differently from established HMA in certain market conditions
Lag characteristics: While designed to reduce lag, HEMA may exhibit slightly more lag than HMA in some scenarios due to the long tail of EMA
Mathematical complexity: The multi-stage calculation with specialized alpha parameters makes the behavior less intuitive to understand
Parameter sensitivity: Performance can vary significantly with different period settings
Complementary tools: Works best when combined with volume analysis or momentum indicators for confirmation
▶️ **References**
Hull, A. (2005). "Hull Moving Average," Technical Analysis of Stocks & Commodities .
RetryClaude can make mistakes. Please double-check responses.
UT Bot + Hull MA Confirmed Signal DelayOverview
This indicator is designed to detect high-probability reversal entry signals by combining "UT Bot Alerts" (UT Bot Alerts script adapted from QuantNomad - Originally developed by Yo_adriiiiaan and idea of original code for "UT Bot Alerts" from HPotter ) with confirmation from a Hull Moving Average (HMA) Developed by Alan Hull . It focuses on capturing momentum shifts that often precede trend reversals, helping traders identify potential entry points while filtering out false signals.
🔍 How It Works
This strategy operates in two stages:
1. UT Bot Momentum Trigger
The foundation of this script is the "UT Bot Alerts" , which uses an ATR-based trailing stop to detect momentum changes. Specifically:
The script calculates a dynamic stop level based on the Average True Range (ATR) multiplied by a user-defined sensitivity factor (Key Value).
When price closes above this trailing stop and the short-term EMA crosses above the stop, a potential buy setup is triggered.
Conversely, when price closes below the trailing stop and the short-term EMA crosses below, a potential sell setup is triggered.
These UT Bot alerts are designed to identify the initial shift in market direction, acting as the first filter in the signal process.
2. Hull MA Confirmation
To reduce noise and false triggers from the UT Bot alone, this script delays the entry signal until price confirms the move by crossing the Hull Moving Average (or its variants: HMA, THMA, EHMA) in the same direction as the UT Bot trigger:
A Buy Signal is generated only when:
A UT Bot Buy condition is active, and
The price closes above the Hull MA.
Or, if a UT Bot Buy condition was recently triggered but price hadn’t yet crossed above the Hull MA, a delayed buy is signaled when price finally breaks above it.
A Sell Signal is generated only when:
A UT Bot Sell condition is active, and
The price closes below the Hull MA.
Similarly, a delayed sell signal can occur if price breaks below the Hull MA shortly after a UT Bot Sell trigger.
This dual-confirmation process helps traders avoid premature entries and improves the reliability of reversal signals.
📈 Best Use Cases
Reversal Trading: This strategy is particularly well-suited for catching early trend reversals rather than trend continuations. It excels at identifying momentum pivots that occur after pullbacks or exhaustion moves.
Heikin Ashi Charts Recommended: The script offers a Heikin Ashi mode for smoothing out noise and enhancing visual clarity. Using Heikin Ashi candles can further reduce whipsaws and highlight cleaner shifts in trend direction.
MACD Alignment: For best results, trade in the direction of the MACD trend or use it as a filter to avoid counter-trend trades.
⚠️ Important Notes
Entry Signals Only: This indicator only plots entry points (Buy and Sell signals). It does not define exit strategies, so users should manage trades manually using trailing stops, profit targets, or other exit indicators.
No Signal = No Confirmation: You may see a UT Bot trigger without a corresponding Buy/Sell signal. This means the price did not confirm the move by crossing the Hull MA, and therefore the setup was considered too weak or incomplete.
⚙️ Customization
UT Bot Sensitivity: Adjust the “Key Value” and “ATR Period” to make the UT Bot more or less reactive to price action.
Use Heikin Ashi: Toggle between standard candles or Heikin Ashi in the indicator settings for a smoother trading experience.
The HMA length may also be modified in the indicator settings from its standard 55 length to increase or decrease the sensitivity of signal.
This strategy is best used by traders looking for a structured, logic-based way to enter early into reversals with added confirmation to reduce risk. By combining two independent systems—momentum detection (UT Bot) and trend confirmation (Hull MA)—it aims to provide high-confidence entries without overwhelming complexity.
Let the indicator guide your entries—you manage the exits.
Examples of use:
Futures:
Stock:
Crypto:
As shown in the snapshots this strategy, like most, works the best when price action has a sizeable ATR and works the least when price is choppy. Therefore it is always best to use this system when price is coming off known support or resistance levels and when it is seen to respect short term EMA's like the 9 or 15.
My personal preference to use this system is for day trading on a 3 or 5 minute chart. But it is valid for all timeframes and simply marks a high probability for a new trend to form.
Sources:
Quant Nomad - www.tradingview.com
Yo_adriiiiaan - www.tradingview.com
HPotter - www.tradingview.com
Hull Moving Average - alanhull.com

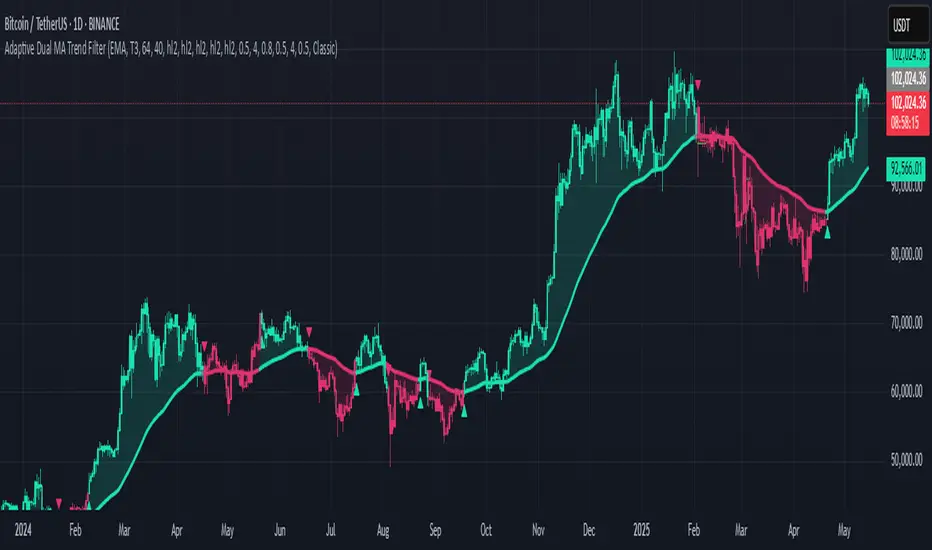
Adaptive Dual MA Trend FilterAdaptive Dual MA Trend Filter is a versatile Pine Script™ indicator that delivers clear, reliable trend signals using customizable moving averages:
Dual‑Stage Filtering – Apply any traditional MA (SMA, EMA, VWMA, HMA, RMA, TEMA, DEMA, FRAMA, TRIMA) or advanced smoothing (ALMA, T3) as your “main” and “filter” MAs. The filter MA is double‑smoothed for noise suppression, then converted into a robust “double‑filtered” baseline.
Flexible Inputs – Select lengths, sources (close, high, low, hl2), offsets, sigma, and volume factors to tailor the responsiveness and smoothness to your favorite timeframe or asset class.
Intuitive Signals – The script detects confirmed bullish (green) and bearish (red) trend shifts as:
Circle marker on the MA line
Triangle arrows below/above bars
Full candles and MA line colored by current trend
Clean Overlay – Works directly on your price chart, with optional semi‑transparent fills for extra visual clarity.
Theme Support – Choose from Vibrant, Pastel, Neon, Classic, Monochrome, Solarized, or Material palettes for seamless chart styling.
Ideal for swing traders and intraday scalpers alike, Multi‑Source Double‑Filter Trend offers both “set‑and‑forget” simplicity and deep customization for power users.
Usage
Add to chart → Inputs → tweak MA types/lengths
Watch for color changes and markers
Combine with volume or momentum filters for entry confirmation
Enjoy clearer trend identification and smoother trade signals!
Disclaimer
This script is for educational and informational purposes only. Not financial advice. Use at your own risk.
US30 HMA Signal v2.8Indicator Description – US30 HMA Signal v2.8
Overview:
The US30 HMA Signal indicator is designed to generate Buy and Sell signals based on the crossover of three Hull Moving Averages (HMAs). The indicator focuses on identifying momentum shifts and directional bias using the 9, 21, and 50 HMA structures, optimised for the US30 (Dow Jones) index.
⸻
Indicator Components:
1. Hull Moving Averages (HMAs):
• 9 HMA (Green): Fastest HMA, responds quickly to price changes.
• 21 HMA (Amber): Medium-term HMA, acts as a transitional filter.
• 50 HMA (Red): Slowest HMA, defines the broader trend direction.
⸻
Logic and Signal Conditions:
1. Session Filter:
• Signals are only generated during the US session, defined as starting at 13:30 BST.
2. Directional Bias:
• Bullish Bias: Occurs when both the 9 HMA and 21 HMA are above the 50 HMA.
• Bearish Bias: Occurs when both the 9 HMA and 21 HMA are below the 50 HMA.
3. Crossover Logic:
• Buy Signal: Prints when the 9 HMA crosses above the 21 HMA while the directional bias is bullish.
• Sell Signal: Prints when the 9 HMA crosses below the 21 HMA while the directional bias is bearish.
4. Minimum Bar Spacing:
• To avoid signal clustering, a minimum bar spacing of 5 bars is implemented between consecutive signals.
⸻
Plotting:
• Buy Signal: Displays as a green label below the candle with the text “BUY.”
• Sell Signal: Displays as a red label above the candle with the text “SELL.”
⸻
Purpose and Usage:
• The indicator is designed for traders looking to capture momentum shifts in the US30 index using HMA crossovers.
• It is best applied on the 5-minute timeframe to balance signal frequency and reliability.
• The strict session filter ensures signals are only generated during the most volatile period, aligning with US market activity.
Hull Moving Average with Cloud📈 Hull Moving Average with Cloud – Adaptive Trend Visualization
This indicator combines the power of the Hull Moving Average (HMA) with a visual signal line and trend cloud, giving traders a clearer view of market direction, momentum shifts, and potential reversals.
🔍 Key Features:
Dynamic HMA Length (optional): Adjusts the HMA period based on ATR volatility, allowing the moving average to adapt to changing market conditions.
Custom Smoothing Options: Smooth the main HMA with your choice of SMA, EMA, or WMA for a tailored trend line.
Signal Line (Orange HMA): A shorter-period Hull MA that acts as a trigger line for crossovers and trend changes.
Color-Coded Trend Cloud:
🟩 Green Cloud: Bullish – main HMA is above the signal HMA.
🟥 Red Cloud: Bearish – main HMA is below the signal HMA.
Real-Time Trend Coloring: Both lines dynamically change color based on slope (green for rising, red/purple for falling).
Offset Capability: Shift the HMA forward to visualize trend development and potential future direction.
✅ Use Cases:
Identify trend direction with cloud coloration.
Spot early reversals through HMA crossover signals.
Filter trades with volatility-aware moving average responsiveness.

HMA Breakdown [NLR]Hull Moving Average (HMA) is a great trend-following tool — it's smooth, fast, and more responsive than traditional MAs like EMA or SMA. But the problem?
Sometimes it gives signals that look sharp but are misleading — especially in noisy markets or when the price is chopping around.
This script breaks down the inner mechanics of the HMA to give you more context:
Are the inputs to HMA actually diverging?
Is there momentum behind the move?
Is this trend about to reverse or just a pullback?
By plotting the components of HMA — and layering signal bands, color logic, and optional trend overlays — it gives you a visual breakdown of what's really going on under the hood.
What this indicator shows
HMA Trend (Main Line)
The Hull Moving Average (HMA) is plotted in bold, colored red or green based on internal conditions (not just price slope).
WMA Components (Fast & Slow)
Shows the two WMAs used inside the HMA calculation:
WMA Half (faster) — reacts quickly to price
WMA Full (slower) — smoother, less reactive
Their difference and crossover gives you clues on whether momentum is building or fading.
Signal & Band Structure
A calculated upper band and lower band are used to track when HMA is leading or lagging momentum.
When the HMA is below the band, trend may be weakening - this helps you filter false signals.
TMA Candle (Optional Visual)
A synthetic candle shows whether the smoothed average is rising or falling compared to a few candles back.
This is a simple visual cue to spot inflection points in the trend.
EMA Trend Overlay (Optional)
A pair of short-term EMAs built on a smoothed source helps you catch micro-trends or align your entries with the bigger trend.
Can act as an early heads-up or a trend confirmation layer.
What problem it solves
Noisy Signals: Helps filter out weak or fake trend signals often seen in HMA-only systems.
Visual Breakdown: Lets you see how each component of the HMA is behaving — so you’re not flying blind.
Momentum Confirmation: Adds layered confirmation using fast-vs-slow WMA cross, signal bands, and mini trend overlays.
Best Used For:
Trend-following traders who use HMA or WMA strategies
Filtering entries/exits in momentum-based systems
Visually confirming when a trend is real vs fake
