Alpha-Decreasing Exponential Moving AverageThe alpha parameter of this moving average decreases with every new bar on the chart, so it will become more slowly and slowly in course of time. Can act like additional support/resistance line but works in an acceptable way on weekly and monthly timeframes only.
Historical


Security() Correction - Realtime vs. Historical BarsProblem
Pine's implementation of the security() function behaves differently in realtime vs. historical bars. Specifically, for historical bars, calling security() for a time frame (TF) larger/slower than the current chart's TF will return information about the last completed bar of the higher TF. However, for realtime bars (i.e. if you allow the chart to continue to plot in realtime), security() returns information about the presently in-progress bar of the higher TF. Clearly, this leads to discontinuity that is arbitrarily dependent upon when the user last loaded or refreshed the chart.
Solution
Fortunately, after understanding the problem, solving it is trivial: use security() normally for historical bars, but switch to explicitly requesting prior candle bars once the indicator is operating on realtime bars. I leave the source open here for any to use as they see fit. For testing, I include an input to allow switching back and forth between standard and corrected behavior.
Figure 1 displays the standard behavior we see in security() calls, and Figure 2 displays the behavior after my correction:
Figure 1: Typical security() behavior in Pine
Figure 2: Corrected security() behavior, forcing historical and realtime bars to refer to the same higher TF bar offset.
I publish this mostly as a reminder to myself, so I will not forget and then have to figure it out again next time it comes up in my scripting.
V21: Initial release.

Historical Volatility based Standard Deviation_V2This Plots the Standard Deviation Price Band based on the Historical Volatility. SD 1, 2, 3.
Version update:
Fixed the Standard Deviation mistake on Version 1.
Added Smoothing Options for those who prefer a less choppy version.
Standard Deviation 3 plot is not set to Default

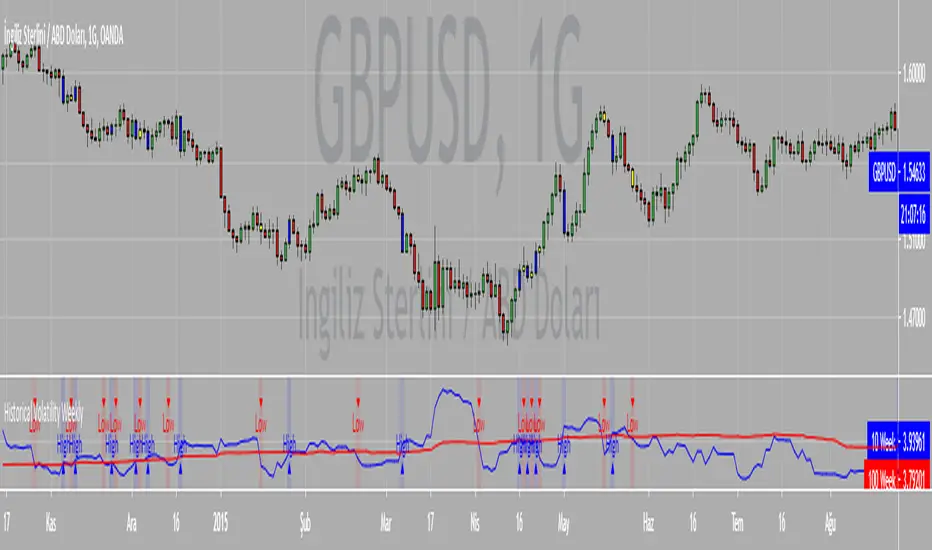
Historical Volatility Strategy Strategy buy when HVol above BuyBand and close position when HVol below CloseBand.
Markets oscillate from periods of low volatility to high volatility
and back. The author`s research indicates that after periods of
extremely low volatility, volatility tends to increase and price
may move sharply. This increase in volatility tends to correlate
with the beginning of short- to intermediate-term moves in price.
They have found that we can identify which markets are about to make
such a move by measuring the historical volatility and the application
of pattern recognition.
The indicator is calculating as the standard deviation of day-to-day
logarithmic closing price changes expressed as an annualized percentage.
