Divergence Screener [Trendoscope®]🎲Overview
The Divergence Screener is a powerful TradingView indicator designed to detect and visualize bullish and bearish divergences, including hidden divergences, between price action and a user-selected oscillator. Built with flexibility in mind, it allows traders to customize the oscillator type, trend detection method, and other parameters to suit various trading strategies. The indicator is non-overlay, displaying divergence signals directly on the oscillator plot, with visual cues such as lines and labels on the chart for easy identification.
This indicator is ideal for traders seeking to identify potential reversal or continuation signals based on price-oscillator divergences. It supports multiple oscillators, trend detection methods, and alert configurations, making it versatile for different markets and timeframes.
🎲Features
🎯Customizable Oscillator Selection
Built-in Oscillators : Choose from a variety of oscillators including RSI, CCI, CMO, COG, MFI, ROC, Stochastic, and WPR.
External Oscillator Support : Users can input an external oscillator source, allowing integration with custom or third-party indicators.
Configurable Length : Adjust the oscillator’s period (e.g., 14 for RSI) to fine-tune sensitivity.
🎯Divergence Detection
The screener identifies four types of divergences:
Bullish Divergence : Price forms a lower low, but the oscillator forms a higher low, signaling potential upward reversal.
Bearish Divergence : Price forms a higher high, but the oscillator forms a lower high, indicating potential downward reversal.
Bullish Hidden Divergence : Price forms a higher low, but the oscillator forms a lower low, suggesting trend continuation in an uptrend.
Bearish Hidden Divergence : Price forms a lower high, but the oscillator forms a higher high, suggesting trend continuation in a downtrend.
🎯Flexible Trend Detection
The indicator offers three methods to determine the trend context for divergence detection:
Zigzag : Uses zigzag pivots to identify trends based on higher highs (HH), higher lows (HL), lower highs (LH), and lower lows (LL).
MA Difference : Calculates the trend based on the difference in a moving average (e.g., SMA, EMA) between divergence pivots.
External Trend Signal : Allows users to input an external trend signal (positive for uptrend, negative for downtrend) for custom trend analysis.
🎯Zigzag-Based Pivot Analysis
Customizable Zigzag Length : Adjust the zigzag length (default: 13) to control the sensitivity of pivot detection.
Repaint Option : Choose whether divergence lines repaint based on the latest data or wait for confirmed pivots, balancing responsiveness and reliability.
🎯Visual and Alert Features
Divergence Visualization : Divergence lines are drawn between price pivots and oscillator pivots, color-coded for easy identification:
Bullish Divergence : Green
Bearish Divergence : Red
Bullish Hidden Divergence : Lime
Bearish Hidden Divergence : Orange
Labels and Tooltips : Labels (e.g., “D” for divergence, “H” for hidden) appear on price and oscillator pivots, with tooltips providing detailed information such as price/oscillator values, ratios, and pivot directions.
Alerts : Configurable alerts for each divergence type (bullish, bearish, bullish hidden, bearish hidden) trigger on bar close, ensuring timely notifications.
🎲 How It Works
🎯Oscillator Calculation
The indicator calculates the selected oscillator (or uses an external source) and plots it on the chart.
Oscillator values are stored in a map for reference during divergence calculations.
🎯Pivot Detection
A zigzag algorithm identifies pivots in the oscillator data, with configurable length and repainting options.
Price and oscillator pivots are compared to detect divergences based on their direction and ratio.
🎯Divergence Identification
The indicator compares price and oscillator pivot directions (HH, HL, LH, LL) to identify divergences.
Trend context is determined using the selected method (Zigzag, MA Difference, or External).
Divergences are classified as bullish, bearish, bullish hidden, or bearish hidden based on price-oscillator relationships and trend direction.
🎯Visualization and Alerts
Valid divergences are drawn as lines connecting price and oscillator pivots, with corresponding labels.
Alerts are triggered for allowed divergence types, providing detailed information via tooltips.
🎯Validation
Divergence lines are validated to ensure no intermediate bars violate the divergence condition, enhancing signal reliability.
🎲 Usage Instructions as Indicator
🎯Add to Chart:
Add the “Divergence Screener ” to your TradingView chart.
The indicator appears in a separate pane below the price chart, plotting the oscillator and divergence signals.
🎯Configure Settings:
Adjust the oscillator type and length to match your trading style.
Select a trend detection method and configure related parameters (e.g., MA type/length or external signal).
Set the zigzag length and repainting preference.
Enable/disable alerts for specific divergence types.
I🎯nterpret Signals:
Bullish Divergence (Green) : Look for potential buy opportunities in a downtrend.
Bearish Divergence (Red) : Consider sell opportunities in an uptrend.
Bullish Hidden Divergence (Lime) : Confirm continuation in an uptrend.
Bearish Hidden Divergence (Orange): Confirm continuation in a downtrend.
Use tooltips on labels to review detailed pivot and divergence information.
🎯Set Alerts:
Create alerts for each divergence type to receive notifications via TradingView’s alert system.
Alerts include detailed text with price, oscillator, and divergence information.
🎲 Example Scenarios as Indicator
🎯 With External Oscillator (Use MACD Histogram as Oscillator)
In order to use MACD as an oscillator for divergence signal instead of the built in options, follow these steps.
Load MACD Indicator from Indicator library
From Indicator settings of Divergence Screener, set Use External Oscillator and select MACD Histograme from the dropdown
You can now see that the oscillator pane shows the data of selected MACD histogram and divergence signals are generated based on the external MACD histogram data.
🎯 With External Trend Signal (Supertrend Ladder ATR)
Now let's demonstrate how to use external direction signals using Supertrend Ladder ATR indicator. Please note that in order to use the indicator as trend source, the indicator should return positive integer for uptrend and negative integer for downtrend. Steps are as follows:
Load the desired trend indicator. In this example, we are using Supertrend Ladder ATR
From the settings of Divergence Screener, select "External" as Trend Detection Method
Select the trend detection plot Direction from the dropdown. You can now see that the divergence signals will rely on the new trend settings rather than the built in options.
🎲 Using the Script with Pine Screener
The primary purpose of the Divergence Screener is to enable traders to scan multiple instruments (e.g., stocks, ETFs, forex pairs) for divergence signals using TradingView’s Pine Screener, facilitating efficient comparison and identification of trading opportunities.
To use the Divergence Screener as a screener, follow these steps:
Add to Favorites : Add the Divergence Screener to your TradingView favorites to make it available in the Pine Screener.
Create a Watchlist : Build a watchlist containing the instruments (e.g., stocks, ETFs, or forex pairs) you want to scan for divergences.
Access Pine Screener : Navigate to the Pine Screener via TradingView’s main menu: Products -> Screeners -> Pine, or directly visit tradingview.com/pine-screener/.
Select Watchlist : Choose the watchlist you created from the Watchlist dropdown in the Pine Screener interface.
Choose Indicator : Select Divergence Screener from the Choose Indicator dropdown.
Configure Settings : Set the desired timeframe (e.g., 1 hour, 1 day) and adjust indicator settings such as oscillator type, zigzag length, or trend detection method as needed.
Select Filter Criteria : Select the condition on which the watchlist items needs to be filtered. Filtering can only be done on the plots defined in the script.
Run Scan : Press the Scan button to display divergence signals across the selected instruments. The screener will show which instruments exhibit bullish, bearish, bullish hidden, or bearish hidden divergences based on the configured settings.
🎲 Limitations and Possible Future Enhancements
Limitations are
Custom input for oscillator and trend detection cannot be used in pine screener.
Pine screener has max 500 bars available.
Repaint option is by default enabled. When in repaint mode expect the early signal but the signals are prone to repaint.
Possible future enhancements
Add more built-in options for oscillators and trend detection methods so that dependency on external indicators is limited
Multi level zigzag support
Hewhomustnotbenamed

SIP Evaluator and Screener [Trendoscope®]The SIP Evaluator and Screener is a Pine Script indicator designed for TradingView to calculate and visualize Systematic Investment Plan (SIP) returns across multiple investment instruments. It is tailored for use in TradingView's screener, enabling users to evaluate SIP performance for various assets efficiently.
🎲 How SIP Works
A Systematic Investment Plan (SIP) is an investment strategy where a fixed amount is invested at regular intervals (e.g., monthly or weekly) into a financial instrument, such as stocks, mutual funds, or ETFs. The goal is to build wealth over time by leveraging the power of compounding and mitigating the impact of market volatility through disciplined, consistent investing. Here’s a breakdown of how SIPs function:
Regular Investments : In an SIP, an investor commits to investing a fixed sum at predefined intervals, regardless of market conditions. This consistency helps inculcate a habit of saving and investing.
Cost Averaging : By investing a fixed amount regularly, investors purchase more units when prices are low and fewer units when prices are high. This approach, known as dollar-cost averaging, reduces the average cost per unit over time and mitigates the risk of investing a large amount at a peak price.
Compounding Benefits : Returns generated from the invested amount (e.g., capital gains or dividends) are reinvested, leading to exponential growth over the long term. The longer the investment horizon, the greater the potential for compounding to amplify returns.
Dividend Reinvestment : In some SIPs, dividends received from the underlying asset can be reinvested to purchase additional units, further enhancing returns. Taxes on dividends, if applicable, may reduce the reinvested amount.
Flexibility and Accessibility : SIPs allow investors to start with small amounts, making them accessible to a wide range of individuals. They also offer flexibility in terms of investment frequency and the ability to adjust or pause contributions.
In the context of the SIP Evaluator and Screener , the script simulates an SIP by calculating the number of units purchased with each fixed investment, factoring in commissions, dividends, taxes and the chosen price reference (e.g., open, close, or average prices). It tracks the cumulative investment, equity value, and dividends over time, providing a clear picture of how an SIP would perform for a given instrument. This helps users understand the impact of regular investing and make informed decisions when comparing different assets in TradingView’s screener. It offers insights into key metrics such as total invested amount, dividends received, equity value, and the number of installments, making it a valuable resource for investors and traders interested in understanding long-term investment outcomes.
🎲 Key Features
Customizable Investment Parameters: Users can define the recurring investment amount, price reference (e.g., open, close, HL2, HLC3, OHLC4), and whether fractional quantities are allowed.
Commission Handling: Supports both fixed and percentage-based commission types, adjusting calculations accordingly.
Dividend Reinvestment: Optionally reinvests dividends after a user-specified period, with the ability to apply tax on dividends.
Time-Bound Analysis: Allows users to set a start year for the analysis, enabling historical performance evaluation.
Flexible Dividend Periods: Dividends can be evaluated based on bars, days, weeks, or months.
Visual Outputs: Plots key metrics like total invested amount, dividends, equity value, and remainder, with customizable display options for clarity in the data window and chart.
🎲 Using the script as an indicator on Tradingview Supercharts
In order to use the indicator on charts, do the following.
Load the instrument of your choice - Preferably a stable stocks, ETFs.
Chose monthly timeframe as lower timeframes are insignificant in this type of investment strategy
Load the indicator SIP Evaluator and Screener and set the input parameters as per your preference.
Indicator plots, investment value, dividends and equity on the chart.
🎲 Visualizations
Installments : Displays the number of SIP installments (gray line, visible in the data window).
Invested Amount : Shows the cumulative amount invested, excluding reinvested dividends (blue area plot).
Dividends : Tracks total dividends received (green area plot).
Equity : Represents the current market value of the investment based on the closing price (purple area plot).
Remainder : Indicates any uninvested cash after each installment (gray line, visible in the data window).
🎲 Deep dive into the settings
The SIP Evaluator and Screener offers a range of customizable settings to tailor the Systematic Investment Plan (SIP) simulation to your preferences. Below is an explanation of each setting, its purpose, and how it impacts the analysis:
🎯 Duration
Start Year (Default: 2020) : Specifies the year from which the SIP calculations begin. When Start Year is enabled via the timebound option, the script only considers data from the specified year onward. This is useful for analyzing historical SIP performance over a defined period. If disabled, the script uses all available data.
Timebound (Default: False) : A toggle to enable or disable the Start Year restriction. When set to False, the SIP calculation starts from the earliest available data for the instrument.
🎯 Investment
Recurring Investment (Default: 1000.0) : The fixed amount invested in each SIP installment (e.g., $1000 per period). This represents the regular contribution to the SIP and directly influences the total invested amount and quantity purchased.
Allow Fractional Qty (Default: True) : When enabled, the script allows the purchase of fractional units (e.g., 2.35 shares). If disabled, only whole units are purchased (e.g., 2 shares), with any remaining funds carried forward as Remainder. This setting impacts the precision of investment allocation.
Price Reference (Default: OPEN): Determines the price used for purchasing units in each SIP installment. Options include:
OPEN : Uses the opening price of the bar.
CLOSE : Uses the closing price of the bar.
HL2 : Uses the average of the high and low prices.
HLC3 : Uses the average of the high, low, and close prices.
OHLC4 : Uses the average of the open, high, low, and close prices. This setting affects the cost basis of each purchase and, consequently, the total quantity and equity value.
🎯 Commission
Commission (Default: 3) : The commission charged per SIP installment, expressed as either a fixed amount (e.g., $3) or a percentage (e.g., 3% of the investment). This reduces the amount available for purchasing units.
Commission Type (Default: Fixed) : Specifies how the commission is calculated:
Fixed ($) : A flat fee is deducted per installment (e.g., $3).
Percentage (%) : A percentage of the investment amount is deducted as commission (e.g., 3% of $1000 = $30). This setting affects the net amount invested and the overall cost of the SIP.
🎯 Dividends
Apply Tax On Dividends (Default: False) : When enabled, a tax is applied to dividends before they are reinvested or recorded. The tax rate is set via the Dividend Tax setting.
Dividend Tax (Default: 47) : The percentage of tax deducted from dividends if Apply Tax On Dividends is enabled (e.g., 47% tax reduces a $100 dividend to $53). This reduces the amount available for reinvestment or accumulation.
Reinvest Dividends After (Default: True, 2) : When enabled, dividends received are reinvested to purchase additional units after a specified period (e.g., 2 units of time, defined by Dividends Availability). If disabled, dividends are tracked but not reinvested. Reinvestment increases the total quantity and equity over time.
Dividends Availability (Default: Bars) : Defines the time unit for evaluating when dividends are available for reinvestment. Options include:
Bars : Based on the number of chart bars.
Weeks : Based on weeks.
Months : Based on months (approximated as 30.5 days). This setting determines the timing of dividend reinvestment relative to the Reinvest Dividends After period.
🎯 How Settings Interact
These settings work together to simulate a realistic SIP. For example, a $1000 recurring investment with a 3% commission and fractional quantities enabled will calculate the number of units purchased at the chosen price reference after deducting the commission. If dividends are reinvested after 2 months with a 47% tax, the script fetches dividend data, applies the tax, and adds the net dividend to the investment amount for that period. The Start Year and Timebound settings ensure the analysis aligns with the desired timeframe, while the Dividends Availability setting fine-tunes dividend reinvestment timing.
By adjusting these settings, users can model different SIP scenarios, compare performance across instruments in TradingView’s screener, and gain insights into how commissions, dividends, and price references impact long-term returns.
🎲 Using the script with Pine Screener
The main purpose of developing this script is to use it with Tradingview Pine Screener so that multiple ETFs/Funds can be compared.
In order to use this as a screener, the following things needs to be done.
Add SIP Evaluator and Screener to your favourites (Required for it to be added in pine screener)
Create a watch list containing required instruments to compare
Open pine screener from Tradingview main menu Products -> Screeners -> Pine or simply load the URL - www.tradingview.com
Select the watchlist created from Watchlist dropdown.
Chose the SIP Evaluator and Screener from the "Choose Indicator" dropdown
Set timeframe to 1 month and update settings as required.
Press scan to display collected data on the screener.
🎲 Use Case
This indicator is ideal for educational purposes, allowing users to experiment with SIP strategies across different instruments. It can be applied in TradingView’s screener to compare SIP performance for stocks, ETFs, or other assets, helping users understand how factors like commissions, dividends, and price references impact returns over time.

Rolling Angled Volume Profile [Trendoscope®]🎲 Volume Profile Indicators
🎯Traditional Volume Profile
Volume profile indicators visually represent the distribution of volume across price levels. These indicators typically operate on horizontal price levels, making them effective in identifying supply and demand zones in ranging markets. However, they are less useful in trending markets where price movements follow a slope.
🎯The Need for Angled Volume Profiles
Just as support and resistance levels differ from trendlines, volume profile indicators require an equivalent method to account for volume distribution along a sloped trajectory. This would enable more accurate volume analysis in trending markets.
We identified the need of Angled Volume profile and have already published few indicators that implements the concept.
Angled Volume Profile calculates volume distribution along a slope. Users interact with the indicator by selecting the starting point, after which the volume profile is calculated for the selected trajectory.
Volume Forks is another tool that extends angled volume profile analysis, aligning volume profiles along the trajectory of pitchforks.
🎲 Rolling Volume Profile Indicator
The Rolling Volume Profile offers a new approach to angled volume profile calculations, addressing some limitations of earlier implementations:
🎯 Rolling Calculation
The volume profile is calculated for the last N bars of the instrument
The slope of the profile lines is determined by the closing prices of the starting and ending bars
Profiles are drawn in the direction of price movement between the start and end bars.
🎯 Dynamic Updates
As new bars are added, the calculations are updated, and the profile is redrawn based on the latest data.
This dynamic behavior earns it the name "Rolling Volume Profile."
🎯 Advantages Over Earlier Versions
Unlimited Profile Lines : Unlike previous implementations limited to 500 profile lines, this indicator uses polyline objects, overcoming the restriction.
Live Updates : Previous angled volume profile tools lacked real-time updates when new bars appeared. This limitation is resolved in the Rolling Volume Profile Indicator.
The Rolling Volume Profile provides an efficient and scalable solution for analyzing volume in trending markets.
🎯 Indicator Settings
Simple settings include few customisable options

Dual Zigzag [Trendoscope®]🎲 Dual Zigzag indicator is built on recursive zigzag algorithm. It is very similar to other zigzag indicators published by us and other authors. However, the key point here is, the indicator draws zigzag on both price and any other plot based indicator on separate layouts.
Before we get into the indicator, here are some brief descriptions of the underlying concepts and key terminologies
🎯 Zigzag
Zigzag indicator breaks down price or any input series into a series of Pivot Highs and Pivot Lows alternating between each other. Zigzags though shows pivot high and lows, should not be used for buying at low and selling at high. The main application of zigzag indicator is for the visualisation of market structure and this can be used as basic building block for any pattern recognition algorithms.
🎯 Recursive Zigzag Algorithm
Recursive zigzag algorithm builds zigzag on multiple levels and each level of zigzag is based on the previous level pivots. The level zero zigzag is built on price. However, for level 1, instead of price level 0 zigzag pivots are used. Similarly for level 2, level 1 zigzag pivots are used as base.
🎲 Components Dual Zigzag Indicator
Here are the components of Dual zigzag indicator
Built in Oscillator - Indicator has built in oscillator options for plotting RSI (Relative Strength Index), MFI (Money Flow Index), cci (Commodity Channel Index) , CMO (Chande Momentum Oscillator), COG (Center of Gravity), and ROC (Rate of Change). Apart from the given built in oscillators, users can also use a custom external output as base. The oscillators are not printed on the price pane. But, printed on a separate indicator overlay.
Zigzag On Oscillator - Recursive zigzag is calculated and printed on the oscillator series. Each pivot high and pivot low also prints a label having the retracement ratios, and price levels at those points. Zigzag on the oscillator is also printed on the indicator overlay pane.
Zigzag on Price - Recursive zigzag calculated based on price and printed on the price pane. This is made possible by using force_overlay option present in the drawing objects. At each zigzag pivot levels, the label having price retracement ratios, and oscillator values are printed.
It is called dual zigzag because, the indicator calculates the zigzag on both price and oscillator series of values and prints them separately on different panes on the chart.
🎲 Indicator Settings
Settings include
Theme display settings to get the right colour combination to match the background.
Zigzag settings to be used for zigzag calculation and display
Oscillator settings to chose the oscillator to be used as base for 2nd zigzag
🎲 Applications
Useful in spotting divergences with both indicator and price having their own zigzag to highlight pivots
Spotting patterns in indicators/oscillators and correlate them with the patterns on price
🎲 Using External Input
If users want to use an external indicator such as OBV instead of the built in oscillators, then can do so by using the custom option.
Here is how this can be done.
Step1. Add both Dual Zigzag and the intended indicator (in this case OBV) on the chart. Notice that both OBV and Dual zigzag appear on different panes.
Step2. Edit the indicator settings of Dual zigzag and set custom indicator by selecting "custom" as oscillator name and then by setting the custom external indicator name and input.
Step 3. You would notice that the zigzag in Dual Zigzag indictor pane is already showing the zigzag pivots based on the OBV indicator and the price pivots display obv values at the pivot points. We can leave this as is.
Step 4. As an additional step, you can also merge the OBV pane and the Dual zigzag indicator pane into one by going into OBV settings and moving the indicator to above pane. Merge the scales so that there is no two scales on the same pane and the entire scale appear on the right.
At the end, you should see two panes - one with price and other with OBV and both having their zigzag plotted.

HTF Candles Overlay [Trendoscope®]🎲 HTF Candles Overlay is a simple indicator where you can overlay higher timeframe candles on current timeframe chart.
Most of the code is encapsulated in the library HTFCandlesLib . After publishing the library as open source, many people requested to convert that into an indicator. Based on this, we decided to publish this small code for the use of community.
🎯 Usage
The indicator is simple, it helps users visualise higher timeframe candles. We majorly use this for debugging or validating our implementations based on higher timeframe. Instead of switching back and forth to different timeframes, it helps us visualise higher timeframe candles on the same chart when we are validating the implementation that involves higher timeframe calculations.
🎯 Components
The indicator provides two types of displays
Candles - overlay candles built through lines and labels
Plot - close price of higher timeframe plotted on chart
🎯 Candles
The behaviour of the candles are similar to that of hollow candles. The color of the body and the border+wick demonstrates the movement of the candle.
Body color is lime if the HTF close is higher than HTF open. Body color is orange if the HTF close is lower than the HTF open.
Wick and border color is lime if HTF close price is higher than previous HTF close price. And they are orange if HTF close price is lower than the previous HTF close price
In most cases body color will be same as the wick color. In case of stocks and indices, it may happen that the open price is too far away from previous close price due to gaps. This can lead to close price being relatively in different direction when compared to open and previous close.
Wicks are not at the centre of the candle. Instead wicks are drawn on the current chart timeframe position where the current timeframe has reached the highest or lowest point within the given HTF candle
Candles also list OHLC price of HTF candle along with HTF bar index and the range of LTF bar index that the candle spawns
Here are some pictorial representations that can help understand better.
Here are the examples of candles with gaps where body and wick/border are in different directions (colours)
🎯 Indicator Settings
Simple settings allow users to select the timeframe, whether to display candles and plots and their specific colors.
🎯 Possible inconsistencies
The overlay can show inconsistent data in certain situations. Here are some of the scenarios where the indicator may not show consistent display of the data.
When the HTF data from request.security does not match that of combined LTF data . In such cases, HTF candles may not form inline with the current timeframe candles. This happens when there is a data issue of different OHLC data available in tradingview.
When using weekly candle as either chart timeframe or higher timeframe - end of week may not coincide with end of month or other timeframes. This can cause some inconsistencies in the visuals of the indicator.
When open and close time of either LTF or HTF falls under different day due to time zone used. - time is always the time on which the candle close. So, when we use time zone that causes the exchange day to open and close on different days, that can cause some inconsistencies in the candles being drawn.

Motive Wave Scanner [Trendoscope®]Motive Wave Scanner is a simple algorithm to find out motive waves as per the rules of Elliott Wave theory.
It is an extension to our previous open source script Interactive Motive Wave Checklist which provides interactive capability to select six points of a five wave formation. Once users select them, the rules of motive waves are applied to manually selected points to highlight them as either diagonal wave, motive wave or none.
This indicator does the same. But, instead of requesting the pivots manually from the user, the indicator automatically picks and scans them through zigzag.
We have already published a similar script as protected source. But, due to some changes in the pine engine, there have been few issues in the runtime. In this publication, we not only address those runtime issues but also making it open source for the users to make use of the source code and enhance it further.
🎲 What are motive waves
Motive waves are strong upward or downward movement with 5 subwaves.
Motive Wave in the upward direction will start with Swing High, Ends with Swing High and consists of 3 Higher Highs and 2 Higher Lows representing strong upward trend.
Motive Wave in the downward direction will start with Swing Low, Ends with Swing low and consists of 3 Lower Lows and 2 Lower Highs representing strong downward trend.
🎲 Types of Motive Waves
Motive Waves are broadly classified by two types:
Impulse Waves
Diagonal Waves
Diagonal Waves are further classified into Contracting and Expanding Diagonals. These can fall into the category of either leading diagonal and ending diagonal.
🎲 Rules of Motive Waves
🎯 Generic Rule of any motive waves are as follows
Should consist of 5 alternating waves. (Swing High followed by Swing low and vice versa)
This can start from Swing High and end in Swing High or start from Swing Low and end in Swing Low of a zigzag.
Wave-2 should not move beyond Wave-1. This means, the Wave-2 is always shorter than Wave-1 with respect to distance between the price of start and end.
Wave-3 always moves beyond Wave-1. This means, the Wave-3 is always longer than Wave-2 in terms of price
Among Wave-1, Wave-3, and Wave-5, Wave-3 is never the shortest one. This means, either Wave-1 or Wave-5 can be longer than Wave-3 but not both. Wave-3 can also be longest among the three.
Here is the pictorial representation of the rules of the Motive Waves
For a wave to be considered as motive wave, it also needs to follow the rules of either impulse or diagonal waves.
🎯 Rules for a 5 wave pattern to be considered as Impulse Wave are:
Wave-4 never overlaps with Wave-1 price range
Wave-1, Wave-3 and Wave-5 should not be either expanding or contracting. Meaning, we cannot have Wave-1 > Wave-3 > Wave-5 , and we cannot have Wave-1 < Wave-3 < Wave-5
Pictorial representation of the impulse wave rules are as below:
🎯 Rules for the Diagonal Waves are as follows
Contrary to the first rule of impulse wave, in case of diagonal wave, Wave-4 always overlaps with Wave-1 price range. But, it will not go beyond Wave-3
Waves are progressively expanding or contracting - Wave1 > Wave3 > Wave5 and Wave2 > Wave4 to be contracting diagonal. Wave1 < Wave3 < Wave5 and Wave2 < Wave4 to be expanding diagonal wave.
Pictorial representation of the Contracting Diagonal Wave is as below. Here, the Wave-1, Wave-3 and Wave-5 are in contracting formation.
Pictorial representation of the Expanding Diagonal Wave is as below. Here, the Wave-1, Wave-3 and Wave-5 are in expanding formation.
🎲 Indicator Settings
Indicator settings are defined as below:
Repaint Warning : If Repaint is selected, the indicator will throw a runtime error after certain bars or when alerts are set. This is due to some pine internal issue. At present, we do not have any solution for this until the internal issue is resolved by Tradingview Pine Team.
ABCD Projection [Trendoscope®]Over the years, we have extensively explored and published numerous scripts centered around various chart patterns, including Harmonic Patterns, Reversal Patterns, Elliott Waves, and more. Our expertise in these areas has led to frequent requests for an indicator based on the ABCD pattern. Although we didn't include it as part of our Harmonic Patterns collection, the development of a dedicated ABCD Projection Indicator has always been a priority for us.
🎲 Overview of the ABCD Projection Indicator
The ABCD Projection Indicator is designed to identify and project ABCD patterns using a Zigzag-based approach. This pattern, characterized by alternating pivot highs and lows labeled as A, B, C, and D, is particularly significant in trending markets where it signifies trend continuation following deep pullbacks.
The indicator works by confirming the ABC pivots and projecting the D pivot based on the established price swings. Since ABCD patterns are most effective in trending environments, the indicator focuses on filtering patterns where the retracement from the C pivot has not compromised the trade's potential. Specifically, it ensures that the starting point (S)—where the pattern is detected—has not retraced beyond a defined threshold, preserving the opportunity to execute a trade with the goal of reaching the projected D pivot.
Additionally, the ABCD Projection Indicator considers the retracement ratio from the C pivot, which plays a crucial role in risk management. A higher retracement ratio reduces the stop distance (from pivot A to the entry point S) while increasing the distance to the target (pivot D), thereby enhancing the reward/risk ratio for trades.
🎲 Components of the ABCD Projection Indicator
The ABCD Projection Indicator comprises several key components:
A, B, C Pivots and Zigzag Wave : These elements form the foundational structure of the ABCD pattern.
S Point : This is the location where the pattern is identified, positioned a few bars away from the confirmed C pivot.
Estimated D Pivot : The D pivot is projected based on the A, B, and C price levels. The time or distance to the D pivot is influenced by the starting point S.
Mini Stats Table : Located in the top right corner, this table displays win/loss ratios and risk/reward data for both bullish and bearish scenarios.
Fibonacci Levels : Calculated from the C to D pivots, these levels are provided as a reference for additional analysis.
🎲 Indicator Settings
The settings for the ABCD Projection Indicator are minimal and intuitive, with tooltips provided to guide users through the configuration process.

Oscillator Scatterplot Analysis [Trendoscope®]In this indicator, we demonstrate how to plot oscillator behavior of oversold-overbought against price movements in the form of scatterplots and perform analysis. Scatterplots are drawn on a graph containing x and y-axis, where x represent one measure whereas y represents another. We use the library Graph to collect the data and plot it as scatterplot.
Pictorial explanation of components is defined in the chart below.
🎲 This indicator performs following tasks
Calculate and plot oscillator
Identify oversold and overbought areas based on various methods
Measure the price and bar movement from overbought to oversold and vice versa and plot them on the chart.
In our example,
The x-axis represents price movement. The plots found on the right side of the graph has positive price movements, whereas the plots found on the left side of the graph has negative price movements.
The y-axis represents the number of bars it took for reaching overbought to oversold and/or oversold to overbought. Positive bars mean we are measuring oversold to overbought, whereas negative bars are a measure of overbought to oversold.
🎲 Graph is divided into 4 equal quadrants
Quadrant 1 is the top right portion of the graph. Plots in this quadrant represent the instances where positive price movement is observed when the oscillator moved from oversold to overbought
Quadrant 2 is the top left portion of the graph. Plots in this quadrant represent the instances where negative price movement is observed when the oscillator moved from oversold to overbought.
Quadrant 3 is the bottom left portion of the chart. Plots in this quadrant represent the instances where negative price movement is observed when the oscillator moved from overbought to oversold.
Quadrant 4 is the bottom right portion of the chart. Plots in this quadrant represent the instances where positive price movement is observed when the oscillator moved from overbought to oversold.
🎲 Indicator components in Detail
Let's dive deep into the indicator.
🎯 Oscillator Selection
Select the Oscillator and define the overbought oversold conditions through input settings
Indicator - Oscillator base used for performing analysis
Length - Loopback length on which the oscillator is calculated
OB/OS Method - We use Bollinger Bands, Keltener Channel and Donchian channel to calculate dynamic overbought and oversold levels instead of static 80-10. This is also useful as other type of indicators may not be within 0-100 range.
Length and Multiplier are used for the bands for calculating Overbought/Oversold boundaries.
🎯 Define Graph Properties
Select different graph properties from the input settings that will instruct how to display the scatterplot.
Type - this can be either scatterplot or heatmap. Scatterplot will display plots with specific transparency to indicate the data, whereas heatmap will display background with different transparencies.
Plot Color - this is the color in which the scatterplot or heatmap is drawn
Plot Size - applicable mainly for scatterplot. Since the character we use for scatterplot is very tiny, the large at present looks optimal. But, based on the user's screen size, we may need to select different sizes so that it will render properly.
Rows and Columns - Number of rows and columns allocated per quadrant. This means, the total size of the chart is 2X rows and 2X columns. Data sets are divided into buckets based on the number of available rows and columns. Hence, changing this can change the appearance of the overall chart, even though they are representing the same data. Also, please note that tables can have max 10000 cells. If we increase the rows and columns by too much, we may get runtime errors.
Outliers - this is used to exclude the extreme data. 20% outlier means, the chart will ignore bottom 20% and top 20% when defining the chart boundaries. However, the extreme data is still added to the boundaries.

Flags and Pennants [Trendoscope®]🎲 An extension to Chart Patterns based on Trend Line Pairs - Flags and Pennants
After exploring Algorithmic Identification and Classification of Chart Patterns and developing Auto Chart Patterns Indicator , we now delve into extensions of these patterns, focusing on Flag and Pennant Chart Patterns. These patterns evolve from basic trend line pair-based structures, often influenced by preceding market impulses.
🎲 Identification rules for the Extension Patterns
🎯 Identify the existence of Base Chart Patterns
Before identifying the flag and pennant patterns, we first need to identify the existence of following base trend line pair based converging or parallel patterns.
Ascending Channel
Descending Channel
Rising Wedge (Contracting)
Falling Wedge (Contracting)
Converging Triangle
Descending Triangle (Contracting)
Ascending Triangle (Contracting)
🎯 Identifying Extension Patterns.
The key to pinpointing these patterns lies in spotting a strong impulsive wave – akin to a flagpole – preceding a base pattern. This setup suggests potential for an extension pattern:
A Bullish Flag emerges from a positive impulse followed by a descending channel or a falling wedge
A Bearish Flag appears after a negative impulse leading to an ascending channel or a rising wedge.
A Bullish Pennant is indicated by a positive thrust preceding a converging triangle or ascending triangle.
A Bearish Pennant follows a negative impulse and a converging or descending triangle.
🎲 Pattern Classifications and Characteristics
🎯 Bullish Flag Pattern
Characteristics of Bullish Flag Pattern are as follows
Starts with a positive impulse wave
Immediately followed by either a short descending channel or a falling wedge
Here is an example of Bullish Flag Pattern
🎯 Bearish Flag Pattern
Characteristics of Bearish Flag Pattern are as follows
Starts with a negative impulse wave
Immediately followed by either a short ascending channel or a rising wedge
Here is an example of Bearish Flag Pattern
🎯 Bullish Pennant Pattern
Characteristics of Bullish Pennant Pattern are as follows
Starts with a positive impulse wave
Immediately followed by either a converging triangle or ascending triangle pattern.
Here is an example of Bullish Pennant Pattern
🎯 Bearish Pennant Pattern
Characteristics of Bearish Pennant Pattern are as follows
Starts with a negative impulse wave
Immediately followed by either a converging triangle or a descending converging triangle pattern.
Here is an example of Bearish Pennant Pattern
🎲 Trading Extension Patterns
In a strong market trend, it's common to see temporary periods of consolidation, forming patterns that either converge or range, often counter to the ongoing trend direction. Such pauses may lay the groundwork for the continuation of the trend post-breakout. The assumption that the trend will resume shapes the underlying bias of Flag and Pennant patterns
It's important, however, not to base decisions solely on past trends. Conducting personal back testing is crucial to ascertain the most effective entry and exit strategies for these patterns. Remember, the behavior of these patterns can vary significantly with the volatility of the asset and the specific timeframe being analyzed.
Approach the interpretation of these patterns with prudence, considering that market dynamics are subject to a wide array of influencing factors that might deviate from expected outcomes. For investors and traders, it's essential to engage in thorough back testing, establishing entry points, stop-loss orders, and target goals that align with your individual trading style and risk appetite. This step is key to assessing the viability of these patterns in line with your personal trading strategies and goals.
It's fairly common to witness a breakout followed by a swift price reversal after these patterns have formed. Additionally, there's room for innovation in trading by going against the bias if the breakout occurs in the opposite direction, specially when the trend before the formation of the pattern is in against the pattern bias.
🎲 Cheat Sheet
🎲 Indicator Settings
Custom Source : Enables users to set custom OHLC - this means, the indicator can also be applied on oscillators and other indicators having OHLC values.
Zigzag Settings : Allows users to enable different zigzag base and set length and depth for each zigzag.
Scanning Settings : Pattern scanning settings set some parameters that define the pattern recognition process.
Display Settings : Determine the display of indicators including colors, lines, labels etc.
Backtest Settings : Allows users to set a predetermined back test bars so that the indicator will not time out while trying to run for all available bars.

Auto Chart Patterns [Trendoscope®]🎲 Introducing our most comprehensive automatic chart pattern recognition indicator.
Last week, we published an idea on how to algorithmically identify and classify chart patterns.
This indicator is nothing but the initial implementation of the idea. Whatever we explained in that publication that users can do manually to identify and classify the pattern, this indicator will do it for them.
🎲 Process of identifying the patterns.
The bulk of the logic is implemented as part of the library - chartpatterns . The indicator is a shell that captures the user inputs and makes use of the library to deliver the outcome.
🎯 Here is the list of steps executed to identify the patterns on the chart.
Derive multi level recursive zigzag for multiple base zigzag length and depth combinations.
For each zigzag and level, check the last 5 pivots or 6 pivots (based on the input setting) for possibility of valid trend line pairs.
If there is a valid trend line pair, then there is pattern.
🎯 Rules for identifying the valid trend line pairs
There should be at least two trend lines that does not intersect between the starting and ending pivots.
The upper trend line should touch all the pivot highs of the last 5 or 6 pivots considered for scanning the patterns
The lower trend line should touch all the pivot lows of the last 5 or 6 pivots considered for scanning the patterns.
None of the candles from starting pivot to ending pivot should fall outside the trend lines (above upper trend line and below lower trend line)
The existence of a valid trend line pair signifies the existence of pattern. What type of pattern it is, to identify that we need to go through the classification rules.
🎲 Process of classification of the patterns.
We need to gather the following information before we classify the pattern.
Direction of upper trend line - rising, falling or flat
Direction of lower trend line - rising, falling or flat
Characteristics of trend line pair - converging, expanding, parallel
🎯 Broader Classifications
Broader classification would include the following types.
🚩 Classification Based on Geometrical Shapes
This includes
Wedges - both trend lines are moving in the same direction. But, the trend lines are either converging or diverging and not parallel to each other.
Triangles - trend lines are moving in different directions. Naturally, they are either converging or diverging.
Channels - Both trend lines are moving in the same direction, and they are parallel to each other within the limits of error.
🚩 Classification Based on Pattern Direction
This includes
Ascending/Rising Patterns - No trend line is moving in the downward direction and at least one trend line is moving upwards
Descending/Falling Patterns - No trend line is moving in the upward direction, and at least one trend line is moving downwards.
Flat - Both Trend Lines are Flat
Bi-Directional - Both trend lines are moving in opposite direction and none of them is flat.
🚩 Classification Based on Formation Dynamics
This includes
Converging Patterns - Trend Lines are converging towards each other
Diverging Patterns - Trend Lines are diverging from each other
Parallel Patterns - Trend Lines are parallel to each others
🎯 Individual Pattern Types
Now we have broader classifications. Let's go through in detail to find out fine-grained classification of each individual patterns.
🚩 Ascending/Uptrend Channel
This pattern belongs to the broader classifications - Ascending Patterns, Parallel Patterns and Channels. The rules for the Ascending/Uptrend Channel pattern are as below
Both trend lines are rising
Trend lines are parallel to each other
🚩 Descending/Downtrend Channel
This pattern belongs to the broader classifications - Descending Patterns, Parallel Patterns and Channels. The rules for the Descending/Downtrend Channel pattern are as below
Both trend lines are falling
Trend lines are parallel to each other
🚩 Ranging Channel
This pattern belongs to the broader classifications - Flat Patterns, Parallel Patterns and Channels. The rules for the Ranging Channel pattern are as below
Both trend lines are flat
Trend lines are parallel to each other
🚩 Rising Wedge - Expanding
This pattern belongs to the broader classifications - Rising Patterns, Diverging Patterns and Wedges. The rules for the Expanding Rising Wedge pattern are as below
Both trend lines are rising
Trend Lines are diverging.
🚩 Rising Wedge - Contracting
This pattern belongs to the broader classifications - Rising Patterns, Converging Patterns and Wedges. The rules for the Contracting Rising Wedge pattern are as below
Both trend lines are rising
Trend Lines are converging.
🚩 Falling Wedge - Expanding
This pattern belongs to the broader classifications - Falling Patterns, Diverging Patterns and Wedges. The rules for the Expanding Falling Wedge pattern are as below
Both trend lines are falling
Trend Lines are diverging.
🚩 Falling Wedge - Contracting
This pattern belongs to the broader classifications - Falling Patterns, Converging Patterns and Wedges. The rules for the Converging Falling Wedge are as below
Both trend lines are falling
Trend Lines are converging.
🚩 Rising/Ascending Triangle - Expanding
This pattern belongs to the broader classifications - Rising Patterns, Diverging Patterns and Triangles. The rules for the Expanding Ascending Triangle pattern are as below
The upper trend line is rising
The lower trend line is flat
Naturally, the trend lines are diverging from each other
🚩 Rising/Ascending Triangle - Contracting
This pattern belongs to the broader classifications - Rising Patterns, Converging Patterns and Triangles. The rules for the Contracting Ascending Triangle pattern are as below
The upper trend line is flat
The lower trend line is rising
Naturally, the trend lines are converging.
🚩 Falling/Descending Triangle - Expanding
This pattern belongs to the broader classifications - Falling Patterns, Diverging Patterns and Triangles. The rules for the Expanding Descending Triangle pattern are as below
The upper trend line is flat
The lower trend line is falling
Naturally, the trend lines are diverging from each other
🚩 Falling/Descending Triangle - Contracting
This pattern belongs to the broader classifications - Falling Patterns, Converging Patterns and Triangles. The rules for the Contracting Descending Triangle pattern are as below
The upper trend line is falling
The lower trend line is flat
Naturally, the trend lines are converging.
🚩 Converging Triangle
This pattern belongs to the broader classifications - Bi-Directional Patterns, Converging Patterns and Triangles. The rules for the Converging Triangle pattern are as below
The upper trend line is falling
The lower trend line is rising
Naturally, the trend lines are converging.
🚩 Diverging Triangle
This pattern belongs to the broader classifications - Bi-Directional Patterns, Diverging Patterns and Triangles. The rules for the Diverging Triangle pattern are as below
The upper trend line is rising
The lower trend line is falling
Naturally, the trend lines are diverging from each other.
🎲 Indicator Settings - Auto Chart Patterns
🎯 Zigzag Settings
Zigzag settings allow users to select the number of zigzag combinations to be used for pattern scanning, and also allows users to set zigzag length and depth combinations.
🎯 Scanning Settings
Number of Pivots - This can be either 5 or 6. Represents the number of pivots used for identification of patterns.
Error Threshold - Error threshold used for initial trend line validation.
Flat Threshold - Flat angle threshold is used to identify the slope and direction of trend lines.
Last Pivot Direction - Filters patterns based on the last pivot direction. The values can be up, down, both, or custom. When custom is selected, then the individual pattern specific last pivot direction setting is used instead of the generic one.
Verify Bar Ratio - Provides option to ignore extreme patterns where the ratios of zigzag lines are not proportionate to each other.
Avoid Overlap - When selected, the patterns that overlap with existing patterns will be ignored while scanning. Meaning, if the new pattern starting point falls between the start and end of an existing pattern, it will be ignored.
🎯 Group Classification Filters
Allows users to enable disable patterns based on group classifications.
🚩 Geometric Shapes Based Classifications
Wedges - Rising Wedge Expanding, Falling Wedge Expanding, Rising Wedge Contracting, Falling Wedge Contracting.
Channels - Ascending Channel, Descending Channel, Ranging Channel
Triangles - Converging Triangle, Diverging Triangle, Ascending Triangle Expanding, Descending Triangle Expanding, Ascending Triangle Contrcting and Descending Triangle Contracting
🚩 Direction Based Classifications
Rising - Rising Wedge Contracting, Rising Wedge Expanding, Ascending Triangle Contracting, Ascending Triangle Expanding and Ascending Channel
Falling - Falling Wedge Contracting, Falling Wedge Expanding, Descending Triangle Contracting, Descending Triangle Expanding and Descending Channel
Flat/Bi-directional - Ranging Channel, Converging Triangle, Diverging Triangle
🚩 Formation Dynamics Based Classifications
Expanding - Rising Wedge Expanding, Falling Wedge Expanding, Ascending Triangle Expanding, Descending Triangle Expanding, Diverging Triangle
Contracting - Rising Wedge Contracting, Falling Wedge Contracting, Ascending Triangle Contracting, Descending Triangle Contracting, Converging Triangle
Parallel - Ascending Channel, Descending Channgel and Ranging Channel
🎯 Individual Pattern Filters
These settings allow users to enable/disable individual patterns and also set last pivot direction filter individually for each pattern. Individual Last Pivot direction filters are only considered if the main "Last Pivot Direction" filter is set to "custom"
🎯 Display Settings
These are the settings that determine the indicator display. The details are provided in the tooltips and are self explanatory.
🎯 Alerts
A basic alert message is enabled upon detection of new pattern on the chart.

Multi-Timeframe Recursive Zigzag [Trendoscope®]🎲 Welcome to the Advanced World of Zigzag Analysis
Embark on a journey through the most comprehensive and feature-rich Zigzag implementation you’ll ever encounter. Our Multi-Timeframe Recursive Zigzag Indicator is not just another tool; it's a groundbreaking advancement in technical analysis.
🎯 Key Features
Multi Time-Frame Support - One of the rare open-source Zigzag indicators with robust multi-timeframe capabilities, this feature sets our tool apart, enabling a broader and more dynamic market analysis.
Innovative Recursive Zigzag Algorithm - At its core is our unique Recursive Zigzag Algorithm, a pioneering development that powers multiple Zigzag levels, offering an intricate view of market movements. This proprietary algorithm is the backbone of our advanced pattern recognition indicators.
Sub-Waves and Micro-Waves Analysis - Dive deeper into market trends with our Sub-Waves and Micro-Waves feature. Sub-Waves reveal the interconnectedness of various Zigzag levels, while Micro-Waves offer insight into the fundamental waves at the base level.
Enhanced Indicator Tracking - Integrate and track your custom indicators or oscillators with the zigzag, capturing their values at each Zigzag level, complete with retracement ratios. This offers a comprehensive view of market dynamics.
Curved Zigzag Visualization - Experience a new way of visualizing market movements with our Curved Zigzag Display, employing Pine Script’s polyline feature for a more intuitive and visually appealing representation.
Built-in Customizable Alerts - Stay ahead with built-in alerts that can be customized via user input settings.
🎯 Practical Applications
Our Zigzag Indicator is designed with an understanding of its inherent nature - the last unconfirmed pivot that consistently repaints. This characteristic, while by design, directs its usage more towards pattern recognition rather than direct identification of market tops and bottoms. Here's how you can leverage the Zigzag Indicator:
Harmonic Patterns - Ideal for those familiar with harmonic patterns, this tool simplifies the manual spotting of complex XABCD, ABC, and ABCD patterns on charts.
Chart Patterns - Effortlessly identify patterns like Double/Triple Taps, Head and Shoulders, Inverse Head and Shoulders, and Cup and Handle patterns with enhanced clarity. Navigate through challenging patterns such as Triangles, Wedges, Flags, and Price Channels, where the Zigzag Indicator adds a layer of precision to your breakout strategy.
Elliott Wave Components - The indicator's detailed pivot highlighting aids in identifying key Elliott Wave components, enhancing your wave analysis and decision-making process.
🎲 Deep Dive into Indicator Features
Join us as we explore the intricate features of our indicator in more detail.
🎯 Multi-Timeframe Capability
Our indicator comes equipped with an input option for selecting the desired resolution. This unique feature allows users to view higher timeframe Zigzag patterns directly on their lower timeframe charts.
🎯 Recursive Multi Level Zigzag
Our advanced recursive approach creates multi-level Zigzags from lower-level data. For instance, the level 0 Zigzag forms the base, calculated from specified length and depth parameters, while level 1 Zigzag is derived using level 0 as its foundation, and so forth.
The indicator not only displays multiple Zigzag levels but also offers settings to emphasize specific levels for more detailed analysis.
🎯 Sub-Components and Micro-Components of Zigzag Wave
Sub-components within a Zigzag wave consist of the previous level's Zigzag pivots. Meanwhile, the micro-components are composed of the base level (Level 0) Zigzag pivots encapsulated within the wave.
🎯 Curved Zigzag
Experience a new perspective with our curved Zigzag display. This innovative feature utilizes the polyline curved option to automatically generate sinusoidal waves based on multiple points.
🎯 Indicator Tracking
Default indicators such as RSI, MFI, and OBV are included, alongside the ability to track one external indicator at each Zigzag pivot.
🎯 Customizable Alerts
Our indicator employs the `alert()` function for alert creation. While this means the absence of a customization text box in the alert settings, we've included a custom text area for users to create their own alert templates.
Template placeholders include:
{alertType} - type of alert. Either Confirmed Pivot Update or Last Pivot Update. Depends on the alert type selected in the inputs.
When Last Pivot Update type is selected, the alerts are triggered whenever there is a new Zigzag Pivot. This may also be a repaint of last unconfirmed pivot.
When Confirmed Pivot Update type is selected, the alerts are triggered only when a pivot becomes a confirmed pivot.
{level} - Zigzag level on which the alert is triggered.
{pivot} - Details of the last pivot or confirmed pivot including price, ratio, indicator values and ratios, subcomponent and micro-component pivots.
🎲 User Settings Overview
🎯 Zigzag and Generic Settings
This involves some generic zigzag calculation settings such as length, depth, and timeframe. And few display options such as theme, Highlight Level and Curved Zigzag. By default, zigzag calculation is done based on the latest real time bar. An option is provided to disable this and use only confirmed bars for the calculation.
Indicator Settings
Allows users to track one or more oscillators or volume indicators. Option to add any indicator via external input is provided.
🎯 Alert Settings
Has input fields required to select and customize alerts.

Zigzag Tails [Trendoscope®] 🎲 Introducing Zigzag Tails Indicator by Trendoscope.
The Zigzag Tails Indicator, a groundbreaking tool from Trendoscope, redefines technical analysis by seamlessly integrating anchored VWAPs (Volume Weighted Average Prices) and Average Price calculations with Zigzag pivot points. This advanced indicator recalculates Average Price or VWAP from one Zigzag pivot to the next, offering unparalleled insights into market movements.
🎯 Innovative Design
Each Zigzag pivot can feature up to three distinct tails, corresponding to the high, low, and close prices of each candle. Users have the flexibility to select between Average Price and VWAP for display on their charts. By default, the indicator plots all three tails, but individual tail visibility is customizable via the settings panel.
Average Price Mode: When selected, tails depict the average price across a specified number of bars.
VWAP Mode: In this mode, tails represent the VWAP, calculated for a given price over a set number of bars.
🎯 Dynamic Dotted Tail
The Zigzag Tails Indicator features dotted tails that extend from the last Zigzag pivot to the current bar. These dotted tails dynamically adapt to market changes and are subject to repainting with the emergence of new Zigzag pivots.
When repainting is enabled, the dotted tails originate from the last unconfirmed Zigzag pivot, extending to the current bar. This setting offers a more immediate, albeit tentative, visual representation of market trends.
With repainting disabled, the dotted tails will be anchored from the last confirmed Zigzag pivot to the current bar, providing a more stable but slightly delayed market analysis.
Irrespective of the repaint option, the dotted dynamic tails is always expected to repaint.
🎯 Practical Applications
The Zigzag Tails Indicator provides more accurate support and resistance levels than traditional VWAP, rolling VWAP, or moving averages. Its precision makes it an invaluable tool for identifying trends, as well as potential trend continuations or reversals.
🛠 Indicator Settings
Zigzag Configuration:
Zigzag Length determines the loopback length for the foundational Zigzag calculation.
Number of Bars represent the calculation distance. This limitation is added to avoid runtime errors on lower timeframes. The calculations run through lots of loops. Hence, if it is run across too many bars, we may get timeout issues.
Repaint: Activating this will also display the last, unconfirmed Zigzag pivot. Since the last pivot is inherently tentative, it may repaint with the arrival of new bars. A pivot is confirmed only when a subsequent unconfirmed pivot emerges on the chart.
Tail Configuration
Tail Type: Choose between average and VWAP for the tail calculation. The average option plots a simple average, while the VWAP option calculates an anchored VWAP from pivot to pivot.
Display Options: Tailored display options for High, Low, Close prices, with customizable colors for each tail type.
Inspired by the ideas of @KioseffTrading's implementation of Zigzag Anchored VWAP

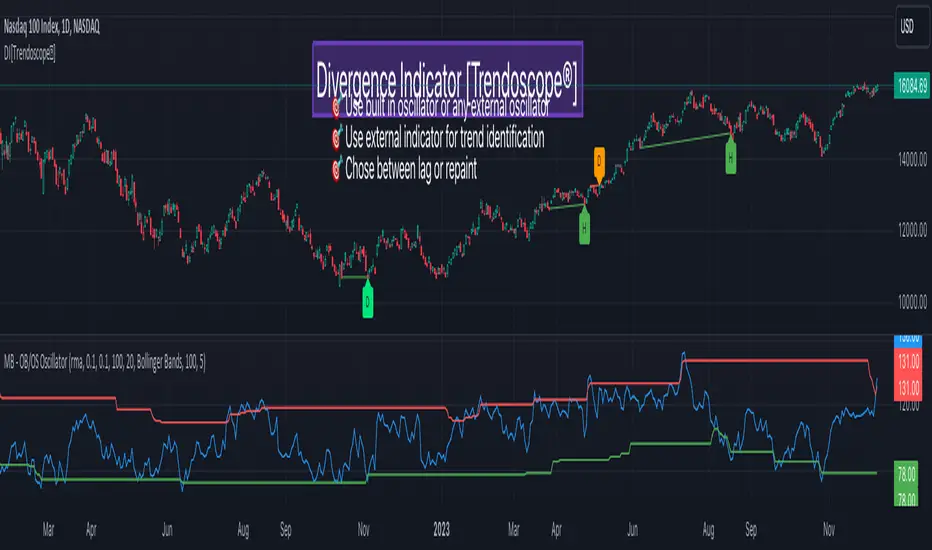
Divergence Indicator [Trendoscope®]🎲 New Divergence Indicator by Trendoscope
Our latest Divergence Indicator revolutionizes the way traders identify market trends and potential reversals. Built upon the robust foundation of the Zigzag Trend Divergence Detector and inline with our recent implementation of the Divergence Goggles indicator, this tool is designed to be intuitive yet powerful, making it an essential addition to any trader's toolkit.
We received several queries on extending the Divergence Goggles to last N bars instead of using an interactive widget. Though it is possible, we thought the better approach is to enable the indicator to use any oscillator and trend indicator in order to define the divergence.
🎯 Key Features
Flexible Oscillator Integration : Choose from a wide range of built-in oscillators or import your own, including options like the innovative Multiband Oscillator. This versatility extends to using volume indicators like OBV for divergence calculations, broadening the scope of analysis.
Trend Identification Versatility : Utilize built-in methods like Zigzag and MA Difference, or integrate external trend indicators. Our system adapts to various methods, ensuring you have the right tools for precise trend identification.
Customizable Zigzag Sensitivity : Adjust the Zigzag based on your chosen oscillator's sensitivity to ensure divergence lines are accurate and visually coherent.
Repainting vs. Delayed Signals : Tailor the indicator to your strategy by choosing between immediate repainting signals and slightly delayed but more stable signals.
🎯 Understanding Divergence: Key Rules
Bullish Divergence
Happens only in downtrend
Observed on Pivot Lows
Price makes lower low whereas oscillator makes higher low, indicating weakness and possible reversal
Bearish Divergence
Happens only in uptrend
Observed on Pivot Highs
Price makes higher high whereas oscillator makes lower high, indicating weakness and possible reversal
Bullish Hidden Divergence
Happens only in uptrend
Observed on Pivot Lows
Price makes higher low, whereas indicator makes lower low due to price consolidation. In bullish trend, this is considered as bullish as the price gets a breather and get ready to surge further.
Bearish Hidden Divergence
Happens only in downtrend
Observed on Pivot Highs
Price makes lower high whereas oscillator makes higher high due to price consolidation. In bearish trend, this is considered as bearish as the price gets a breather and get ready to fall further.
🎯 Visual Insights: Divergence and Hidden Divergence
For a clearer understanding, refer to our visual guides:
🎲 Using the Divergence Indicator: A Step-by-Step Guide
🎯 Step 1 - Selecting the Oscillator
Customize your analysis by choosing from a variety of oscillators or importing your preferred one. Options are available to select a range of built-in oscillators and the loopback length. However, if the oscillator that user want to use is not in the list, they can simply load the oscillator from the indicator library and use it as an external signal.
In our current example, we are using a custom oscillator called - Multiband Oscillator
This also means, the indicator option is not limited to oscillators. Users can even make use of volume indicators such as OBV for the calculation of divergence.
🎯 Step 2 - Choosing the Trend Identification Method
Select from our built-in methods or integrate an external indicator to accurately identify market trends. Trend is one of the key parameters of divergence type identification. Trend can be identified mathematically by various methods. Some of them are as simple as above or below 200 moving average and some can follow trend based indicators such as supertrend and others can be very complex.
To cater for a wider audience, here too we have provided the option to use an external trend indicator. The simple condition for the external trend indicator is that it should return positive value for uptrend and negative value for downtrend.
Other than that, we also have 2 built in trend identification methods.
Zigzag - The trend is defined by the starting pivot of divergence line. If the starting pivot is Higher High or Higher Low, then it is considered uptrend. And if the starting pivot is either Lower Low or Lower High, then we consider it as downtrend.
MA Difference - In this case, the difference between the moving average of pivots joining the divergence line will determine the trend. It is considered uptrend if the moving average increased from starting pivot to ending pivot of the divergence line, and it is considered downtrend if the moving average decreased from starting pivot to the ending pivot of the divergence line.
🎯 Step 3 - Adjusting Zigzag Sensitivity
Fine-tune the Zigzag to match the oscillator's sensitivity, ensuring divergence lines are accurate and visually coherent.
🎯 Step 4 - Managing Repainting
Understand the implications of repainting in the last pivot of the Zigzag and choose between immediate or delayed signals based on your trading strategy. The last pivot of the zigzag repaint by design. This is not necessarily a bad thing. Users can just choose not to use the last pivot, but instead use the last but one for all the calculations. But, this also means, the signals will be delayed.
Indicator provides option to use repainting signal vs delayed signal. If you select the repaint option, the signals are shown immediately as and when they occur. But, there is a possibility that these signals change when the new price candles change zigzag pivot.
If you chose not to select the repaint option, then the divergence signals may lag by a few bars.
RSI-Divergence Goggles [Trendoscope®]🎲 Introducing the RSI-Divergence Goggle
🎯 Revolutionizing Divergence Analysis in Trading
While the concept of divergence plays a crucial role in technical analysis, existing indicators in the community library have faced limitations, particularly in simultaneously displaying divergence lines on both price and oscillator graphs. This challenge stems from the fact that RSI and other oscillators are typically plotted in a separate pane from the price chart. Traditional Pine Script® indicators are confined to a single pane, thus restricting comprehensive divergence analysis.
🎯 Our Innovative Solution: RSI on the Price Pane
The RSI-Divergence Goggle breaks through these limitations. Our innovative approach involves plotting the RSI directly onto the price pane within a movable and resizable widget. This groundbreaking feature allows for the simultaneous drawing of zigzag patterns on both price and the oscillator, enabling the effective calculation and visualization of divergence lines on both.
🎯 The Foundation: Our Divergence Research and Rules
Our journey into divergence research began three years ago with the launch of the "Zigzag Trend Divergence Detector." The foundational rules established with this script remain pertinent and form the basis of all our subsequent divergence-based indicators.
🎯 Understanding Divergence: Key Concepts
Divergence Varieties : We identify two main types - Bullish Divergence (and its hidden counterpart) occurs at pivot lows, while Bearish Divergence (and its hidden version) appears at pivot highs.
Contextual Occurrence : Bullish divergence is a phenomenon of downtrends, whereas bearish divergence is unique to uptrend. Conversely, hidden bullish divergence arises in uptrends, and hidden bearish divergence in downtrends.
Oscillator Behavior : In standard divergence scenarios, the oscillator lags behind price, signaling potential reversals. In hidden divergence cases, the oscillator leads, suggesting trend continuation.
🎯 Visual Insights: Divergence and Hidden Divergence
For a clearer understanding, refer to our visual guides:
🎯 A Word of Caution
While divergence is a powerful tool, it's not a standalone guarantee of trend reversals or continuations. We recommend using these patterns in conjunction with support and resistance levels, as demonstrated in our "Divergence Based Support Resistance" implementation.
🎯 Using the RSI-Divergence Goggles
Upon applying the indicator to your chart, you'll be prompted to select two corner points, defining the widget's placement and size. This widget is the stage for your RSI plotting and divergence calculations. Choose these points carefully to ensure they encompass your area of interest without overlapping important price bars.
An example as below.
🎯 Innovative Features:
Plotting RSI: RSI values are scaled from 0 to 100 within the widget. This unique plotting may not align with individual bar values, but pivot labels and tooltips provide detailed RSI and retracement ratio information.
Zigzag and Pivots: Our adjusted RSI plots determine the zigzag pivot highs and lows, which may not always correspond with visible price pivots. However, calculations based on close prices ensure minimal deviation.
Divergence Display: Divergence types are identified following our established rules, with a simple moving average employed to discern the prevailing trend.
🎯 Trend Detection Mechanism
A simple moving average is used as base for determining the trend. If the difference between moving averages of the alternate pivots is positive, then the sentiment is considered to be uptrend. Else, we consider the sentiment to be in downtrend.
This is a simple method to identify trend, implemented via this indicator. The indicator does not provide alternative methods to identify trend. This is something that we can explore in the future.
🎯 Interactive and Customizable
The RSI-Divergence Goggle isn't just a static tool; it's an interactive feature on your chart. You can move or resize the widget, allowing for dynamic analysis and focused study on different chart segments.

Oscillator Volume Profile [Trendoscope®]The Oscillator Volume Profile indicator is designed to construct a volume profile based on predefined oscillator levels. It integrates volume data with oscillator readings to offer a unique perspective on market dynamics.
🎲 Selectable Oscillators:
Users can select from an array of oscillator options for the basis of the volume profile, including:
Relative Strength Index (RSI)
Chande Momentum Oscillator (CMO)
Center of Gravity (COG)
Money Flow Index (MFI)
Rate of Change (ROC)
Commodity Channel Index (CCI)
Stochastic Oscillator (Stoch)
True Strength Index (TSI)
Williams %R (WPR)
The length parameters - Length, Fast Length, Slow Length allows users to define the period over which the chosen oscillator is calculated, tailoring the sensitivity of the indicator to their trading strategy.
🎲 Dynamic Overbought/Oversold Ranges:
This indicator enhances traditional concepts by introducing dynamic overbought and oversold levels. These adaptable thresholds are calculated using various methods, including:
🎯 Highest/Lowest Range Method : This method establishes the range based on the highest and lowest values of the oscillator within the last N bars.
🎯 Moving Average Range Method : The range is derived from a moving average of the oscillator, providing a smoothed threshold that reflects more recent market conditions.
In addition to these methods, the indicator incorporates a unique 'Sticky Border' feature:
🎯 Sticky Border: With this option enabled, the dynamic ranges maintain their levels until the oscillator breaks out of the range. Once a breakout occurs, the levels are recalculated and updated. This mechanism ensures that the borders remain consistent and relevant, only adjusting to significant market movements that warrant a recalculation.
Users can select their preferred method for determining dynamic ranges, allowing for a customized approach that aligns with their analysis and trading strategy. The sticky border feature further refines this functionality, offering continuity until a decisive market move occurs.
🎲 Volume Profile Calculation Parameters:
🎯 Trend Filter: The indicator provides a versatile trend filter with four selectable options:
Uptrend: The volume profile is calculated when the oscillator indicates an uptrend.
Downtrend: The volume profile is calculated when the oscillator indicates a downtrend.
Any: The volume profile is calculated regardless of the trend.
External: Users can input values from an external indicator. The volume profile is then calculated only when the external indicator's value is non-zero, integrating external analysis into the volume profile construction.
🎯 Precision: Users have the option to define the precision for calculating the volume profile, which is crucial due to the varying scales of different oscillators (e.g., some oscillators range from 0 to 100, while others from -1 to 1). Selecting an appropriate precision ensures that the volume profile is accurately aligned with the minimal price range significant to the chosen oscillator. This setting requires user intervention for optimal configuration, as automatic calculation is not feasible due to the diverse nature of oscillator ranges.
🎯 Number of Bars: Users can select a specific number of bars for volume profile calculation, or opt to include all available historical bars for a comprehensive profile.
🎲 Selecting the right precision:
Users must select the right precision based on their choice of indicator. For example, RSI values range from 0-100. Hence, the default precision of 1 work fine on RSI as the volume profiles are plotted from 0 to 100 at the interval of 0.1
But, the default precision of 1 will not be ok on TSI because TSI values range from -1 to 1. Hence, using 1 as precision will result in very less volume profile lines as shown below.
Due to this, it is necessary to increase the precision for oscillators such as TSI where the range between highest and lowest value is far less. Once we set the precision to 2, we can see more appropriate volume profile division.
🎲 Note of thanks:
This publication uses polyline feature for drawing volume profiles. The advantage of using polyline is that we can overcome max 500 lines issue that we face by using the regular line objects. More details of polyline can be found in the tradingview blog post
Further, using polyline for display of volume profiles is inspired by the publications of fikira and KioseffTrading

Volume Spike Analysis [Trendoscope]The Volume Spike Analysis is designed to detect volume spikes in a trading instrument's data. Rather than relying on the traditional method of comparing volume to its moving average, this indicator employs a distinctive approach to ensure accuracy.
Methodology
Historical Volume Comparison: The indicator first assesses the current bar's volume, say 100k, and looks back historically to determine the last instance when the volume was equal to or exceeded this level.
High Volume Bar Gap Calculation: The intervals or gaps between high volume bars are recorded. These gaps help in determining how common or rare a particular volume spike is.
Spike Magnitude Determination: Here, the extent of the volume spike is gauged in relation to either the median, lowest, or average volume of the intervening bars. The reference metric (median, lowest, or average) can be chosen by the user through the "Volume Spike Reference" input parameter.
Spike Percentile Analysis: The calculated spike magnitude (as a percentage of the reference volume) is cataloged. This collection aids in understanding the relative intensity of the current volume spike when compared to previous spikes.
Threshold Comparisons: The indicator then compares the calculated "High Volume Distance Percentile" to the "Last High Volume Distance Percentile" and the "Volume Spike Percentile" to the "Volume Spike Threshold". If these values surpass the preset thresholds, the current bar is flagged as a high volume or volume spike bar.
Visual Components
Bar Highlighting : High volume or volume spike bars are accentuated with bright colors for easy identification. All other bars have increased transparency to reduce visual clutter.
Distance from the High Volume Bar: Indication of the number of bars since the last high volume occurrence and its respective percentile.
Comparative Factors: A factor representing the magnitude by which the current volume surpasses the lowest, median, and average volumes.
Lowest, Median and Average Volumes: The lowest and median volumes are indicated by tooltips on lines marking the respective bars. The average volume is depicted as a dotted horizontal line, with a triangle marker tooltip revealing its value.
This indicator offers a nuanced analysis of volume spikes, aiding traders in making more informed decisions.

ABC on Recursive Zigzag [Trendoscope]There are several implementations of ABC pattern in tradingview and pine script. However, we have made this indicator to provide users additional quantifiable information along with flexibility to experiment and develop their own strategy based on the patterns.
🎲 Highlights of this indicator over other ABC implementations are:
Implementation is based on recursive multi level zigzag allows bigger as well as smaller patterns to be identified
Allows users to set their trading rules with respect to entry, target and stop ratios, experiment and build their own strategy based on the ABC pattern.
Back test summary including win ratio and risk reward will help users understand the profitability based on different settings being used.
🎲 Concept of ABC Pattern
The ABC pattern, also known as the "Corrective Wave" or "Zigzag Pattern," is a fundamental concept in Elliott Wave Theory, which is widely used in technical analysis to identify and predict price movements in financial markets.
The ABC pattern is a three-wave corrective pattern that typically occurs within the context of a larger impulse or trending wave. It consists of two smaller waves in the opposite direction (A and C) separated by a corrective wave (B). These waves are labeled alphabetically and represent price movements.
Wave A (Impulse Wave): Wave A is the first leg of the ABC pattern and is characterized by a strong price move in the opposite direction of the prevailing trend. It is often driven by a fundamental or sentiment-driven event that temporarily disrupts the trend.
Wave B (Corrective Wave): Wave B is the corrective wave that follows Wave A. It represents a partial retracement of Wave A's price movement. Wave B can take various forms, such as a simple correction or a complex correction (e.g., a triangle or a flat correction). It typically doesn't retrace the entire length of Wave A.
Wave C (Impulse Wave): Wave C is the final leg of the ABC pattern and is characterized by a strong price move in the same direction as the prevailing trend. It often surpasses the starting point of Wave A and confirms the resumption of the larger trend.
🎲 Indicator Components
Upon loading the indicator on the chart, we can observe the following components on the chart.
Pattern Drawings is the graphical representation of present patterns. Please note that it is not necessary for patterns to be there on the chart all the time. Patterns will appear on the chart when price makes the patterns.
Trade Box is the box representing trade signals of the pattern. These trade levels are generated based on the user settings.
Summary Table is the back test summary containing details of historical pattern performance including Win Ratio and Risk Reward.
🎲 Indicator Settings
Details of each user settings are provided in the tooltips. Below is the snapshot of it.
🎲 Alerts
Basic level of alerts are built in the script using alert function to highlight the following conditions:
New ABC Pattern
Updates to existing Pattern
Both conditions will alert simple text messages. There is not much customization provided as part of this indicator. We will consider providing more options in future versions based on the interest and demand shown by users.

Historical Pattern Matcher [Trendoscope]Do you believe in patterns and think price movements are more likely to follow historical patterns? If yes, this is an indicator for you.
🎲 Concept
The patterns in this script are not a named or known pattern. But, it can be any pattern that happen to repeat again and again over a period of time.
The indicator collects the following information over a period of time.
Collects all possible patterns for specified number of pivots based on relation between each pivot prices. (Default 6)
Keeps track of all the possible patterns for the given pivots and number of occurrences of such patterns over a period of time.
Collects the movement of next pivot (in terms of retracement ratio) after the pattern has formed for each occurrence.
Keeps track of the last occurrence of each pattern collected
And the indicator presents on chart following information
Current Pattern drawing based on last confirmed pivot.
Current Pattern drawing based on current unconfirmed pivot in the opposite direction.
Projection range based on historical retracement ratio for both patterns
Detailed info on last occurrence and overall occurrences.
Last occurrence of both confirmed and unconfirmed pivot patterns.
Please note that, if the patterns have not been repeated over a period, then it will not be shown on the screen. Hence, it is perfectly normal to not see any projection. This can happen when the current pattern has not been repeated any time before.
🎲 Details
When you load the indicator on the chart, you may see the following patterns and projections.
You may also notice, in the pattern details, information about the last occurrence of the pattern. If you scroll on your chart to the left to the given data and time, you can observe how the past occurrence of the pattern has formed and the price movement past that point.
For example, last occurrence of pattern based on confirmed pivot happened on 02-Jun-2023 00:00 UTC time
And last occurrence of pattern based on unconfirmed pivot happened on 27-Apr-2023 22:00 UTC time
🎲 Settings
Settings are minimal, and here is the meaning of them.
Most important setting here is the number of pivots forming the pattern.
🎲 Caution
The indicator is designed to present the projection based on historical occurrences of similar price pattern. This does not necessarily mean the patterns are supposed to be bullish or bearish. But, it will certainly give users an idea of what happened when similar price action presented historically.
Note to developers This script makes use of new pine script feature - maps
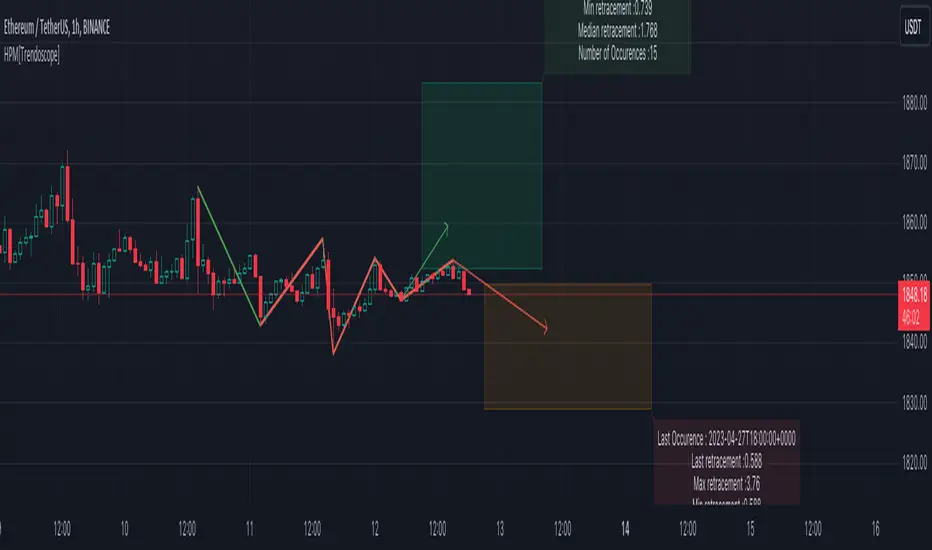
Volume Forks [Trendoscope]🎲 Volume Forks - Advanced Price Analysis with Recursive Auto-Pitchfork and Angled Volume Profile
The Volume Forks Indicator is a comprehensive research tool that combines two innovative techniques, Recursive Auto-Pitchfork and Angled Volume Profile . This indicator provides traders with valuable insights into price dynamics by integrating accurate pitchfork drawing and volume analysis over angled levels. The indicator does following things
Detects Pitchfork formations automatically on the chart over Recursive Zigzag
Instead of drawing forks based on fib levels, volume distribution over ABC of pitchfork is calculated and drawn in the direction of the handle.
🎲 Brief about Pitchfork
Pitchfork is drawn when price forms ABC pattern. Pitchfork draws a series of parallel lines in the direction of trend which can be used for support and resistance.
There are many methods of drawing pitchfork. In all cases, a line joining BC will make the base of pitchfork and fork lines are drawn from different points of the base. All the fork lines will be parallel. But, the handle of the base defines the direction of fork lines. Classification of pitchfork is mainly based on the starting and ending points of the handle.
🎲 Regular Types
Here, end of the handle is always fixed and it will be the mid point of B and C.
🎯 Andrews Pitchfork
Handle starts from A and joins the base at mid of B and C.
Forks are drawn based on fib ratios from the handle
🎯 Schiff Pitchfork
Handle starts from Bar of A and price of middle of AB and joins the base at mid of B and C
Forks are drawn based on fib ratios from the handle
🎯 Modified Schiff Pitchfork
Handle starts from mid of A and B and joins the base at mid of B and C
Forks are drawn based on fib ratios from the handle
🎲 Inside Types
Here, C will act as end of the handle which joins the Base BC .
🎯 Andrews Pitchfork (Inside)
Handle starts from A and joins the base at C
Forks are drawn based on fib ratios from the handle
🎯 Schiff Pitchfork (Inside)
Handle starts from Bar of A and price of (A+B)/2 and joins the base at C
Forks are drawn based on fib ratios from the handle
🎯 Modified Schiff Pitchfork (Inside)
Handle starts from mid of A and B and joins the base at C
Forks are drawn based on fib ratios from the handle
🎲 Brief about Pitchfork
The Angled Volume Profile technique expands on the concept of volume profile by measuring volume distribution levels over angled levels rather than just horizontal levels. By selecting a starting point and angle interactively, traders can assess volume distribution within specific price trends. This feature is particularly useful for analysing volume dynamics in trending markets.
🎲 Settings
Indicator settings include few things which determine the scanning of pitchforks and few which determines drawing of volume profile lines.
Please note that, due to pine limitations of 500 lines, if there are too many formations on the chart, volume profile may not appear correctly. If that happens, please reduce the number of volume forks per formation.

Recursive Micro Zigzag🎲 Overview
Zigzag is basic building block for any pattern recognition algorithm. This indicator is a research-oriented tool that combines the concepts of Micro Zigzag and Recursive Zigzag to facilitate a comprehensive analysis of price patterns. This indicator focuses on deriving zigzag on multiple levels in more efficient and enhanced manner in order to support enhanced pattern recognition.
The Recursive Micro Zigzag Indicator utilises the Micro Zigzag as the foundation and applies the Recursive Zigzag technique to derive higher-level zigzags. By integrating these techniques, this indicator enables researchers to analyse price patterns at multiple levels and gain a deeper understanding of market behaviour.
🎲 Concept:
Micro Zigzag Base : The indicator utilises the Micro Zigzag concept to capture detailed price movements within each candle. It allows for the visualisation of the sequential price action within the candle, aiding in pattern recognition at a micro level.
Basic implementation of micro zigzag can be found in this link - Micro-Zigzag
Recursive Zigzag Expansion : Building upon the Micro Zigzag base, the indicator applies the Recursive Zigzag concept to derive higher-level zigzags. Through recursive analysis of the Micro Zigzag's pivots, the indicator uncovers intricate patterns and trends that may not be evident in single-level zigzags.
Earlier implementations of recursive zigzag can be found here:
Recursive Zigzag
Recursive Zigzag - Trendoscope
And the libraries
rZigzag
ZigzagMethods
The major differences in this implementation are
Micro Zigzag Base - Earlier implementation made use of standard zigzag as base whereas this implementation uses Micro Zigzag as base
Not cap on Pivot depth - Earlier implementation was limited by the depth of level 0 zigzag. In this implementation, we are trying to build the recursive algorithm progressively so that there is no cap on the depth of level 0 zigzag. But, if we go for higher levels, there is chance of program timing out due to pine limitations.
These algorithms are useful in automatically spotting patterns on the chart including Harmonic Patterns, Chart Patterns, Elliot Waves and many more.

Interactive Motive Wave ChecklistHere is an interactive tool that can be used for learning a bit about Elliott Waves
🎲 How it works?
The script upon load asks users to enter 6 pivots in an order. Once all 6 pivots are selected on the interactive chart, the script will calculate if the structure is a valid motive wave.
When you load the script, you will see a prompt on the chart to select points on the chart to form 6 pivots.
When you select the 6 pivots, the checklists are populated on the chart to notify users which conditions for qualifying the selection has passed and which of them are failed.
🎲 Conditions for Motive Wave
Motive wave can be either Impulse or Diagonal Wave. Diagonal wave can be either expanding or contracting diagonals. To learn more about diagonal waves, please go through this idea.
Rules for generic motive waves are as below
Pivots in order - Checks wether the pivots selected are in progressive order.
Directions in order - Checks if the pivot directions are correct - either PH, PL, PH, PL, PH, PL or PL, PH, PL, PH, PL, PH
Wave 2 never moves beyond the start of wave 1 - Wave 2 retracement is less than 100% of wave1
Wave 3 always moves beyond the end of wave 1 - Wave 3 retracement is more than 100% of wave2
Wave 3 is never the shortest one - Checks if Wave 3 is bigger than either Wave 1 or wave 5 or both.
Now, these are the specific rules for Impulse Waves on top of Motive Wave conditions
Wave 4 never moves beyond the end of Wave 1 - meaning wave 1 and wave 4 never overlap on price scale.
Wave 1, 3, 5 are all not extended. We check for retracement ratios of more than 200% to be considered as extended wave.
Below are the conditions for Diagonal Waves on top of Motive Wave conditions
Wave4 never moves beyond the start of Wave 3 - Wave 4 retracement is less than 100%
Wave 4 always ends within the price territory of Wave 1 - Unlike impulse wave, wave 4 intersects with wave 1 in case of diagonal waves. This is the major difference between impulse and diagonal wave.
Waves are progressively expanding or contracting - Wave1 > Wave3 > Wave5 and Wave2 > Wave4 to be contracting diagonal. Wave1 < Wave3 < Wave5 and Wave2 < Wave4 to be expanding diagonal wave.
Here is an example of diagonal wave projection
Here is an example of impulse wave projection

Master Supertrend [Trendoscope]Are you a fan of supertrend? Me too!! Here is a supertrend indicator which provides multiple variation options to chose from.
🎲 Introduction
Supertrend is a popular technical indicator used by traders to identify potential trend reversals and determine entry and exit points in financial markets. It is a trend-following indicator that combines price and volatility to generate its signals. Generally supertrend is calculated based on ATR and multiplier value which is used for calculation of stops. In these adaptions, we look to provide few variations to classical methods.
🎲 Variations
Following variations are provided in the form of settings.
🎯 Range Type
Instead of ATR, different types of ranges can be used for stop calculation. Here is the complete list used in the script.
Plus/Minus Range - Calculates plus range and minus range for each candle and uses them for different sides of stop calculation
Ladder ATR - Based on the existing concept of Ladder ATR defined in Supertrend-Ladder-ATR
True Range - True range derived from standard function ta.tr
Standard Deviation - Standard deviation of close prices
🎯 Applied Calculation
In standard ATR, rma of TR is used for calculations. But, the application calculation provides option to users to use different mechanisms. It can be a type of moving average or few other types of calculations.
Available values are
sma
ema
hma
rma
wma
high
median
medianHigh (Highest of the last N medians)
medianLow (Lowest of the last N medians)
🎯 Other options
Few other options provided are
Use Close Price - If selected stops are calculated based on the close price instead of high/low prices
Wait for Close If selected, change of supertrend direction is calculated based on close price instead of high/low prices
Diminishing Stop Distance - When selected, stop distance for the trend direction can only reduce and cannot increase. This option is useful for keeping the tight stops on strong trends.
🎯 Plus Minus Range
One of the range type used is Plus/Minus Range. What it means and how are these ranges calculated? Let's have a look.
Plus Range is an upward movement of a candle from its last price or open price whichever is lower.
Minus Range is a downward movement of a candle from its last price or open price whichever is higher.
This divides True Range into two separate range for positive and negative side.
Here are the simple settings in nutshell which reflects the same.
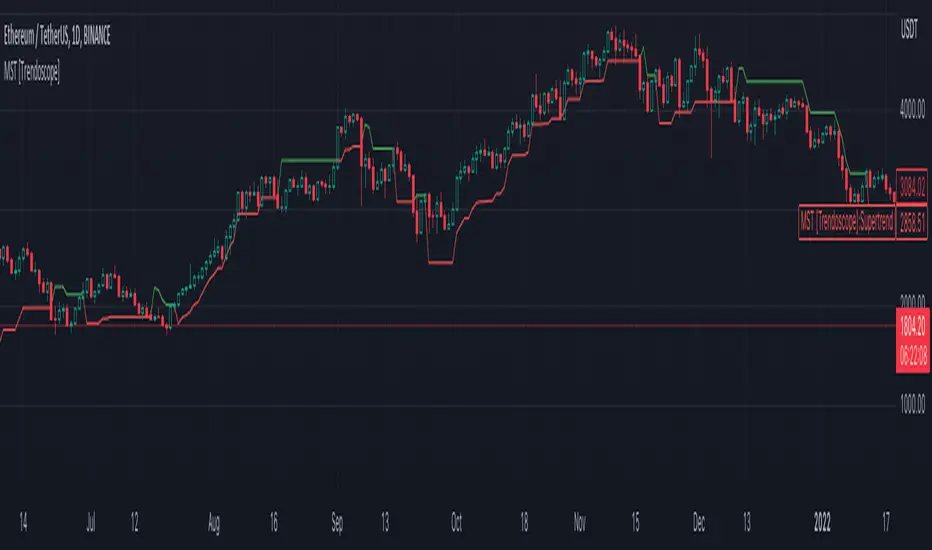
Session Filter [Trendoscope]🎲 Session Filter: A Customisable Trading Indicator for Defining Preferred Trade Sessions
Session Filter is a simple trading indicator that enables traders to define their preferred trading sessions and optimise their approach based on individual preferences. By providing a range of flexible customisation options, Session Filter can help traders reduce risk, increase accuracy, by helping them to adhere to their trading sessions. Features include
🎯 Customisable Trading Sessions
One of the key features of Session Filter is the ability to select from four different trading sessions. These sessions are designed to be flexible, making it easy to tailor your approach to specific markets, assets, and trading styles. By selecting the sessions that are most relevant to your strategy, you can reduce the risk of making trades during less favourable market conditions.
For example, if you prefer to trade during the Asian session, you can set the session times to "Asian Session" in input settings. This will highlight the specific times when the Asian markets are open, allowing you to focus your trading activity during these periods. By doing so, you can avoid trading during times when the market is less active or more volatile.
🎯 Customisable Timezone and Days of the Week:
In addition to customisable trading sessions, Session Filter also allows users to select a timezone and specific days of the week. This ensures that the displayed trading zones and signals are aligned with your local time, and that you can tailor your approach to your preferred schedule. This is particularly useful for traders who have other commitments, or who prefer to focus on specific markets or assets on certain days.
For example, if you are based in New York and prefer to trade during the European session, you can select the "European Session" option in Session Filter and adjust the timezone to reflect your local time. You can also select specific days of the week when you prefer to trade during the European session, such as Tuesday through Thursday. This allows you to optimize your approach based on your personal preferences and schedule.
🎯 Easy Visual Interpretation:
Session Filter uses green and red overlays on the chart to indicate the trading zones, making it easy for users to visually identify their trading sessions
For example, when a green overlay is displayed on the chart, this indicates that the market is within the selected trading session and that it may be a good time to start trade. Conversely, when a red overlay is displayed, this indicates that the market is outside of the selected trading session and that it may be a good time close all trading. By providing this visual feedback, Session Filter helps traders stay focused and disciplined, and avoid making impulsive trading decisions.
🎯Force Exit Signal for Risk Management:
Session Filter also offers the ability to generate a force exit signal when not in any of the selected sessions. This can be used in conjunction with alerts to exit all trades outsize session zone.
For example, if you are using Session Filter to trade during the European session, but the market is particularly volatile during a specific day, the force exit signal will be generated to indicate that it may be a good time to exit your trade. This helps you avoid potential losses and stay disciplined during periods of market turbulence.
🎯External Signal Plots:
In addition to the chart overlays, Session Filter also plots signals on the data window that can be used as external inputs in other indicators and strategies. This feature allows traders to incorporate the signals generated by Session Filter into their existing trading systems and this can be used as additional filters on an existing strategy or methodology.
🎯Alerts using Alert Conditions
Alerts are provided for start and end of session so that users can make use of it to set auto turn on or off their bots.
Settings are pretty simple and are explained here.
