Kubera - ScorecardKubera - Scorecard helps you quickly assess a company’s financial strength and investment potential.
It combines key fundamental metrics — ROCE, ROE, ROIC, Debt-to-Equity, and WACC — to judge profitability, efficiency, and risk, presenting them with intuitive color-coded ratings and a final verdict.
The indicator also includes an RSI band and table for momentum insight, helping you spot fundamentally strong stocks with healthy technical setups.
Ideal for swing traders, investors, and beginners who want to identify quality companies at a glance.
Analisis Fundamental

Purchasing Power vs Gold, Stocks, Real Estate, BTC (1971 = 100)Visual comparison of U.S. dollar purchasing power versus major assets since 1971, when the U.S. ended the gold standard. Each asset is normalized to 100 in 1971, showing how real value has shifted across gold, real estate, stocks, and Bitcoin over time.
Source: FRED (CPIAUCSL, SP500, MSPUS) • OANDA (XAUUSD) • TradingView (INDEX:BTCUSD/BLX)
Visualization by 3xplain

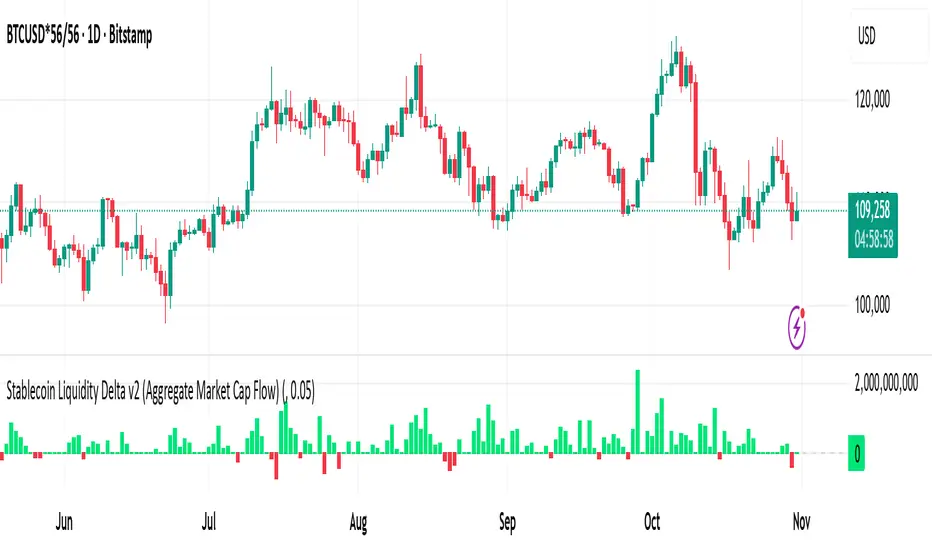
Stablecoin Liquidity Delta v2 (Aggregate Market Cap Flow)Updated version of Stablecoin Liquidity Delta (Aggregate Market Cap Flow).
Hi All,
This indicator visualizes the bar-to-bar change in the aggregate market capitalization of major stablecoins, including USDT, USDC, DAI, and others. It serves as a proxy for monitoring on-chain liquidity and measuring capital inflows or outflows across the crypto market.
Stablecoins are the primary liquidity layer of the crypto economy. Their combined market capitalization acts as a mirror of the available fiat-denominated liquidity in digital markets:
🟩 An increase in the total stablecoin market capitalization indicates new issuance (capital entering the market).
🟥 A decrease reflects redemption or burning (liquidity exiting the system).
Tracking these flows helps anticipate macro-level liquidity trends that often lead overall market direction, providing context for broader price movements.
All values are derived from TradingView’s public CRYPTOCAP tickers, which represent the market capitalization of each stablecoin. While minor deviations can occur due to small price fluctuations around the $1 peg, these figures serve as a proxy for circulating supply and net issuance across the stablecoin ecosystem.
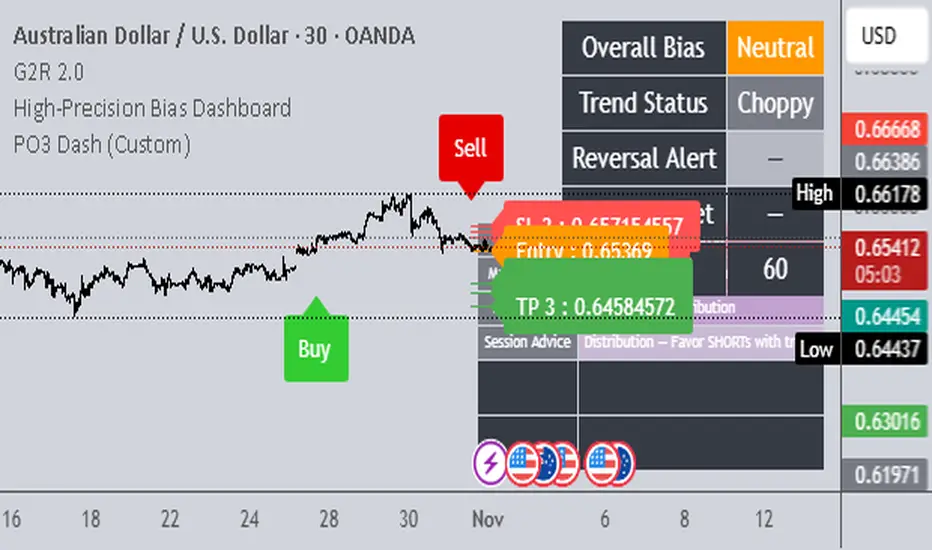
PO3LHGThe PO3 Dash is built for traders who want clear, confident direction — no confusion, no clutter.
It instantly shows you the trend, market phase, and session bias so you always know whether to ride the move or prepare for reversal setups.
I personally use it on the 1H, 45M, and 30M charts to stay in sync with the higher-timeframe trend, and the 15M to catch early flips and reversals before the crowd sees them.
Whether you’re trading London or New York, this dashboard keeps you locked in with structure — helping you follow momentum, time your entries, and avoid getting caught on the wrong side of the market.
🔥 Simple. Precise. Profitable. A clean visual edge for traders who move with purpose.
Stablecoin Liquidity Delta (Aggregate Market Cap Flow)Hi All,
This indicator visualizes the bar-to-bar change in the aggregate market capitalization of major stablecoins, including USDT, USDC, DAI, and others. It serves as a proxy for monitoring on-chain liquidity and measuring capital inflows or outflows across the crypto market.
Stablecoins are the primary liquidity layer of the crypto economy. Their combined market capitalization acts as a mirror of the available fiat-denominated liquidity in digital markets:
🟩 An increase in the total stablecoin market capitalization indicates new issuance (capital entering the market).
🟥 A decrease reflects redemption or burning (liquidity exiting the system).
Tracking these flows helps anticipate macro-level liquidity trends that often lead overall market direction, providing context for broader price movements.
All values are derived from TradingView’s public CRYPTOCAP tickers, which represent the market capitalization of each stablecoin. While minor deviations can occur due to small price fluctuations around the $1 peg, these figures serve as a proxy for circulating supply and net issuance across the stablecoin ecosystem.

US/SPY- Financial Regime Index Swing Strategy Credits: concept inspired by EdgeTools Bloomberg Financial Conditions Index (Proxy)
Improvements: eight component basket, inverse volatility weights, winsorization option( statistical technique used to limit the influence of outliers in a dataset by replacing extreme values with less extreme ones, rather than removing them entirely), slope and price gates, exit guards, table and gradients.
Summary in one paragraph
A macro regime swing strategy for index ETFs, futures, FX majors, and large cap equities on daily calculation with optional lower time execution. It acts only when a composite Financial Conditions proxy plus slope and an optional price filter align. Originality comes from an eight component macro basket with inverse volatility weights and winsorized return z scores that produce a portable yardstick.
Scope and intent
Markets: SPY and peers, ES futures, ACWI, liquid FX majors, BTC, large cap equities.
Timeframes: calculation daily by default, trade on any chart.
Default demo: SPY on Daily.
Purpose: convert broad financial conditions into clear swing bias and exits.
Originality and usefulness
Unique fusion: return z scores for eight liquid proxies with inverse volatility weighting and optional winsorization, then slope and price gates.
Failure mode addressed: false starts in chop and early shorts during easy liquidity.
Testability: all knobs are inputs and the table shows components and weights.
Portable yardstick: z scores center at zero so thresholds transfer across symbols.
Method overview in plain language
Base measures
Return basis: natural log return over a configurable window, standardized to a z score. Winsorization optional to cap extremes.
Components
EQ US and EQ GLB measure equity tone.
CREDIT uses LQD over HYG. Higher credit quality outperformance is risk off so sign is flipped after z score.
RATES2Y uses two year yield, sign flipped.
SLOPE uses ten minus two year yield spread.
USD uses DXY, sign flipped.
VOL uses VIX, sign flipped.
LIQ uses BIL over SPY, sign flipped.
Each component is smoothed by the composite EMA.
Fusion rule
Weighted sum where weights are equal or inverse volatility with exponent gamma, normalized to percent so they sum to one.
Signal rule
Long when composite crosses up the long threshold and its slope is positive and price is above the SMA filter, or when composite is above the configured always long floor.
Short when composite crosses down the short threshold and its slope is negative and price is below the SMA filter.
Long exit on cross down of the long exit line or on a fresh short signal.
Short exit on cross up of the short exit line or on a fresh long signal, or when composite falls below the force short exit guard.
What you will see on the chart
Markers on suggestion bars: L for long, S for short, LX and SX for exits.
Reference lines at zero and soft regime bands at plus one and minus one.
Optional background gradient by regime intensity.
Compact table with component z, weight percent, and composite readout.
Table fields and quick reading guide
Component: EQ US, EQ GLB, CREDIT, RATES2Y, SLOPE, USD, VOL, LIQ.
Z: current standardized value, green for positive risk tone where applicable.
Weight: contribution percent after normalization.
Composite: current index value.
Reading tip: a broadly green Z column with slope positive often precedes better long context.
Inputs with guidance
Setup
Calc timeframe: default Daily. Leave blank to inherit chart.
Lookback: 50 to 1500. Larger length stabilizes regimes and delays turns.
EMA smoothing: 1 to 200. Higher smooths noise and delays signals.
Normalization
Winsorize z at ±3: caps extremes to reduce one off shocks.
Return window for equities: 5 to 260. Shorter reacts faster.
Weighting
Weight lookback: 20 to 520.
Weight mode: Equal or InvVol.
InvVol exponent gamma: 0.1 to 3. Higher compresses noisy components more.
Signals
Trade side: Long Short or Both.
Entry threshold long and short: portable z thresholds.
Exit line long and short: soft exits that give back less.
Slope lookback bars: 1 to 20.
Always long floor bfci ≥ X: macro easy mode keep long.
Force short exit when bfci < Y: macro stress guard.
Confirm
Use price trend filter and Price SMA length.
View
Glow line and Show component table.
Symbols
SPY ACWI HYG LQD VIX DXY US02Y US10Y BIL are defaults and can be changed.
Realism and responsible publication
No performance claims. Past is not future.
Shapes can move intrabar and settle on close.
Execution is on standard candles only.
Honest limitations and failure modes
Major economic releases and illiquid sessions can break assumptions.
Very quiet regimes reduce contrast. Use longer windows or higher thresholds.
Component proxies are ETFs and indexes and cannot match a proprietary FCI exactly.
Strategy notice
Orders are simulated on standard candles. All security calls use lookahead off. Nonstandard chart types are not supported for strategies.
Entries and exits
Long rule: bfci cross above long threshold with positive slope and optional price filter OR bfci above the always long floor.
Short rule: bfci cross below short threshold with negative slope and optional price filter.
Exit rules: long exit on bfci cross below long exit or on a short signal. Short exit on bfci cross above short exit or on a long signal or on force close guard.
Position sizing
Percent of equity by default. Keep target risk per trade low. One percent is a sensible starting point. For this example we used 3% of the total capital
Commisions
We used a 0.05% comission and 5 tick slippage
Legal
Education and research only. Not investment advice. Test in simulation first. Use realistic costs.

Gold THB per Baht (XAU -> Thai baht gold)What it does
This indicator converts international gold prices (XAU) into Thai retail “baht gold” price (THB per 1 baht gold weight) in real time. It multiplies the XAU price (per troy ounce) by USD/THB and converts ounces to Thai baht-weight using the exact gram ratios.
Formula
THB per baht gold = XAU (USD/oz) × USDTHB × (15.244 / 31.1035) × (1 + Adjustment%) + FlatFeeTHB
1 troy ounce = 31.1035 g
1 Thai baht gold = 15.244 g
Conversion factor ≈ 0.490103

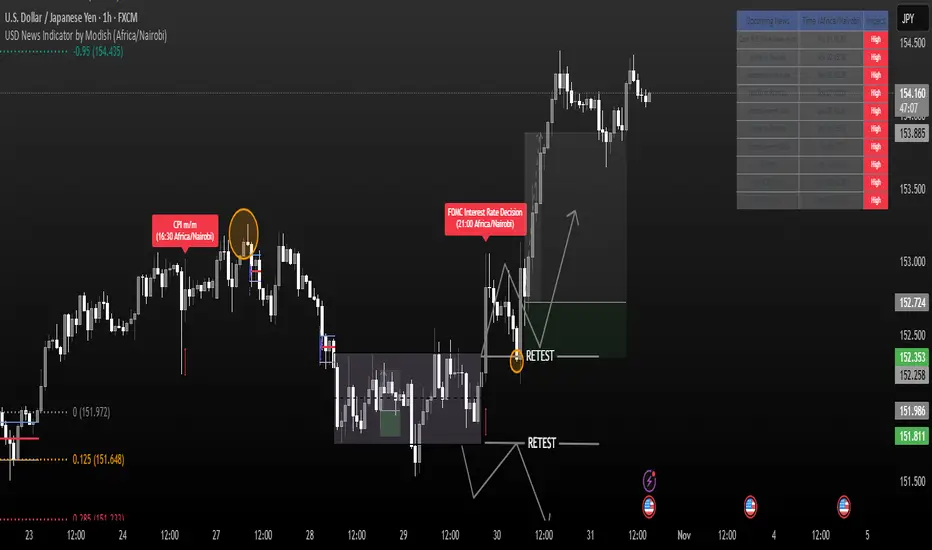
USD News Indicator by ModishThe USD News Indicator overlays arrows and labels on TradingView charts to mark key USD economic releases (e.g., NFP, CPI, PCE, FOMC) from Jan-Oct 2025, with red arrows for high-impact (e.g., CPI, NFP) and orange for medium (e.g., ISM PMI). The main purpose of the indicator is to show the impact of the news in different markets upon release and their movement. Customize via inputs: toggle news types (NFP, CPI, etc.), colors, and timezone display (global options like UTC, New York, Nairobi). A top-right table lists upcoming events with dates/times and impacts, auto-updating weekly based on hardcoded schedules.
EMA 20/50/100/200 Multi-Layer Trend Panel 📘 EMA 20/50/100/200 Multi-Layer Trend Panel
A clean and advanced trend structure analyzer designed to help traders monitor short-, medium-, and long-term market momentum simultaneously.
This indicator combines four key EMAs — 20, 50, 100, and 200 — with visual clouds, dynamic color coding, crossover labels, and a powerful real-time summary panel.
🔍 How It Works
Each EMA line changes color depending on its slope direction
→ Green tone = uptrend, Red tone = downtrend.
Detects and labels important crossovers automatically:
20/50 GC → Short-term bullish shift (Golden Cross).
50/200 GC → Long-term strong bullish breakout.
DC labels indicate Death Cross or bearish reversals.
Cloud zones between EMAs visualize the interaction between short- and long-term trends.
A compact top-right panel displays each EMA’s current value, slope direction, and overall trend alignment status (BULL / BEAR / MIXED).
⚙️ Advantages
✅ Tracks trend structure on multiple layers (short → medium → long).
✅ Highlights momentum shifts using dynamic EMA slope coloring.
✅ Provides early visual warnings of trend reversals (GC/DC).
✅ Clean, minimal panel offers an instant multi-EMA overview.
✅ Compatible with multi-timeframe (MTF) analysis — view higher-TF EMAs within lower charts.
✅ Optional bar and background coloring makes trend zones easy to interpret.
💡 Pro Tips
On higher timeframes (1D / 4H), the 50/200 cross defines the macro market direction.
On lower timeframes (5m – 15m), the 20/50 cross helps refine entry timing.
When the panel shows
→ Aligned BULL (20>50>100>200) → Strong trending condition.
→ Mixed → Ranging or transition phase.
Combine with volume or RSI for confluence in entry/exit decisions.
🧭 Purpose
This indicator aims to simplify complex market structure into an elegant, color-coded system — allowing traders to stay aligned with the dominant trend while spotting early reversals across multiple time horizons.
🧩 Ideal For
Swing & position traders confirming long-term bias.
Intraday traders aligning entries with higher-TF EMAs.
Strategy developers seeking multi-EMA trend filters.
Anyone who wants a clean, informative, and unobtrusive visual trend dashboard.
⚠️ Notes
The script supports optional MTF (multi-timeframe) mode — use carefully, as MTF data may repaint during incomplete bars.
No trading system is perfect; always combine with your personal strategy and proper risk management.

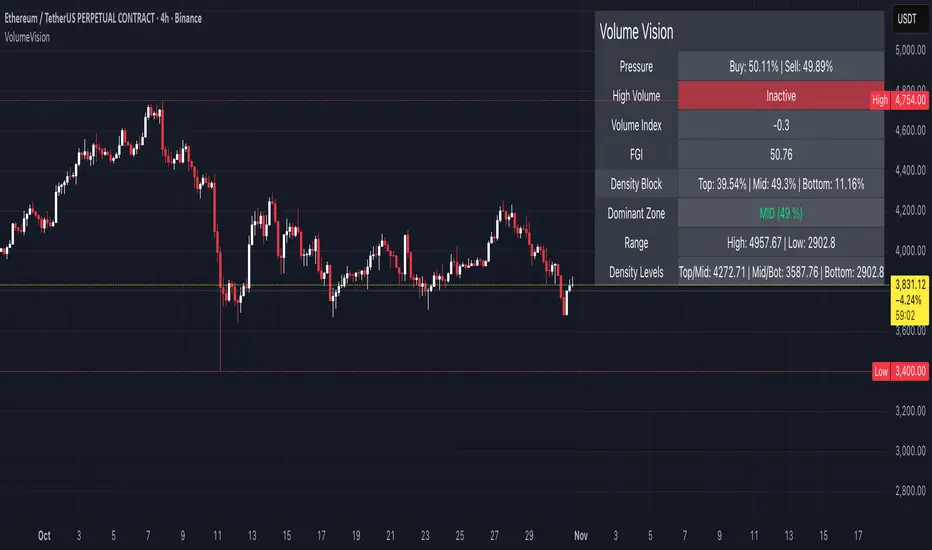
Volume VisionVolume Vision is a precision volume-analysis system that exposes how trading activity is distributed inside the current market range.
It divides the active price structure into three live zones — Top, Middle, and Bottom — and measures where real participation is concentrated.
This creates a dynamic “volume map” that allows you to instantly see whether the market is being driven by accumulation, distribution, or equilibrium.
At the heart of the indicator is a fully original implementation of the FGI — a proprietary composite metric designed to read market emotion and internal pressure.
It transforms several hidden components — volume, volatility, dominance, and directional momentum — into one unified curve of sentiment.
FGI values around 30 typically reflect phases of fear, capitulation, and potential accumulation.
Values near 80 mark conditions of greed, overextension, and possible distribution.
Observing these boundaries helps detect when the market is preparing to shift from compression to expansion or from euphoria to cooling.
Core Functions
Density Zones: Splits recent price movement into Top / Mid / Bottom areas, quantifying volume within each.
Dominant Zone: Highlights where the major share of liquidity currently resides.
Pressure Meter: Shows the balance between buy and sell volume in real time.
Volume Index: Normalizes present volume activity against its historical range to spot abnormal behaviour.
FGI Reading: Custom sentiment curve ranging from fear (≈ 30) to greed (≈ 80).
Alerts: Optional signals for High Volume and Rising Volume moments.
Dashboard: Compact on-chart table that summarizes all key readings without cluttering the view.
Interpretation Guide
When FGI drops near 30, the market often forms accumulation bases or bottom structures.
When FGI climbs toward 80, momentum usually reaches its limit and profit-taking or distribution begins.
A dominant Top zone with strong sell pressure indicates distribution, while Bottom dominance with buy pressure suggests accumulation.
Mid-zone dominance with neutral FGI reflects balance — a state of indecision before the next move.
Watch for volume spikes accompanied by FGI shifts: these often precede major impulse starts or ends.
Style: non-repainting core, minimal visuals, real-time clarity.
Created for traders who need to see where the energy is flowing, not just what price is printing.
by MahaTrend
Simple FloatFloat Display Indicator
A simple, clean indicator that displays the current float (shares outstanding float) for any stock directly in your indicator status line at the top left of the chart.
Features:
- Shows the float value with automatic K/M formatting for thousands and millions
- No chart clutter - value only appears in the status line, nothing plotted on the chart
- Works on any stock that has float data available
- Lightweight and efficient
Perfect for traders who want quick access to float information without switching between windows or cluttering their charts.
Note: Float data availability depends on TradingView's financial data for the specific ticker. Some tickers may not have this data available.

Indicador Multi-Estrategia - ComunidadMulti-indicator designed for use by TradingView users with a free account. The intention is to support users who are just starting out in the world of crypto trading.

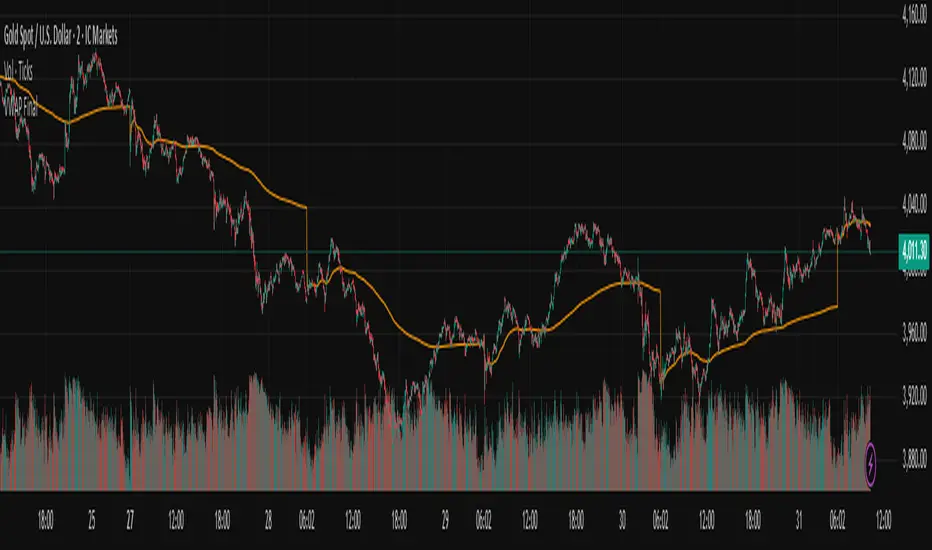
Vwap Daily By SamsungTitle
Daily VWAP with Historical Lookback (Logic Fix)
Description
This script calculates and plots the daily Volume-Weighted Average Price (VWAP), an essential tool for intraday traders.
What makes this indicator special is its robust plotting logic. Unlike many simple VWAP scripts that struggle to show data for previous days, this version includes a crucial fix that allows you to reliably display historical VWAP lines for as many days back as you need. This allows for more comprehensive backtesting and analysis of how price has interacted with the VWAP on previous trading days.
This is an indispensable tool for traders who use VWAP as a dynamic level of support/resistance, a benchmark for trade execution quality, or a gauge of the day's trend.
Key Features
Historical VWAP Display: Easily plot VWAP for multiple past days on your chart. Simply set the number of lookback days in the settings.
Accurate Daily Calculation: The VWAP calculation correctly resets at the beginning of each new trading session (00:00 server time).
Fully Customizable: You have full control over the appearance of the VWAP line, including its color, width, and style (Solid or Stepped).
Robust Plotting Engine: This script solves the common Pine Script issue where conditionally plotted historical lines fail to render. It works reliably on all intraday timeframes.
Built-in Debug Mode: For advanced users or those curious about the inner workings, a comprehensive debug mode can be enabled to display raw VWAP values, cumulative volume, and timeframe warnings.
How to Use
Add the "Daily VWAP with Historical Lookback" indicator to your chart.
IMPORTANT: Make sure you are on an intraday timeframe (e.g., 1H, 30M, 15M, 5M, 1M). This indicator is designed for intraday analysis and will display a warning if used on a daily or higher timeframe.
Open the indicator's settings.
In the "VWAP Settings" tab, adjust the "Lookback Days to Display" to set how many previous days of VWAP you want to see. (e.g., 0 for today only, 1 for today and yesterday, 10 for the last 10 days).
Customize the line's appearance in the "Line Style" tab.
The "Logic Fix" Explained (For Developers)
A common challenge in Pine Script is conditionally plotting data for historical bars. Many scripts attempt this by dynamically changing the plot color to na (transparent) for bars that shouldn't be displayed. This method is often unreliable and can result in the entire plot failing to render.
This script employs a more robust and standard approach: manipulating the data series itself.
The Problem: plot(vwap, color = shouldPlot ? color.red : na) can be buggy.
The Solution: plot(shouldPlot ? vwap : na, color = color.red) is reliable.
Instead of changing the color, we create a new data series (plotVwap). This series contains the vwapValue only on the bars that meet our date criteria. On all other bars, its value is na (Not a Number). The plot() function is designed to handle na values by simply "lifting the pen," creating a clean break in the line. This ensures that the VWAP is drawn only for the selected days, with 100% reliability across all historical data.
Settings Explained
Lookback Days to Display: Sets the number of past days (from the last visible bar) for which to display the VWAP.
Line Color, Width, and Style: Standard cosmetic settings for the VWAP line.
Enable Debug Mode (Master Switch): Toggles all debugging features on or off. It is enabled by default to help new users.
Display Debug: Cumulative Volume: When enabled, it shows the daily cumulative volume in a gray area on a separate pane.
Display Debug: Raw VWAP Value: When enabled, it plots the raw, unfiltered VWAP calculation for all days on the chart, helping to verify the core logic.
This script is provided for educational and informational purposes. Trading involves significant risk. Always conduct your own research and analysis before making any trading decisions.
If you find this script useful, a 'Like' is always appreciated! Happy trading
negative/possitive day counterSimple script to find how many days were in profit and loss to get the probability edge. only for fundamental analysis
GL

Squeeze Momentum ProSQUEEZE MOMENTUM PRO - Enhanced Visual Dashboard
A modernized version of the TTM Squeeze Momentum indicator, designed for cleaner visual interpretation and faster decision-making.
═══════════════════════════════════════════
📊 WHAT IS THE SQUEEZE?
═══════════════════════════════════════════
The "squeeze" occurs when Bollinger Bands contract inside Keltner Channels, indicating extremely low volatility. This compression typically precedes explosive directional moves - the tighter the squeeze, the bigger the potential breakout.
John Carter's TTM Squeeze concept (from "Mastering the Trade") combines this volatility compression with momentum direction to identify high-probability setups.
═══════════════════════════════════════════
✨ WHAT'S NEW IN THIS VERSION
═══════════════════════════════════════════
🎯 VISUAL STATUS BAR
- Real-time squeeze state with clear labels
- Color-coded backgrounds (Red = Building, Green = Fired Bullish, Orange = Fired Bearish)
- Squeeze duration counter to gauge compression time
📊 ENHANCED HISTOGRAM
- 4-color momentum gradient (Strong Bull/Weak Bull/Weak Bear/Strong Bear)
- Instantly shows both direction AND strength
- Background shading for current market state
🔥 SQUEEZE INTENSITY GAUGE
- 5-dot pressure indicator showing compression tightness
- Percentage display of squeeze strength
- Only appears during active squeezes
📈 REAL-TIME METRICS PANEL
- Current momentum value
- Direction indicator (increasing/decreasing)
- Strength assessment (strong/weak)
🔔 COMPREHENSIVE ALERTS
- Squeeze started
- Squeeze fired (bullish/bearish)
- Momentum crossovers
═══════════════════════════════════════════
🎮 HOW TO USE
═══════════════════════════════════════════
1. WAIT FOR SQUEEZE
• Red status bar appears
• Intensity dots show compression level
• Longer duration = potentially bigger move
2. WATCH FOR RELEASE
• Status changes to "FIRED - BULLISH" or "FIRED - BEARISH"
• Histogram color confirms momentum direction
• Background highlights the event
3. MANAGE POSITION
• Monitor momentum strength in metrics panel
• Exit when histogram changes color (momentum reversal)
• Use with trend/volume confirmation
═══════════════════════════════════════════
⚙️ CUSTOMIZATION
═══════════════════════════════════════════
- Toggle status bar, metrics, intensity dots independently
- Adjustable BB/KC parameters
- Custom color schemes
- Show/hide squeeze duration
═══════════════════════════════════════════
🙏 CREDITS
═══════════════════════════════════════════
Original TTM Squeeze concept: John F. Carter
Original indicator code: LazyBear (@LazyBear)
This builds on LazyBear's excellent implementation of the TTM Squeeze Momentum indicator, adding modern visual elements and real-time dashboards for improved usability.
Original indicator: "Squeeze Momentum Indicator "
═══════════════════════════════════════════
⚠️ DISCLAIMER
═══════════════════════════════════════════
This indicator is for educational purposes. Always use proper risk management and combine with other forms of analysis. No indicator guarantees profitable trades.
═══════════════════════════════════════════
Best used on: Day trading timeframes (1m-15m) for momentum plays
Combine with: Volume analysis, trend filters, support/resistance levels

Automated Z-scoring - [JTCAPITAL]Automated Z-Scoring - is a modified way to use statistical normalization through Z-Scores for analyzing price deviations, volatility extremes, and mean reversion opportunities in financial markets.
The indicator works by calculating in the following steps:
Source Selection
The indicator begins by selecting a user-defined price source (default is the Close price). Traders can modify this to use any indicator that is deployed on the chart, for accurate and fast Z-scoring.
Mean Calculation
A Simple Moving Average (SMA) is calculated over the selected length period (default 3000). This represents the long-term equilibrium price level or the “statistical mean” of the dataset. It provides the baseline around which all price deviations are measured.
Standard Deviation Measurement
The script computes the Standard Deviation of the price series over the same period. This value quantifies how far current prices tend to stray from the mean — effectively measuring market volatility. The larger the standard deviation, the more volatile the market environment.
Z-Score Normalization
The Z-Score is calculated as:
(Current Price − Mean) ÷ Standard Deviation .
This normalization expresses how many standard deviations the current price is away from its long-term average. A Z-Score above 0 means the price is above average, while a negative score indicates it is below average.
Visual Representation
The Z-Score is plotted dynamically, with color-coding for clarity:
Bullish readings (Z > 0) are showing positive deviation from the mean.
Bearish readings (Z < 0) are showing negative deviation from the mean.
Make sure to select the correct source for what you exactly want to Z-score.
Buy and Sell Conditions:
While the indicator itself is designed as a statistical framework rather than a direct buy/sell signal generator, traders can derive actionable strategies from its behavior:
Trend Following: When the Z-Score crosses above zero after a prolonged negative period, it suggests a return to or above the mean — a possible bullish reversal or trend continuation signal.
Mean Reversion: When the Z-score is below for example -1.5 it indicates a good time for a DCA buying opportunity.
Trend Following: When the Z-Score crosses below zero after being positive, it may indicate a momentum slowdown or bearish shift.
Mean Reversion: When the Z-score is above for example 1.5 it indicates a good time for a DCA sell opportunity
Features and Parameters:
Length – Defines the period for both SMA and Standard Deviation. A longer length smooths the Z-Score and captures broader market context, while a shorter length increases responsiveness.
Source – Allows the user to choose which price data is analyzed (Close, Open, High, Low, etc.).
Fill Visualization – Highlights the magnitude of deviation between the Z-Score and the zero baseline, enhancing readability of volatility extremes.
Specifications:
Mean (Simple Moving Average)
The SMA calculates the average of the selected source over the defined length. It provides a central value to which the price tends to revert. In this indicator, the mean acts as the equilibrium point — the “zero” reference for all deviations.
Standard Deviation
Standard Deviation measures the dispersion of data points from their mean. In trading, it quantifies volatility. A high standard deviation indicates that prices are spread out (volatile), while a low value means they are clustered near the average (stable). The indicator uses this to scale deviations consistently across different market conditions.
Z-Score
The Z-Score converts raw price data into a standardized value measured in units of standard deviation.
A Z-Score of 0 = Price equals its mean.
A Z-Score of +1 = Price is one standard deviation above the mean.
A Z-Score of −1 = Price is one standard deviation below the mean.
This allows comparison of deviation magnitudes across instruments or timeframes, independent of price level.
Length Parameter
A long lookback period (e.g., 3000 bars) smooths temporary volatility and reveals long-term mean deviations — ideal for macro trend identification. Shorter lengths (e.g., 100–500) capture quicker oscillations and are useful for short-term mean reversion trades.
Statistical Interpretation
From a probabilistic perspective, if the distribution of prices is roughly normal:
About 68% of price observations lie within ±1 standard deviation (Z between −1 and +1).
About 95% lie within ±2 standard deviations.
Therefore, when the Z-Score moves beyond ±2, it statistically represents a rare event — often corresponding to price extremes or potential reversal zones.
Practical Benefit of Z-Scoring in Trading
Z-Scoring transforms raw price into a normalized volatility-adjusted metric. This allows traders to:
Compare instruments on a common statistical scale.
Identify mean-reversion setups more objectively.
Spot volatility expansions or contractions early.
Detect when price action significantly diverges from long-term equilibrium.
By automating this process, Automated Z-Scoring - provides traders with a powerful analytical lens to measure how “stretched” the market truly is — turning abstract statistics into a visually intuitive and actionable form.
Enjoy!

Pullback Levels from ATH# ATH Pullback Levels
**Assess correction depth with precision – 5%, 10%, 15%, 20% below All-Time High**
---
### Overview
This indicator draws **horizontal support lines** at **5%, 10%, 15%, and 20%** below the **All-Time High (ATH)** of any asset. Perfect for **swing traders**, **long-term investors**, and **bull market participants** who want to:
- Measure **pullback depth** in real-time
- Identify **potential support zones**
- Set **alerts** when price enters key retracement levels
---
### Features
| Feature | Description |
|--------|-------------|
| **Dynamic ATH Tracking** | Automatically updates with every new high |
| **4 Pullback Levels** | 5%, 10%, 15%, 20% below ATH |
| **Live Pullback % Label** | Shows current % drop from ATH (top-right) |
| **Customizable Lines** | Toggle visibility, change colors & styles |
| **Built-in Alerts** | Trigger on entry into each zone |
| **No Errors** | Works on 50k+ bar charts (BTC, SPX, etc.) |
| **Time-Based Lines** | Uses `xloc.bar_time` – no 500-bar future limit |
---
### How to Use
1. Apply to any chart (stocks, crypto, forex, indices)
2. Watch the **info box** for current pullback %
3. Use lines as **potential buy zones** during corrections
4. Set **alerts** to be notified when price enters a level
> Example: If ATH = $100 →
> - 5% = $95
> - 10% = $90
> - 15% = $85
> - 20% = $80
---
### Inputs
- **Show 5% / 10% / 15% / 20% Level** → Toggle on/off
- **Line Colors** → Fully customizable
- **Line Style** → Solid, Dashed, or Dotted
---
### Alerts
Create alerts directly from the indicator:
- `"Entered 5% Pullback"`
- `"Entered 10% Pullback"`
- etc.
---
### Best For
- Bull market corrections
- Long-term position sizing
- Risk management in uptrends
- Swing entries on dips
---
### Notes
- Works on **all timeframes**
- **Log scale compatible** (lines adjust correctly)
- No repainting – ATH only updates on confirmed highs
---
**Built with Pine Script v6 – Clean, fast, reliable.**
*Happy trading!*

FVG MagicFVG Magic — Fair Value Gaps with Smart Mitigation, Inversion & Auto-Clean-up
FVG Magic finds every tradable Fair Value Gap (FVG), shows who powered it, and then manages each gap intelligently as price interacts with it—so your chart stays actionable and clean.
Attribution
This tool is inspired by the idea popularized in “Volumatic Fair Value Gaps ” by BigBeluga (licensed CC BY-NC-SA 4.0). Credit to BigBeluga for advancing FVG visualization in the community.
Important: This is a from-scratch implementation—no code was copied from the original. I expanded the concept substantially with a different detection stack, a gap state machine (ACTIVE → 50% SQ → MITIGATED → INVERSED), auto-clean up rules, lookback/nearest-per-side pruning, zoom-proof volume meters, and timeframe auto-tuning for 15m/H1/H4.
What makes this version more accurate
Full-coverage detection (no “missed” gaps)
Default ICT-minimal rule (Bullish: low > high , Bearish: high < low ) catches all valid 3-candle FVGs.
Optional Strict filter (stricter structure checks) for traders who prefer only “clean” gaps.
Optional size percentile filter—off by default so nothing is hidden unless you choose to filter.
Correct handling of confirmations (wick vs close)
Mitigation Source is user-selectable: high/low (wick-based) or close (strict).
This avoids false “misses” when you expect wick confirmations (50% or full fill) but your logic required closes.
State-aware labelling to prevent misleading data
The Bull%/Bear% meter is shown only while a gap is ACTIVE.
As soon as a gap is 50% SQ, MITIGATED, or INVERSED, the meter is hidden and replaced with a clear tag—so you never read stale participation stats.
Robust zoom behaviour
The meter uses a fixed bar-width (not pixels), so it stays proportional and readable at any zoom level.
Deterministic lifecycle (no stale boxes)
Remove on 50% SQ (instant or delayed).
Inversion window after first entry: if price enters but doesn’t invert within N bars, the box auto-removes once fully filled.
Inversion clean up: after a confirmed flip, keep for N bars (context) then delete (or 0 = immediate).
Result: charts auto-maintain themselves and never “lie” about relevance.
Clarity near current price
Nearest-per-side (keep N closest bullish & bearish gaps by distance to the midpoint) focuses attention where it matters without altering detection accuracy.
Lookback (bars) ensures reproducible behaviour across accounts with different data history.
Timeframe-aware defaults
Sensible auto-tuning for 15m / H1 / H4 (right-extension length, meter width, inversion windows, clean up bars) to reduce setup friction and improve consistency.
What it does (under the hood)
Detects FVGs using ICT-minimal (default) or a stricter rule.
Samples volume from a 10× lower timeframe to split participation into Bull % / Bear % (sum = 100%).
Manages each gap through a state machine:
ACTIVE → 50% SQ (midline) → MITIGATED (full) → INVERSED (SR flip after fill).
Auto-clean up keeps only relevant levels, per your rules.
Dashboard (top-right) displays counts by side and the active state tags.
How to use it
First run (show everything)
Use Strict FVG Filter: OFF
Enable Size Filter (percentile): OFF
Mitigation Source: high/low (wick-based) or close (stricter), as you prefer.
Remove on 50% SQ: ON, Delay: 0
Read the context
While ACTIVE, use the Bull%/Bear% meter to gauge demand/supply behind the impulse that created the gap.
Confluence with your HTF structure, sessions, VWAP, OB/FVG, RSI/MACD, etc.
Trade interactions
50% SQ: often the highest-quality interaction; if removal is ON, the box clears = “job done.”
Full mitigation then rejection through the other side → tag changes to INVERSED (acts like SR). Keep for N bars, then auto-remove.
Keep the chart tidy (optional)
If too busy, enable Size Filter or set Nearest per side to 2–4.
Use Lookback (bars) to make behaviour consistent across symbols and histories.
Inputs (key ones)
Use Strict FVG Filter: OFF(default)/ON
Enable Size Filter (percentile): OFF(default)/ON + threshold
Mitigation Source: high/low or close
Remove on 50% SQ + Delay
Inversion window after entry (bars)
Remove inversed after (bars)
Lookback (bars), Nearest per side (N)
Right Extension Bars, Max FVGs, Meter width (bars)
Colours: Bullish, Bearish, Inversed fill
Suggested defaults (per TF)
15m: Extension 50, Max 12, Inversion window 8, Clean up 8, Meter width 20
H1: Extension 25, Max 10, Inversion window 6, Clean up 6, Meter width 15
H4: Extension 15, Max 8, Inversion window 5, Clean up 5, Meter width 10
Notes & edge cases
If a wick hits 50% or the far edge but state doesn’t change, you’re likely on close mode—switch to high/low for wick-based behaviour.
If a gap disappears, it likely met a clean up condition (50% removal, inversion window, inversion clean up, nearest-per-side, lookback, or max-cap).
Meters are hidden after ACTIVE to avoid stale percentages.


EV/FCFThis script in the 6 version of Pine brings you the most accurate multiple of "fundamental valuation" in my opinion. EV/FCF gives you a real metric of how profitable is the company in this exact moment and also if the company is overvaluated or undervaluated.

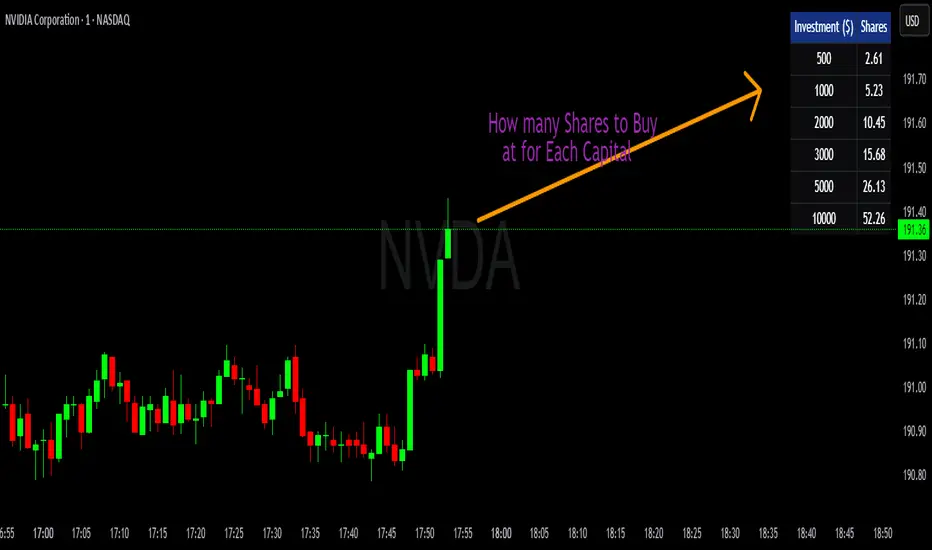
💰 Position Size Table Compact Quickly see how many shares you can buy for preset investment amounts at the current price. This compact, customizable table is perfect for traders who want to calculate position sizes instantly without manual math.
Features
- Pre-set investment amounts: $500, $1000, $2000, $3000, $5000, $10000
- Per-row toggle: Show or hide specific investment amounts
- Live updates: Table recalculates as the stock price changes
- Customizable colors: Background, header, text, and border
- Master toggle: Hide or show the entire table on demand
Use it to
- Quickly calculate position sizes for multiple investment levels
- Plan trades efficiently and reduce manual calculation errors
- Keep your chart clean with a compact, flexible table
Quantum Portfolio vs S&P 500 (Base: May 2, 2021)This script compares the performance of a custom Quantum Portfolio — a weighted basket of quantum computing, semiconductor, and cybersecurity stocks — against the S&P 500 Index, with both series rebased to 100 on May 2 2021.
It provides a clear, normalized view of cumulative returns, allowing you to visualize portfolio outperformance or underperformance relative to the broader market benchmark.

Quantum Portfolio vs NASDAQ (Base: May 2, 2021)This custom Pine Script indicator tracks and compares the cumulative performance of a multi-asset “Quantum Portfolio” against the NASDAQ 100 benchmark, rebased to a common starting point on May 2, 2021.
Both series are normalized to a base value of 100 on that date, allowing direct visual comparison of percentage growth or decline over time.
