Auto Fibonacci Levels and DMA WMA Resistances by Ahmad DukhanHi,
This indicator will give you from -100% to 300% of the Fibonacci levels that is carefully calculated that doesn't change with frame change and is very reliable regardless which symbol you are trading (Ask for screenshot proof for symbol you trade)
Also included with
- Fibonacci Levels
Daily S/R
- 20 DMA
- 50 DMA
- 100 DMA
- 200 DMA
Weekly S/R
- 20 WMA
- 50 WMA
- 100 WMA
- 200 WMA
With options to toggle/enable/disable any of the above
For more details on how to get this indicator DM me
Thanks
Fibonacci

Fibonacci + RSI - StrategyStrategy: Fibonacci + RSI:
- Intraday trading strategy (Scalping).
Time Frames Tested with best Results:
30 Minutes.
5 Minutes.
15 Minutes.
1 Minute
Indicators Used:
RSI (30 / 70)
Fibonacci (1 - 0.784)
How it Works:
Once the Price Hits the 1 or -1 Fibonacci Level and bounces a little bit, It checks the RSI if Over Bought or Over Sold According to 30 - 70.
If both conditions are satisfied, it triggers a Long or Short Positions.
Further Notes:
- I have put a Stop-loss with a 2% just for further upgrades.
- Not advised to use in High Volatility Markets.
- No Repaint was observed during a 2-Weeks Tests.
If you have any suggestions or modifications please contact to add.
If you have observed any bad behavior please contact to fix.
Trade wisely.

Freedom FibThis script will allow to automatically draw levels on the chart for a potential pullback play like shown in this snapshot here
It will draw risk/reward levels upon your favorite ema (default is 13ema) as the price goes and it will work for both long or short scenarios for a potential trend continuation play.
You got the option to align your level to match exactly your selected ema or to be placed in between the first two levels (default settings) if you prefer.
I personally use this one settings for shorter time frames (up to 3min) and the aligned one for higher time frames.

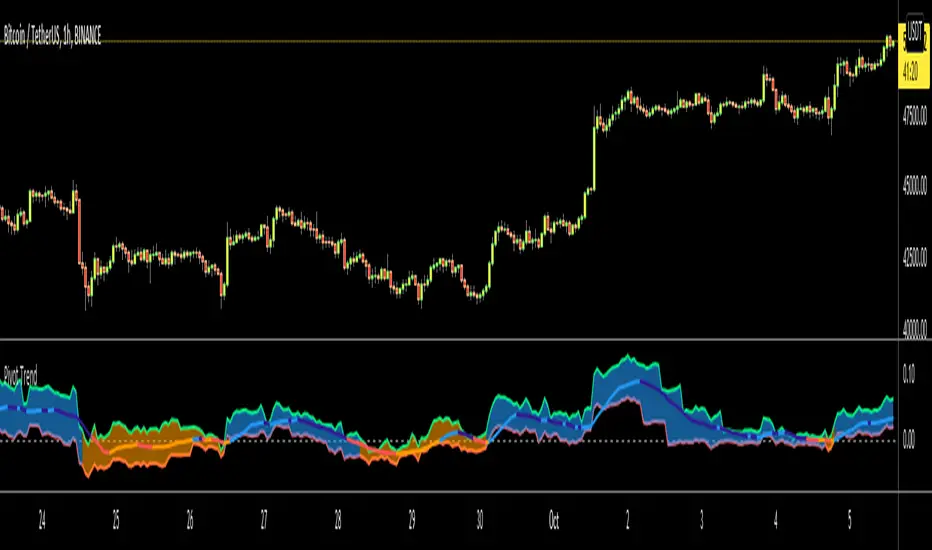
Pivot TrendHello Traders,
Another original idea is here with you. Actualy I can say that it's a breakout strategy that uses multiple Pivot Point's averages.
How it works?
- it finds the Pivot Points, you can set the length as you want
- it gets averages of Pivot Highs and Pivot Lows, you can set the number of Pivot Points to be included
- it compares the current closing price with averages of Pivot Highs and Pivot Lows
- if both are positive or negative then trend changes
You have two options:
- Pivot Point Period => is the length that is used to find Pivot Points. means it checks left/right bars if it's Pivot Point (4 by default)
- Number of PP to check => is the number of Pivot Points that the script finds and calculates the averages (3 by default)
An Example with the settings Pivot Point Period = 5 and Number of PP to check = 2
Play with settings as you wish. Comments are welcome, together we can improve it ;)
Enjoy!
Auto FibonacciA series of Fibonacci sequences using a variety of triggers to base highs and lows off.
High and low look back length can be altered, fibs and fib extensions can be shown or hidden and the background can be filled or transparent.
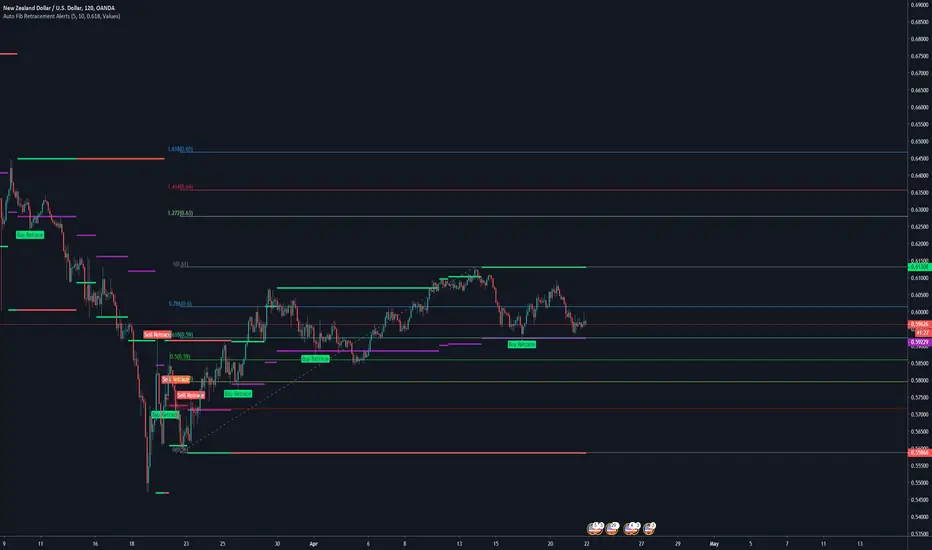
Auto Fib Retracement AlertsFor the fibonacci traders.
The Auto Fib Retracement Is a good indicator for tradingview to show you the current alerts and points to watch in the market
IMPORTANT SETTING => Retracement
This controls your alert levels
I have modified it to deliver the following
+Custom Fib retracement level alerts
+Drawing of old levels and retracement levels
+Backtesting Old Alerts
There are two shapes drawn on the chart;
Shown When the fib end is attained and market retraces back to your level
1. Buy retracement -
2. Sell retracement
How are they detected?
When we have new levels in the market; this is when the red or gree line changes, we calculate the new fib level that we will be watching for retracement
This is the purple level drawn on the chart
When the market first crosses below or above this level, The alert will be fired.
Consequent crosses are not updated
Enjoy! 😍
Originally requested by trade atechproduction
Donchian Channels with Auto Fibonacci RetracementRichard Donchian created Donchian Channels, which is a type of moving average indicator and a look-alike of other support and resistance trading indicators like Bollinger Bands.
Donchian Channels has a simple plotting of highest high and lowest low of the last “n” periods.
The “n” periods is based on the trader’s choice, who can select the period according to their requirements ranging from a day, hour and minutes etc.
Traders use Donchian Channels to understand the support and resistance levels.
Donchian Channels is a popular indicator for determining volatility in market prices.
The channels are wider when there are heavy price fluctuations and narrow when prices are relatively flat.
Generally, investors use 20-periods with the Donchian Channels as the default trading setting, but this value can be tweaked based on your trading style.
Donchian channels are mainly used to identify the breakout of a stock or any traded entity enabling traders to take either long or short positions.
Traders can take a long position, if the stock is trading higher than the Donchian channels “n” period and book their profits/short the stock if it is trading below the DC channels “n” period.
The middle band is the average of the upper and lower bands.
The middle band in Donchian channels could also be used as a breakout indicator.
If the stock rises above the middle band of the Donchian channels, then you can open a long position.
On the contrary, if the stock is trading below the middle band of the Donchian channel, then a trader can open a short position.
Combining Donchian Channel trading strategies with other trading strategies might decrease the false entry/exit signals and give a clearer picture of trading opportunities.
If you start to trade a choppy market on an intraday basis, you will be overloaded with false signals.
So, what I noticed is that in order for things to become clearer, we just need to increase the time frame.
Where Donchian Channels Can Fail You
It’s likely not the indicator but more likely our misinterpretation of the signals.
Few areas where the Donchian channel may be tough to read.
Low float stocks are not bound by any indicator, especially Donchian channels.
The challenge with the Donchian channels is that it does not factor in the most recent market volatility.
The indicators provide an equal weighting to all data points.
Therefore when a low float stock picks up and goes on a run, the lower bounds not capture the price movements quickly enough, thus risking giving back more profits than necessary.

EMA / Fibonacci / Bollinger Indicator for Market Sniper SuiteHello all,
this script was created to be used in conjunction with Market Sniper - Trading/Scalping Suite . It was put together to make instrument analysis faster and less convoluted.
It includes
9 Fibonacci Exponential moving averages + 2 Simple moving averages
Auto Fibonacci levels - Tradingviews Auto Fib Retracement - with some modifications
Bollinger Bands - To faster spot squeeze momentum

Auto Fibonacci Fan with 5 adjustable levels.This indicator is able draw the Fibonacci Fan automatically on chart based on the input range of bars.
The lines of a Fibonacci fan used Fibonacci ratios determined by the Fibonacci series, typically 23.6 percent, 38.2 percent, 50 percent, 61.8 percent and 80.9 percent. They can be used to estimate support and resistance levels.
Fibonacci fan is a practical technique that uses Fibonacci ratios to draw out levels of support and resistance, see chart as an example.
The fibo fan extension lines can be either upwards (rising Fibonacci Fan) or downwards (Falling Fibonacci Fan), and the lines are drawn using Fibonacci ratios, typically 23.6%, 38.2%, 50%, 61.8% and 80.9%.
Features and inputs:
Range, it's the number of bars used to detect the highest and lowest price. The default value is 150 it means the indicator will plot the Fibonacci Fan based on the price range of last 150 bars.
If you want to use different ratios other than the default ones, you can change them from input Level1 to Level5.
You can change the color of each level line, from bottom to top.
The highest and lowest level are auto detected and update in realtime.
Please purchase it from our website or contact us for more info.

Auto Fibonacci Indicator for All Types of Charts/TickersHi,
Pine Version: 4
I have created an indicator that will draw automagically all fibonacci level for any given Chart/Ticker or Frame. This works for anything below Monthly frame as bigger frames calculation algorithms are still in the lab.
For access contact me on private
Thanks

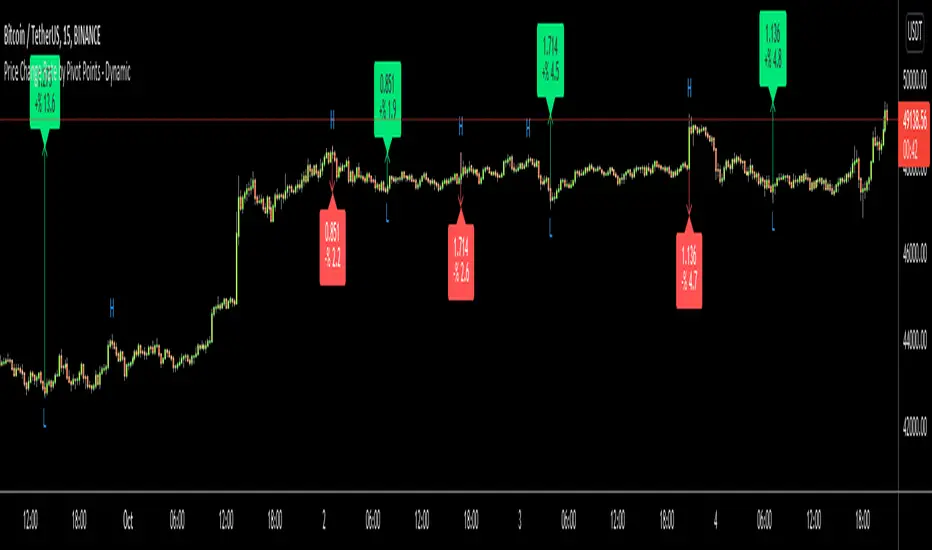
Price Change Rate by Pivot Points - DynamicHi Everyone
Usually I need Price Change info and I believe most of you need this info too. I want to see how it increased/decreased. I automate this by using Pivot Points.
it works dynamically and it uses Pivot Highs and Pivot Lows accordingly. That means it calculates which one to use.
Please watch following video:
Enjoy!
Fibonacci Retracament Levels - Only for intraday.Fibonacci Retracament Levels - Only for intraday.
Perfect and best levels.
Works on all scripts with 5 and 15 mins.
Try and keep me posted.

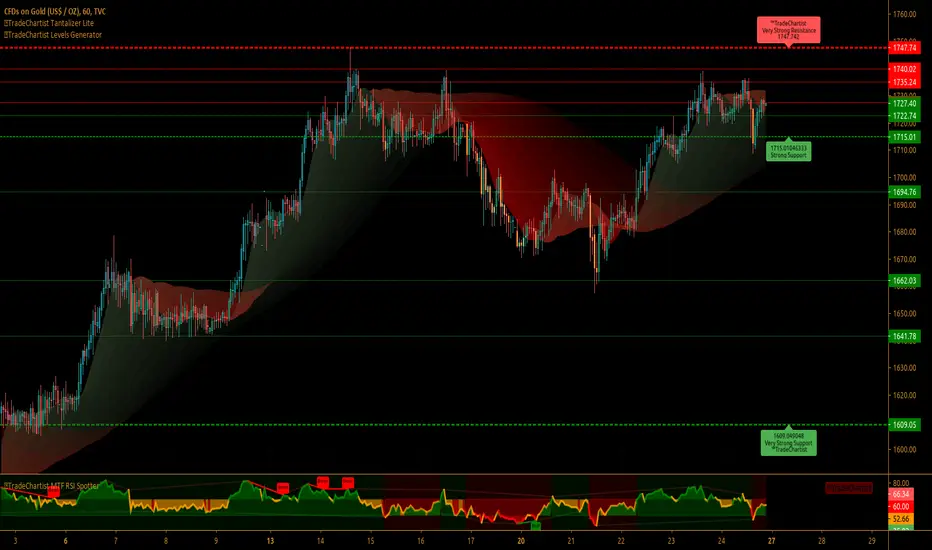
™TradeChartist Levels Generator V4"™TradeChartist Levels Generator" is an easy to use script that can be used by traders of all levels from beginners to advanced professionals.
What does the script do?
Plots the support and resistance levels automatically based on user preference of Local levels of Lower or Higher Timeframe from indicator settings.
Plots Fibonacci retracement levels between high and low based on 'Days' or 'Candles' lookback from indicator settings.
The script proves to be very effective when used with another indicator for trend confirmation like the ribbon (not included in this script) shown on chart.
What markets can this script be used on?
Forex
Stocks
Commodities
Cryptocurrencies
and almost any asset on Trading View
What is the difference between "Plot Levels" and "Plot Fibonacci Levels"?
"Plot Levels" plots support and resistance levels automatically without any input from the user other than preferred levels 'plot' from the indicator settings namely
Plot Local Levels for Higher TF - Plots all important Support/Resistance levels for mostly higher time frames (1hr or higher) - Short to Mid term outlook
Plot Local Levels for Lower TF - Plots all important Support/Resistance levels for mostly smaller time frames (can be used for up to 1hr in most cases) -
Recommended for Scalping/Swing Trading mostly dependent on volatility
"Plot Fibonacci Levels" plots all standard Fibonacci retracement levels - 0, 23.6%, 38.2%, 50%, 61.8%, 78.6% and 100% based on
"Days" Lookback - Fibonacci levels between High and Low based on number of days in the past, starting from the current day on any time frame chart
"Candles" Lookback - Fibonacci levels between High and Low based on number of candles in the past, starting from the current candle on any time frame chart
Can the Fibonacci levels be reversed?
Yes. The Fibonacci levels can be reversed by checking the "Reverse" checkbox from the indicator settings. This is very handy if the trend looks like there may be a support or resistance from one of the Fib levels and a possibility of a new high or a new low based on the price action.
What is the need for "Plot 1.272 Fibonacci Level" under "Plot Fibonacci Levels"?
1.272 is an important Fibonacci number as it is the square root of 1.618 and is the near support or resistance after 100% price retracement. Even though it keeps moving on the chart dependent on the new high or new low based on Days/Candles lookback, it serves as a 'nice to have' reference for any trader looking beyond 100% retracement for support/resistance .
Why do the 'local levels' lines' color changes between green and red?
The nearby levels lines change color based on price closing above or below them. This happens to only closest local levels for lower TF near price action and for top/bottom lines of the local levels for higher TF.
The line turns green when it becomes support as price closes above it.
The line turns red when it becomes resistance as price closes below it.
This is a free to use indicator. Give a thumbs up or leave a comment if you like the script.

Trend LinesHello Everyone! This is my new trend lines script (after beta version that was published almost one year ago)
The idea is to find Pivot Highs (PH) and Pivot Lows(PL) first.
Then, If current PH is smaller then previous PH (means no new higher high and possible downtrend) then draw trend line using them. and also it checks previous trend line (if exits) and if current angle is smaller then don't extend previous one.
Same idea when using Pivot Lows, If current PL is higher then previous PL (means no new lower low and possible uptrend) then draw trend line using them. and also it checks previous trend line (if exits) and if current angle is smaller then don't extend previous one.
Optionally style of old trend lines drawn as dashed.
Hope you enjoy it!

[fikira] Fibma/Fibema StrategyMy strategy regarding the Fibma/Fibema lines (also see my Fibma/Fibema study)
You can enable/disable each strategy to see what
works best in what timeframe
Thanks!
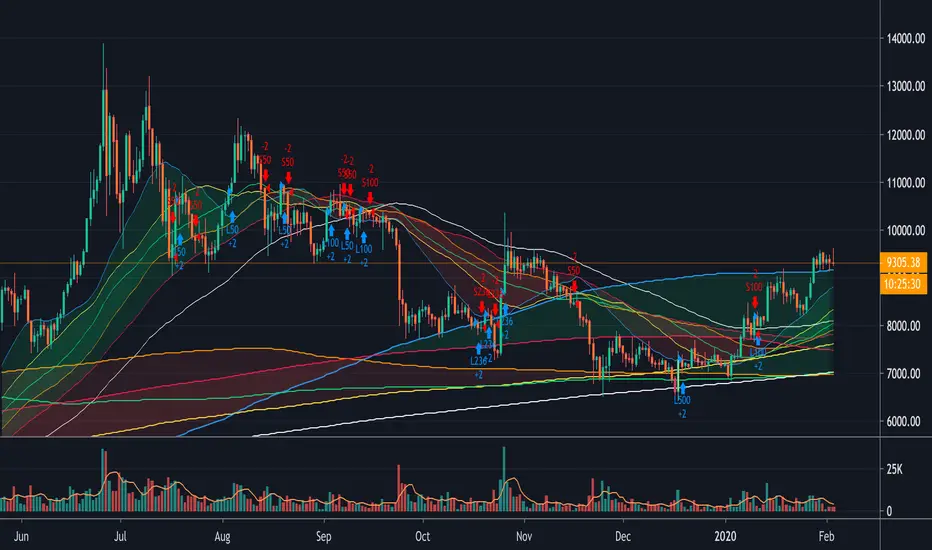
[fikira] Fibonacci MA / EMA's (Fibma / Fibema)I've made SMA/EMA's NOT based on the principle of the 2(1+1), 3(2+1),
5(3+2), 8(5+3), 13(8+5), 21(13+8), 34(21+13), 55(34+21), ... numbers,
but based on these following Fibonacci numbers:
0,236
0,382
0,500
0,618
0,764
1
Ending up with 2 series of Fibma / Fibema:
"Tiny Fibma / Fibema":
24, 38, 50, 62, 76, 100
"Big Fibma / Fibema":
236, 382, 500, 618, 764, 1000
IMHO it is striking how these lines often act as Resistance/Support,
although (except the 50, 100 & 500) they are not typical MA/EMA's.
They perform very well on every Timeframe as well!
Week:
3 Days:
1 Day:
4h:
1h:
Even on the 15 minutes:
Or 5':
Things to watch for:
Price compared to the Tiny or Big Fibma / Fibema (below or above)
Price compared to important Fibma / Fibema (for example below or
above MA 236, MA 764, MA 1000, ...)
Crossing of Fibma / Fibema 24/76, 236/764 and 38/62, 382/618
(bullish crossover = Lime coloured "cloud", bearish crossunder = Red coloured "cloud"),
...
I've made a change in barcolor if the close crosses the "Big Fibma / Fibema 500"
If price closes above MA/EMA 500, the first bar is yellow coloured,
if price stays above this level, candles are coloured lime/orange (= very bullish)
If price closes under MA/EMA 500, the first bar is purple,
if price stays under this level, candles are standard coloured (= very bearish)
Strategy will follow,
Thanks!

Smart Indicator 21 - Fibonacci LinesA simple Indicator that create Fibonacci Lines as Price.
It's a good way to see next Support and Resistance.

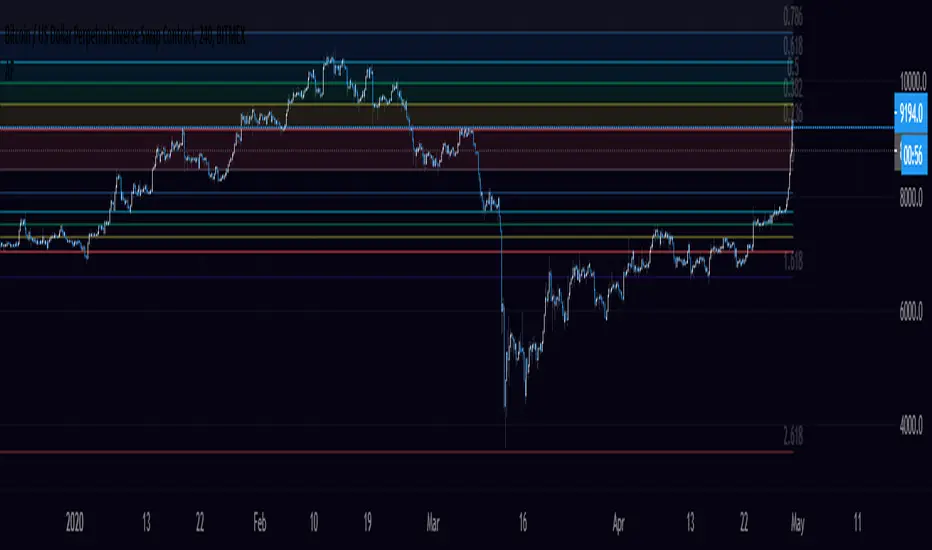
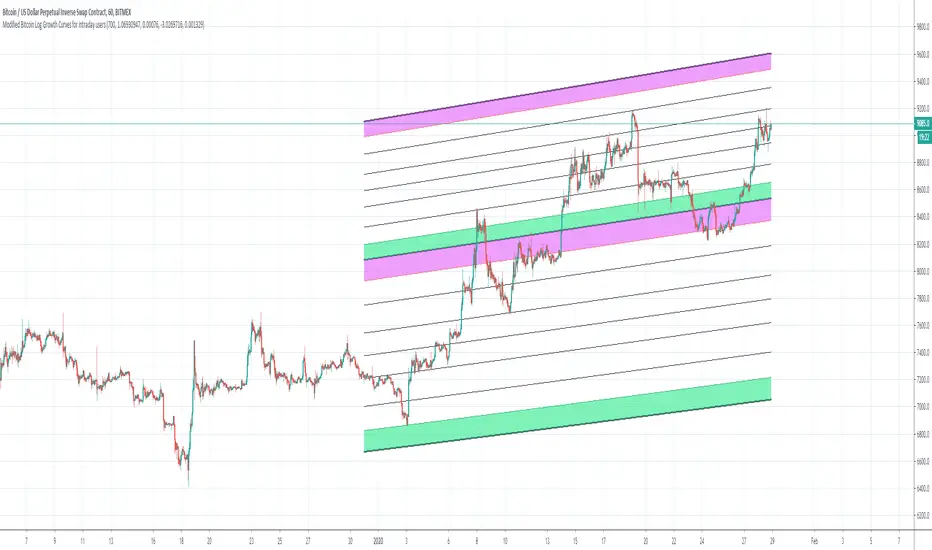
Bitcoin Logarithmic Growth Curves for intraday usersI wish to thank @Quantadelic who created this great indicator and leaving it open for others to improve.
I have made changes to make it user-friendly for the intraday traders.
The changes made have been;
1. Compartmentalized each area of the major Fibonacci level;
2. Added minor Fibonacci levels;
3. Color-coded the support and resistance levels, for better viewing;
4. Zoned each area of the major Fibonacci level; and
5. Created a time-frame display period for quicker loading of the indicator.
I have removed a few things to allow the indicator to run quicker;
1. Future projections; and
2. The major higher levels of the Fibonacci, which may be useful when Bitcoin reaches 100k.
Enjoy
Auto-fibsAutomatically plots Fibonacci Retracement levels.
Uses the all time high (ATH) for a specified number of days back, and the lowest value since the ATH, to plot the levels.

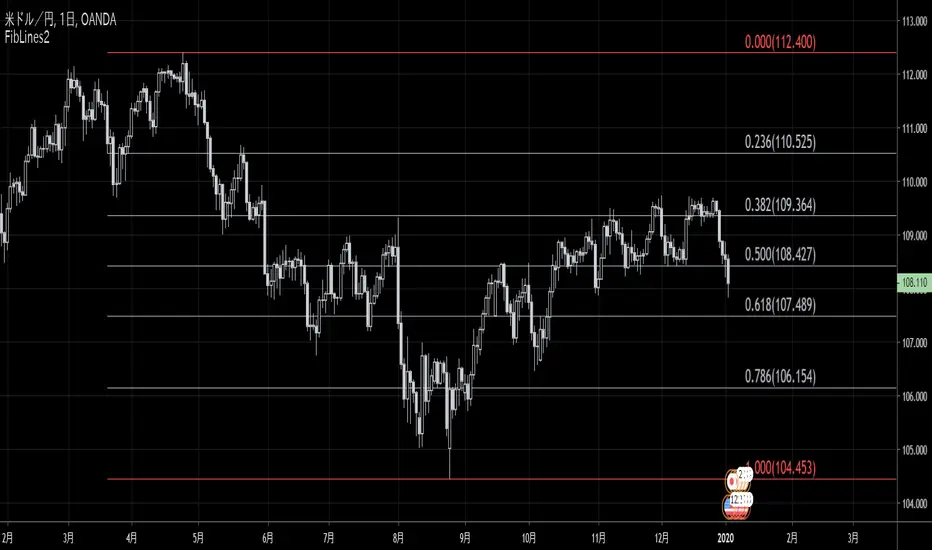
FibLines2This script is a new version of "FibLines" which automatically draws Fibonacci Lines on chart.
0% line and 100% line are determined by "Period" and "Delay" parameter.
◆Params
- Period: specifies periods to detect the highest (bearish) fractal and the lowest (bullish) fractal.
- Delay: specifies the number of new bars you ignore.
(👇 old version)

bg_FibCastVersion 1.0
A simple script to place horizontal lines where fib levels are, over a given period of candles, on a specified or charted time-frame. Includes the option to fib-retrace a "sub-zone" or the space between Fibonacci levels.
In The Depicted Example Above:
- Large white Fibonacci Lines from 377 Daily Candle Range, Gray "Sub-Fib" levels are plotted in "Zone 4" of the 377 1D Fib. Re-trace. (Zone 4 is between the 0.5 and 0.618, Zone 3 is between 0.618 and 0.786, etc.)
- Optional 1.618 Fib Extension is available for the main Fibonacci indicator, but is not shown here (Disabled/Hidden).
- Supports multiple time-frames, which is also depicted above. (377 Daily Candles used on 12-Hour chart.)
