Jitendra: MTF AIO Technical Indicators with Trend ▲▼Jitendra: MTF AIO Technical Indicators with Trend ▲▼
Why We Designed this Indicator
we build this indicator to Analysis Multi-timeframe Technical Data in dashboard to get Better and Quick Data in which Time Frame where it is in Momentum or in Swing,
By combining multiple technical indicators with trend direction arrows and displaying them in a customizable table.
It also optionally plots some indicators EMA, VWAP, Supertrend, Bollinger Bands on the chart.
Traders who want a compact technical summary across multiple timeframes without switching charts.
Quickly assess trend strength, momentum, divergence, volume pressure in one glance.
Combine with price action to make higher-confidence entries/exits.
How to Use This Indicator
In setting there are Two parts
First Part - for Plot Multi EMA, Bollinger Band, Supertrend 10,2 & 10, 3 factorial
Second Part- To get Data on Table for Quick Analysis
Chart Plots With Enable Disable Toggle in Setting
VWAP (optional)
4 EMAs (lengths configurable)
Bollinger Bands (optional)
Two separate Supertrend indicators with custom ATR period and multiplier
Indicators Data in Table
For each selected timeframe:
VWAP position (price above/below)
MACD value + trend arrow
MACD Histogram (optional)
RSI value + arrow (rising/falling)
ADX value + arrow (strength rising/falling)
+DI / -DI values + trend arrows
RSI Divergence detection (regular + hidden)
EMA levels (up/down relative to price)
EMA crossover (EMA1 vs EMA2 arrow)
Stochastic %K
Volume Matrix:
Raw volume
20 SMA volume
Volume % change from SMA
Multi-Timeframe Support
Current timeframe + up to 5 user-defined timeframes (e.g., 1H, 4H, Daily, Weekly, Monthly)
Customizable Toggles
Enable/disable any indicator
Choose which EMAs to show
Show/hide trend arrows
Choose which volume metrics to display
Choose table position (top_left, top_right, etc.)
Choose table text size
Trend Arrows & Colors
Green ▲ = bullish / rising trend
Red ▼ = bearish / falling trend
Gray – = neutral/no change
Background colors indicate overbought/oversold, trend strength, or volume surge.
Indicator Data Fetch PINE CODE Short Summary
request.security() → pulls data from the selected timeframe (tf).
Each indicator’s calculation can be wrapped inside request.security() so the values are computed on that timeframe.
//@version=5
// === 1. VWAP ===
vwap_htf = request.security(syminfo.tickerid, tf, ta.vwap)
// === 2. MACD ===
macd_src = request.security(syminfo.tickerid, tf, close)
macd_val = ta.ema(macd_src, 12) - ta.ema(macd_src, 26)
macd_sig = ta.ema(macd_val, 9)
macd_hist = macd_val - macd_sig
// === 3. RSI ===
rsi_htf = request.security(syminfo.tickerid, tf, ta.rsi(close, 14))
// === 4. ADX & DI ===
adx_htf = request.security(syminfo.tickerid, tf, ta.adx(14))
plusDI = request.security(syminfo.tickerid, tf, ta.plus_di(14))
minusDI = request.security(syminfo.tickerid, tf, ta.minus_di(14))
// === 5. Supertrend ===
= request.security(syminfo.tickerid, tf, ta.supertrend(3, 7))
// === 6. Bollinger Bands ===
basis = ta.sma(close, 20)
dev = ta.stdev(close, 20)
bb_up = request.security(syminfo.tickerid, tf, basis + dev * 2)
bb_low = request.security(syminfo.tickerid, tf, basis - dev * 2)
// === 7. Stochastic ===
k = ta.sma(ta.stoch(close, high, low, 14), 3)
d = ta.sma(k, 3)
stochK = request.security(syminfo.tickerid, tf, k)
stochD = request.security(syminfo.tickerid, tf, d)
// === 8. EMA ===
ema20 = request.security(syminfo.tickerid, tf, ta.ema(close, 20))
ema50 = request.security(syminfo.tickerid, tf, ta.ema(close, 50))
// === 9. Historical Volatility (HV) ===
logReturns = math.log(close / close )
hv = request.security(syminfo.tickerid, tf, ta.stdev(logReturns, 20) * math.sqrt(252))
plot(vwap_htf, "VWAP")
plot(macd_val, "MACD", color=color.blue)
plot(rsi_htf, "RSI", color=color.purple)
Rata-Rata Pergerakan Eksponensial / Exponential Moving Average (EMA)

EMA with Adaptive Straight SegmentsThis script transforms a traditional Exponential Moving Average (EMA) into a series of straight-line segments, making trend direction clearer and easier to follow. Instead of plotting every curve of the EMA, it connects key points with angled steps, giving a trend-line style look that removes noise and highlights slope.
What makes this version special is its adaptive segmentation:
Segment length automatically adjusts based on market volatility (ATR%).
In low volatility, segments stretch longer to smooth things out.
In high volatility, segments shorten to stay responsive to price swings.
Features:
Clean, step-style EMA representation.
Adjustable minimum/maximum segment lengths.
Customisable number of historical segments.
Optional display of the original EMA for comparison.
HUD label showing current ATR%, segment length, and segment count.
This tool is especially useful if, like me, you prefer structural analysis over noisy indicators. It keeps your chart tidy while still reflecting the true slope of the EMA. I find 50 and 200 are the most useful.

EMA Crossover Entry + ATR ExitOverview
A robust trend-following strategy that combines multiple Exponential Moving Averages (EMAs) for precise entry signals with smoothed Average True Range (ATR) for dynamic, volatility-based exits. Designed for traders who want to capture strong trending long-term moves while protecting profits with intelligent stop-loss management.
Strategy Logic
Entry Signal:
- Enters LONG when price closes above EMA 20, AND
- EMA 20 > EMA 50 > EMA 100 > EMA 200 (Perfect bull alignment)
Ensures entry only during confirmed uptrends with all EMAs properly stacked
Exit Signal:
- Uses smoothed ATR.
- Creates dynamic trailing stop that adjusts to market volatility
- Exits when price closes below ATR.
Check volume in addition to this, to boost confidence for your entry.
This works well for Long Term Investment.
Use Daily or Weekly timeframe.
Key Features
✅ Trend Confirmation: Four-EMA stack ensures strong trend alignment before entry
✅ Volatility-Adaptive Exits: ATR smoothing prevents whipsaw exits in choppy markets
Perfect for traders seeking systematic trend-following with professional risk management. Combines the reliability of multiple timeframe trend confirmation with the precision of volatility-based exits.
Happy Investing!
:)
Feel free to provide feedback; I would love to hear from you.
Note:
Strategy executes on bar close to prevent repainting.
Past performance does not guarantee future results.
Use proper risk management.

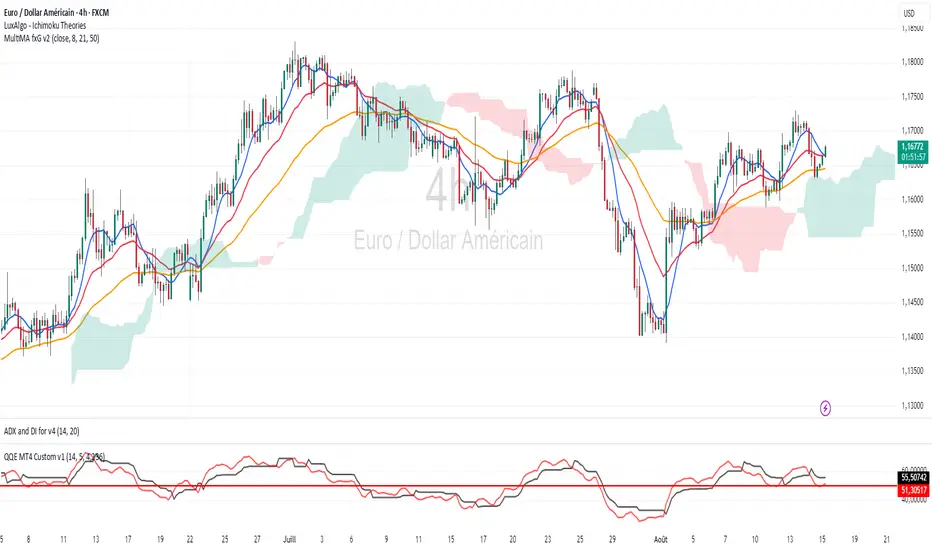
MultiMA fxG v2 Indicateur permettant de centralier 3 moving average :
- Moving average Simple 8 (bleu)
- Moving average Exponentielle 21 (rouge)
- Moving average Exponentielle 50 (Orange)
====================================================
Simple Moving Average (SMA) 8: Displayed in blue, this line provides a quick view of short-term price trends.
Exponential Moving Average (EMA) 21: Shown in red, this average is more sensitive to recent price changes and highlights medium-term momentum.
Exponential Moving Average (EMA) 50: Marked in orange, this line tracks longer-term price movements for overall trend direction.
Traders can use the combination of these moving averages to identify potential crossover signals, trend strength, and possible reversal points.
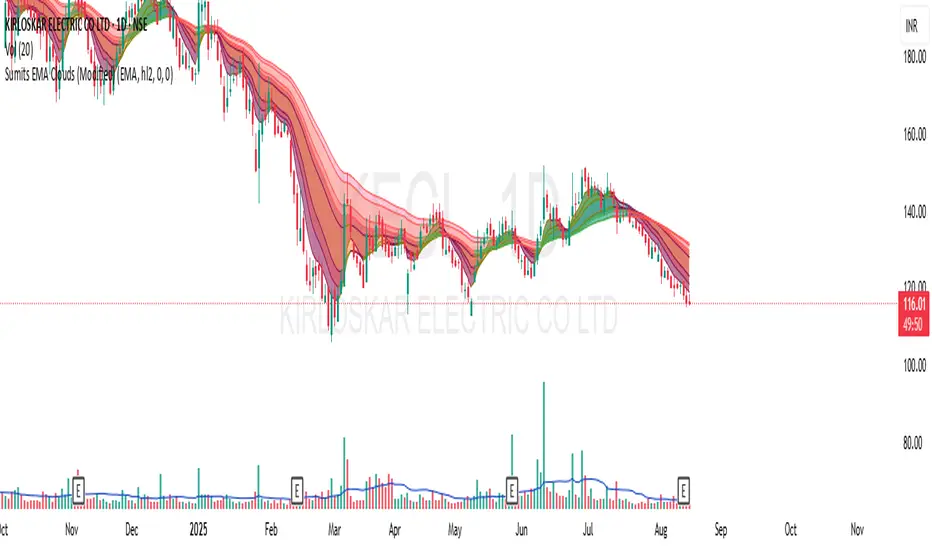
Sumits EMA Clouds (Modified)Overview
Sumit’s EMA Clouds (Modified) is a versatile trend-tracking and momentum-visualization tool designed for TradingView.
It overlays multiple exponential (or simple) moving average (MA) clouds directly on the price chart, helping traders quickly assess trend direction, strength, and possible reversal zones.
The indicator combines short-term and long-term MA pairs into “clouds,” color-coded for bullish or bearish bias, making it easy to interpret market structure at a glance.
Key Features
Customizable MA Type
Option to switch between EMA and SMA for all calculations.
Adjustable price source (default: (high + low) / 2) for fine-tuning.
Five Independent EMA Clouds
Cloud 1: EMA 5 vs EMA 30
Cloud 2: EMA 9 vs EMA 34
Cloud 3: EMA 13 vs EMA 45
Cloud 4: EMA 26 vs EMA 50
Cloud 5: EMA 26 vs EMA 200 (for major trend bias)
Trend-Based Coloring
Cloud Fill Color: Turns green/blue when the short MA is above the long MA (bullish bias), red/orange/pink when below (bearish bias).
Line Color: Adapts dynamically to the MA’s slope — olive/green for upward momentum, maroon/red for downward.
Toggle Visibility
Option to hide/show individual EMA clouds.
Option to hide/show MA lines while keeping only the shaded clouds for a cleaner look.
Offset & Leading Display
Ability to offset plotted MAs to project them forward for visual clarity or predictive modeling.
Trading Applications
Trend Confirmation:
Clouds expanding with bullish colors indicate strengthening upward trends; contracting or color-flipping clouds may signal reversals.
Dynamic Support/Resistance:
Price often reacts to cloud boundaries; the thicker the cloud, the stronger the zone.
Multi-Timeframe Consistency:
Works well across intraday, swing, and positional setups — shorter clouds for quick trades, longer clouds for macro trend guidance.
Momentum Visualization:
Changing slope colors give early hints of acceleration or weakening momentum.
How to Interpret
All Clouds Bullish (aligned & greenish):
Strong uptrend — consider trend-following entries.
All Clouds Bearish (aligned & reddish):
Strong downtrend — look for shorting opportunities.
Mixed Signals (clouds crossing in different directions):
Possible trend exhaustion or consolidation — avoid over-aggressive entries.
200 EMA Cloud (Cloud 5):
Acts as a “macro trend filter” — many traders only trade in the direction of this cloud.
Volume Rotor Clock [hapharmonic]🕰️ Volume Rotor Clock
The Volume Rotor Clock is an indicator that separates buy and sell volume, compiling these volumes over a recent number of bars or a specified past period, as defined by the user. This helps to reveal accumulation (buying) or distribution (selling) behavior, showing which side has superior volume. With its unique and beautiful display, the Volume Rotor Clock is more than just a timepiece; it's a dynamic dashboard that visualizes the buying and selling pressure of your favorite symbols, all wrapped in an elegant and fully customizable interface.
Instead of just tracking price, this indicator focuses on the engine behind the movement: volume. It helps you instantly identify which assets are under accumulation (buying) and which are under distribution (selling).
---
🎨 20 Pre-configured Templates
---
🧐 Interpreting the Clock Display
The interface is designed to give you multiple layers of information at a glance. Let's break down what each part represents.
1. The Main Clock Hands (Current Chart Symbol)
The clock hands—hour, minute, and second—are dedicated to the symbol on your current active chart .
Minute Hand: Displays the base currency of the current symbol (e.g., USDT, USD) at its tip.
Hour Hand: Displays the percentage of the winning volume side (buy vs. sell) at its tip.
Color Gauge: The color of the text characters at the tip of both the hour and minute hands acts as your primary volume gauge for the current symbol.
If buy volume is dominant , the text will be green .
If sell volume is dominant , the text will be red .
Tooltip: Hovering your mouse over the text at the tip of the hour or minute or other spherical elements hand will reveal a detailed tooltip with the precise Buy Volume, Sell Volume, Total Volume, Buy %, and Sell % for the current chart's symbol.
2. The Volume Scanner: Bulls & Bears (Symbols Inside the Clock) 🐂🐻
The circular symbols scattered inside the clock face are your multi-symbol volume scanner. They represent the assets you've selected in the indicator's settings.
Green Circles (Bulls - Upper Half): These represent symbols from your list where the total buy volume is greater than the total sell volume over the defined "Lookback" period. They are considered to be under bullish accumulation. The size of the circle and its text grows larger as the buy percentage becomes more dominant. The percentage shown within the circle represents the buy volume's share of the total volume, calculated over the 'Lookback (Bars)' you've set.
Red Circles (Bears - Lower Half): These represent symbols where the total sell volume is greater than the total buy volume. They are considered to be under bearish distribution or selling pressure. The size of the circle indicates the dominance of the sell-side volume. The percentage shown within the circle represents the sell volume's share of the total volume, calculated over the 'Lookback (Bars)' you've set.
3. The Bullish Watchlist (Symbols Above the Clock) ⭐
The symbols arranged neatly along the top edge of the clock are the "best of the bulls." They are symbols that are not only bullish but have also passed an additional, powerful strength filter.
What it Means: A symbol appears here when it shows signs of sustained, high-volume buying interest . It's a way to filter out noise and focus on assets with potentially significant accumulation phases.
The Filter Logic: For a bullish symbol (where total buy volume > total sell volume) to be promoted to the watchlist, its trading volume must meet specific criteria based on this formula:
ta.barssince(not(volume > ta.sma(volume, X))) >= Y
In plain English, this means: The indicator checks how many consecutive bars the `volume` has been greater than its `X`-bar Simple Moving Average (`ta.sma(volume, X)`). If this count is greater than or equal to `Y` bars, the condition is met.
(You can configure `X` (Volume MA Length) and `Y` (Consecutive Days Above MA) in the settings.)
Why it's Useful: This filter is powerful because it looks for consistency . A single spike in volume can be an anomaly. However, when an asset's volume remains consistently above its recent average for several consecutive days, it strongly suggests that larger players or a significant portion of the market are actively accumulating the asset. This sustained interest can often precede a significant upward price trend.
---
⚙️ Indicator Settings Explained
The Volume Rotor Clock is highly customizable. Here’s a detailed walkthrough of every setting available in the "Inputs" tab.
🎨 Color Scheme
This group allows you to control the entire aesthetic of the clock.
Template: Choose from a wide variety of professionally designed color themes.
Use Template: A simple checkbox to switch between using a pre-designed theme and creating your own.
`Checked`: You can select a theme from the dropdown menu, which offers 20 unique templates like "Cyberpunk Neon" or "Forest Green". All custom color settings below will be disabled (grayed out and unclickable).
`Unchecked`: The template dropdown is disabled, and you gain full control over every color element in the sections below.
🖌️ Custom Appearance & Colors
These settings are only active when "Use Template" is unchecked.
Flame Head / Tail: Sets the start and end colors for the dynamic flame effect that traces the clock's border, representing the second hand.
Numbers / Main Numbers: Customize the color of the regular hour numbers (1, 2, 4, 5...) and the main cardinal numbers (3, 6, 9, 12).
Sunburst Colors (1-6): Controls the six colors used in the gradient background for the "sunburst" effect inside the clock face.
Hands & Digital: Fine-tune the colors for the Hour/Minute Hand, Second Hand, central Pivot point, and the digital time display.
Chain Color / Width: Customize the appearance of the two chains holding the clock.
📡 Volume Scanner
Control the behavior of the multi-symbol scanner.
Show Scanner Labels: A master switch to show or hide all the bull/bear symbol circles inside the clock.
Lookback (Bars): A crucial setting that defines the calculation period for buy/sell volume for all scanned symbols. The calculation is a sum over the specified number of recent bars.
`0`: Calculates using the current bar only .
`7`: Calculates the sum of volume over the last 8 bars (the current bar + 7 historical bars).
Symbols List: Here you can enable/disable up to 20 slots and input the ticker for each symbol you want to scan (e.g., BINANCE:BTCUSDT , NASDAQ:AAPL ).
⭐ Bullish Watchlist Filter
Configure the criteria for the elite watchlist symbols displayed above the clock.
Enable Watchlist: A master switch to turn the entire watchlist feature on or off.
Volume MA Length: Sets the lookback period `(X)` for the Simple Moving Average of volume used in the filter.
Consecutive Days Above MA: Sets the minimum number of consecutive days `(Y)` that volume must close above its MA to qualify.
Symbols Per Row: Determines the maximum number of watchlist symbols that can fit in a single row before a new row is created above it.
Background / Text Color: When not using a template, you can set custom colors for the watchlist symbols' background and text.
📏 Position & Size
Adjust the clock's placement and dimensions on your chart.
Clock Timezone: Sets the timezone for the digital and analog time display. You can use standard formats like "America/New_York" or enter "Exchange" to sync with the chart's timezone.
Radius (Bars): Controls the overall size of the clock. The radius is measured in terms of the number of bars on the x-axis.
X Offset (Bars): Moves the entire clock horizontally. Positive values shift it to the right; negative values shift it to the left.
Y Offset (Price %): Moves the entire clock vertically as a percentage of your screen's price pane. Positive values move it up; negative values move it down.

Matrix bands by JaeheeMatrix Bands — multi-sigma EMA bands for price dispersion context (no signals)
📌 What it is
Matrix Bands draws an EMA-based central line with multiple standard-deviation envelopes at ±1σ, ±1.618σ, ±2σ, ±2.618σ, ±3σ.
Thin core lines show the precise band levels, while subtle outer “glow” lines improve readability without obscuring candles.
📌 How it works (concept)
Basis: EMA of the selected source (default: close)
Dispersion: Rolling sample standard deviation over the same length
Bands: Basis ± k·σ for k ∈ {1, 1.618, 2, 2.618, 3}
This is not a strategy and does not generate trade signals.
It provides price dispersion context only.
📌 Why these levels together (justification of the combination)
Using multiple σ layers reveals graduated risk zones in one view:
±1σ: routine fluctuation
±1.618σ & ±2σ: extended but still common excursions
±2.618σ & ±3σ: statistically rare extremes, where mean-reversion risk or trend acceleration risk increases
Combining these specific multipliers allows traders to judge positioning vs. volatility instantly, without switching between separate indicators or re-configuring a single band.
📌 How it differs from classic Bollinger Bands
Unlike classic Bollinger Bands, which typically use an SMA basis and only ±2σ envelopes,
Matrix Bands uses an EMA basis for faster trend responsiveness and plots five sigma levels (±1, ±1.618, ±2, ±2.618, ±3).
This design allows traders to visualize market dispersion across multiple statistical thresholds simultaneously, making it more versatile for both trend-following and mean-reversion contexts.
📌 How to read it (context, not signals)
Mean-reversion context: Moves beyond ±2σ may indicate stretched conditions; wait for your own confirmation signals before acting
Trend context: In strong trends, price can “ride” the outer bands; sustained closes near +2σ~+3σ (uptrend) or −2σ~−3σ (downtrend) suggest persistent momentum
Regime observation: Band width expands in high volatility and contracts in quiet regimes; adjust stops and sizing accordingly
📌 Inputs
BB Length: lookback period for EMA and σ (default: 20)
Source: price source for calculations
📌 Design notes
Thin inner lines = exact levels
Soft outer lines = readability “glow” only; no effect on calculations
Overlay display keeps the chart uncluttered
📌 Limitations & good practice
No entry/exit logic; use with your own strategy rules
Volatility interpretation varies by timeframe
Past patterns do not guarantee future outcomes; risk management is essential
📌 Defaults & scope
Works on any symbol with OHLCV
No alerts, no strategy results, no performance claims

Momentum_EMABand📢 Reposting Notice
I am reposting this script because my earlier submission was hidden due to description requirements under TradingView’s House Rules. This updated version fully explains the originality, the reason for combining these indicators, and how they work together. Follow me for future updates and refinements.
🆕 Momentum EMA Band, Rule-Based System
Momentum EMA Band is not just a mashup — it is a purpose-built trading tool for intraday traders and scalpers that integrates three complementary technical concepts into a single rules-based breakout & retest framework.
Originality comes from the specific sequence and interaction of these three filters:
Supertrend → Sets directional bias.
EMA Band breakout with retest logic → Times precise entries.
ADX filter → Confirms momentum strength and avoids noise.
This system is designed to filter out weak setups and false breakouts that standalone indicators often fail to avoid.
🔧 How the Indicator Works — Combined Logic
1️⃣ EMA Price Band — Dynamic Zone Visualization
Plots upper & lower EMA bands (default: 9-period EMA).
Green Band → Price above upper EMA = bullish momentum
Red Band → Price below lower EMA = bearish pressure
Yellow Band → Price within band = neutral zone
Acts as a consolidation zone and breakout trigger level.
2️⃣ Supertrend Overlay — Reliable Trend Confirmation
ATR-based Supertrend adapts to volatility:
Green Line = Uptrend bias
Red Line = Downtrend bias
Ensures trades align with the prevailing trend.
3️⃣ ADX-Based No-Trade Zone — Choppy Market Filter
Manual ADX calculation (default: length 14).
If ADX < threshold (default: 20) and price is inside EMA Band → gray background marks low-momentum zones.
🧩 Why This Mashup Works
Supertrend confirms trend direction.
EMA Band breakout & retest validates the breakout’s strength.
ADX ensures the market has enough trend momentum.
When all align, entries are higher probability and whipsaws are reduced.
📈 Example Trade Walkthrough
Scenario: 5-minute chart, ADX threshold = 20.
Supertrend turns green → trend bias is bullish.
Price consolidates inside the yellow EMA Band.
ADX rises above 20 → trend momentum confirmed.
Price closes above the green EMA Band after retesting the band as support.
Entry triggered on candle close, stop below band, target based on risk-reward.
Exit when Supertrend flips red or ADX momentum drops.
This sequence prevents premature entries, keeps trades aligned with trend, and avoids ranging markets.
🎯 Key Features
✅ Multi-layered confirmation for precision trading
✅ Built-in no-trade zone filter
✅ Fully customizable parameters
✅ Clean visuals for quick decision-making
⚠ Disclaimer: This is Version 1. Educational purposes only. Always use with risk management.

200 EMA w/ Ticker Memory200 EMA w/ Ticker Memory — Multi-Symbol & Multi-Timeframe EMA Tracker with Alerts
Overview
The 200 EMA w/ Ticker Memory indicator allows you to monitor the 200-period Exponential Moving Average (EMA) across multiple symbols and timeframes. Designed for traders managing multiple tickers, it provides customizable timeframe inputs per symbol and instant alerts on price touches of the 200 EMA.
Key Features
Multi-symbol support: Configure up to 20 different symbols, each with its own timeframe setting.
Flexible timeframe input: Assign specific timeframes per symbol or use a default timeframe fallback.
Accurate 200 EMA calculation: Uses request.security to fetch 200 EMA from the symbol-specific timeframe.
Visual EMA plots: Displays both the EMA on the selected timeframe and the EMA on the current chart timeframe for comparison.
Touch alerts: Configurable alerts when price “touches” the 200 EMA within a user-defined sensitivity percentage.
Ticker memory: Remembers your configured symbols and displays them in an on-chart table.
Compact info table: Displays current symbol status, alert settings, and timeframe in a clean, transparent table overlay.
How to Use
Configure Symbols and Timeframes:
Input your desired symbols (up to 20) and their respective timeframes under the “Symbol Settings” groups in the indicator’s settings pane.
Set Default Timeframe:
Choose a default timeframe to be used when no specific timeframe is assigned for a symbol.
Adjust Alert Settings:
Enable or disable alerts and set the touch sensitivity (% distance from EMA to trigger alerts).
Alerts
Alerts trigger once per bar when the price touches the 200 EMA within the defined sensitivity threshold.
Alert messages include:
Symbol / Current price / EMA value / EMA timeframe used / Chart timeframe / Timestamp
Customization
200 EMA Color: Change the line color for better visibility.
Touch Sensitivity: Fine-tune how close price must be to the EMA to count as a touch (default 0.1%).
Enable Touch Alerts: Turn on/off alert notifications easily.
For:
- Swing traders monitoring multiple stocks or assets.
- Day traders watching key EMA levels on different timeframes.
- Analysts requiring a quick visual and alert system for 200 EMA touches.
- Portfolio managers tracking key technical levels across various securities.
Limitations
Supports up to 20 configured symbols (can be extended manually if needed).
Works best on charts with reasonable bar frequency due to request.security usage.
Alert frequency is limited to once per bar for clarity.
Disclaimer
This indicator is provided “as-is” for educational and informational purposes only. It does not guarantee trading success or financial gain.

Supertrend EMA Vol Strategy V5### Supertrend EMA Strategy V5
**Overview**
This is a trend-following strategy designed for cryptocurrency markets like BTC/USD on daily timeframes, combining the Supertrend indicator for dynamic trailing stops with an EMA filter for trend confirmation. It aims to capture strong uptrends while avoiding counter-trend trades, with optional volume filtering for high-conviction entries and ATR-based stop-loss to manage risk. Ideal for long-only setups in bullish assets, it visually highlights trends with green/red bands and fills for easy interpretation. Backtested on BTC from 2024-2025, it shows potential for outperforming buy-and-hold in trending markets, but always use with proper risk management—past performance isn't indicative of future results.
**Key Features**
- **Supertrend Core**: Uses ATR to plot adaptive uptrend (green) and downtrend (red) lines, flipping on closes beyond prior bands for buy/sell signals.
- **EMA Trend Filter**: Entries require price above the EMA (default 21-period) for longs, ensuring alignment with the broader trend.
- **Volume Confirmation**: Optional filter only allows entries when volume exceeds its EMA (default 20-period), reducing false signals in low-activity periods.
- **Risk Controls**: Built-in ATR-multiplier stop-loss (default 2x) to cap losses; exits on Supertrend flips for trailing profits.
- **Visuals**: Green/red lines and highlighter fills for up/down trends, plus buy/sell labels and circles for signals.
- **Customizable Inputs**: Tweak ATR period (default 10), multiplier (default 3), EMA length, start date, long/short toggles, SL, and volume filter.
- **Alerts**: Built-in for buy/sell and direction changes.
**How to Use**
1. Add to your TradingView chart (e.g., BTC/USD 1D).
2. Adjust inputs: Start with defaults for trend-following; increase multiplier for fewer trades/higher win rate. Enable volume filter for volatile assets.
3. Monitor signals: Green "Buy" for long entries (if close > EMA and conditions met); red "Sell" for exits.
4. Backtest in Strategy Tester: Focus on equity curve, win rate (~50-60% in tests), and drawdown (<15% with SL).
5. Live Trading: Use small position sizes (1-2% risk per trade); combine with your analysis. Shorts disabled by default for bull-biased markets.

EMA Deviation with Min/Max Levelshis indicator visualizes the percentage deviation of the closing price from its Exponential Moving Average (EMA), helping traders identify overbought and oversold conditions. It dynamically tracks the minimum and maximum deviation levels over a user-defined lookback period, highlighting extreme zones with color-coded signals:
• 🔵 Normal deviation range
• 🔴 Near historical maximum — potential sell zone
• 🟢 Near historical minimum — potential buy zone
Use it to spot price extremes relative to trend and anticipate possible reversals or mean reversion setups.

MK_OSFT - Multi-timeframe MA Lines with labelsProvides SMA/EMA levels on a chart for the 5m, 15m, 1H and 4H timeframes. It does not draw the full MA's on the chart but provides 'only' the actual MA values at the current candle as a horizontal line with a label.

Trend Impulse Tester | Trend–Impulse–No-Chop (In development) Trend strategy. Regulate your entry and make the drawdown less than 3%, entry at % of capital. Currently under development.
Used on cryptocurrency. The 30 min timeframe was used. Adjust the values yourself, settings are provided

Burt's Multi-EMA RibbonBurt’s Multi-EMA Ribbon is a simple tool for visualising multiple Exponential Moving Averages (EMAs) on the same chart.
It plots the 9, 21, 50, 100, and 200-period EMAs, allowing users to observe their relative positioning. The space between the EMA 9 and EMA 21 is shaded to highlight their relationship.
The script also includes optional alert conditions that notify when EMA 9 moves above or below EMA 21. These features can help traders monitor changes in EMA alignment without constantly watching the chart.
This indicator is intended as an analytical aid and should be used together with other forms of chart analysis. It does not provide buy or sell recommendations.
EMA Hammer DetectorIdentfies hammers and inverted hammers when printed at either the 10, 20, 50, 200 EMAs, after candle close.
Customisable lower and upper shadows, and candle body.
Customisable labels.
Customisable EMA lines.
Can define which of the 4 listed EMAs you want hammers and inverted hammers to be identified.
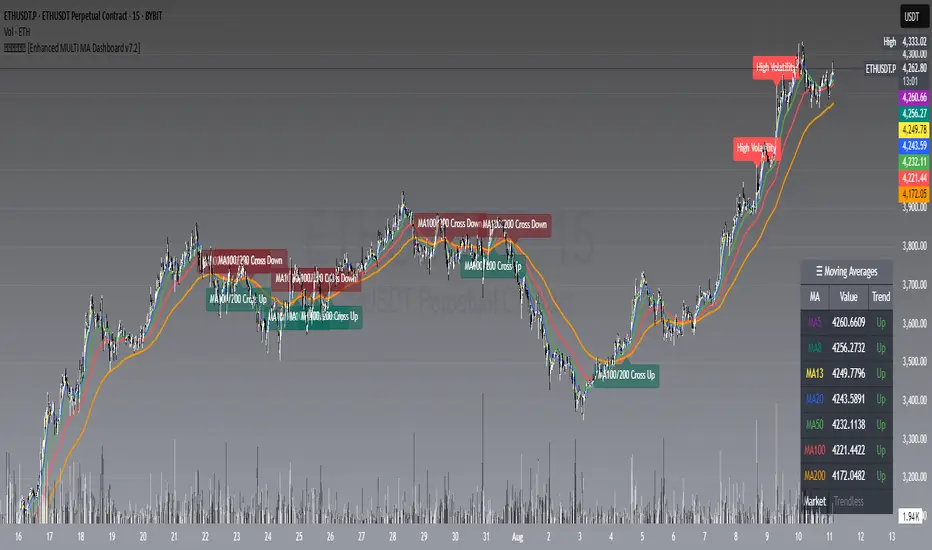
𝙷✪𝚕𝚍𝚎𝚖 [Enhanced MULTI MA Dashboard v7.2]
𝙷✪𝚕𝚍𝚎𝚖 — Enhanced MULTI MA Dashboard v7.2
What it does
A complete moving-average control center that overlays up to seven MAs (5/8/13/20/50/100/200), draws dynamic MA clouds between consecutive pairs, tags crossover events (optional), and shows a compact on-chart dashboard with each MA’s current value and slope-based trend (Up/Down/Flat). It also detects Trendless and High-Volatility regimes to help you adapt your strategy.
Key Features
7 Configurable Moving Averages
Turn each MA on/off individually (5, 8, 13, 20, 50, 100, 200).
Choose type per MA: SMA, EMA, WMA, HMA, VWMA.
Set lengths freely and color each line.
Works on any symbol and timeframe; source selectable (close/open/high/low, etc.).
☁︎ MA Clouds (optional)
Shaded cloud between each consecutive pair (5–8, 8–13, 13–20, 20–50, 50–100, 100–200).
Cloud auto-colors toward the currently dominant MA (above/below) with adjustable transparency.
Quick visual read of short- vs long-side control and compression/expansion.
⚠️ Market Regime Detection
Trendless: measures how tightly short MAs (5, 8, 13) are clustered using std-dev % of their values; user-set threshold.
High Volatility: flags when ATR(Length) > ATR SMA × Multiplier.
Optional background tint and chart labels when regimes flip.
Dashboard cell shows Trending / Trendless / High Volatility with color coding.
➕ Crossover Signal Labels (fully granular)
Toggle labels for any pair you care about (e.g., 5/8, 8/20, 50/200, etc.).
Separate styles/colors for Cross Up and Cross Down; adjustable label size.
Great for momentum shifts, golden/death cross style monitoring, or timing add/reduce decisions.
(Note: these are visual labels; no alertconditions are defined.)
📊 On-Chart MA Dashboard
Compact, movable table (Top/Bottom/Middle, Left/Right/Center).
Columns: MA name, current value, trend direction (derived from MA slope).
Customizable text size, header text, colors, background, optional alternating row colors, and border styling.
Auto-adds a Market row when regime detection is enabled.
How to Use
1 Pick your data source (close by default) and switch on the MAs you care about.
2 Choose MA types and lengths to match your system (e.g., EMA for reactivity, SMA for smoothing).
3 Enable MA Clouds to see compression/expansion and dominance at a glance.
4 Set regime thresholds:
Lower Trendless Threshold → stricter definition of chop.
Raise ATR Multiplier → fewer, “truer” high-volatility flags.
5 Activate specific crossovers that fit your playbook (e.g., 5/20 for short-term momentum, 50/200 for cycle turns).
6 Position and style the dashboard so it stays readable on your layout.
Signal & Reading Guide
Trend column (Up/Down/Flat) reflects the slope of each MA (today vs previous bar).
Cloud flips (color dominance changes) often precede or confirm crossover labels.
Trendless suggests range conditions; consider mean-reversion tools or stand aside.
High Volatility calls for wider stops or volatility-aware sizing; breakouts can travel farther.
Disclaimer
This tool is for education and visualization. It does not constitute financial advice and is not a buy/sell system by itself. Always validate signals within your broader risk-managed plan.
EMA Triad Vanguard Pro [By TraderMan]📌 EMA Triad Vanguard Pro — Advanced Trend & Position Management System
📖 Introduction
EMA Triad Vanguard Pro is an advanced indicator that utilizes three different EMAs (Exponential Moving Averages) to analyze the direction, strength, and reliability of market trends.
It goes beyond a single timeframe, performing trend analysis across 8 different timeframes simultaneously and automatically tracking TP/SL management.
This makes it a powerful reference tool for both short-term traders and medium-to-long-term swing traders.
⚙ How It Works
EMAs:
EMA 21 → Responds quickly to short-term price changes.
EMA 50 → Shows medium-term price direction.
EMA 200 → Determines the long-term market trend.
Trend Direction Logic:
📈 Long Signal: EMA 21 crosses above EMA 200 and EMA 21 > EMA 50.
📉 Short Signal: EMA 21 crosses below EMA 200 and EMA 21 < EMA 50.
Trend Strength Calculation:
Calculates the percentage distance between EMAs.
Strength levels: Very Weak → Weak → Strong → Very Strong.
Multi-Timeframe Analysis:
Analyzes trend direction for: 5min, 15min, 30min, 1H, 4H, Daily, Weekly, and Monthly charts.
Generates an overall market bias from combined results.
Automatic Position Management:
When a position is opened, TP1, TP2, TP3, and SL levels are calculated automatically.
As price reaches these levels, chart labels appear (TP1★, TP2★, TP3★, SL!).
📊 How to Use
1️⃣ Long (Buy) Setup
EMA 21 must cross above EMA 200 ✅
EMA 21 must be above EMA 50 ✅
Overall market bias should be “Bullish” ✅
Entry Price: closing price of the signal candle.
TP levels: calculated based on upward % targets.
SL: a set % below the entry price.
2️⃣ Short (Sell) Setup
EMA 21 must cross below EMA 200 ✅
EMA 21 must be below EMA 50 ✅
Overall market bias should be “Bearish” ✅
Entry Price: closing price of the signal candle.
TP levels: calculated based on downward % targets.
SL: a set % above the entry price.
💡 Pro Tips
Multi-timeframe alignment significantly increases the signal reliability.
If trend strength is “Very Strong”, chances of hitting TP targets are higher.
Weak trends may cause false signals → confirm with extra indicators (RSI, MACD, Volume).
TP levels are ideal for partial take-profits → lock in gains and reduce risk.
📌 Advantages
✅ Displays both trend direction and trend strength at a glance.
✅ Multi-timeframe approach avoids tunnel vision from a single chart.
✅ Automatic TP/SL calculation eliminates manual measuring.
✅ Labeled signal alerts make tracking positions easy and visual.
⚠ Important Notes
No indicator is 100% accurate — sudden news events or manipulations may cause false signals.
Use it together with other technical and fundamental analysis methods.
Signal reliability may decrease in low liquidity markets.
🎯 In summary:
EMA Triad Vanguard Pro combines trend tracking, position management, and multi-timeframe analysis in a single package, helping professional traders reduce workload and make more strategic trades.

EMA Cross 5/21 with Accurate Break Triangles & Clean Prev OHLCEMA Cross 5/21 with Structure Break & OHLC Levels
Purpose
This strategy combines EMA crossovers with market structure breakouts for more reliable trade signals.
It enhances trade context by plotting Previous Day and Previous Week key levels (Open, High, Low, Close), which are widely used for intraday decision-making.
Core Components
1. EMA Trend Filter
Uses a fast EMA (5) and a slow EMA (21).
Bullish bias: EMA 5 crosses above EMA 21.
Bearish bias: EMA 5 crosses below EMA 21.
EMA cross serves as the initial momentum shift signal.
2. Market Structure Break Confirmation
After an EMA cross, the script looks for a structure break within 3 candles:
Bullish Break: Price closes above the most recent swing high.
Bearish Break: Price closes below the most recent swing low.
Swing points are determined using a 3-bar lookback on each side.
This confirmation filters out false EMA crosses that occur during consolidation.
3. Entry Signal Visualization
Green triangle below the bar = Bullish structure break within 3 bars after bullish EMA cross.
Red triangle above the bar = Bearish structure break within 3 bars after bearish EMA cross.
These markers appear only when both EMA direction and structure break agree.
4. Key Market Levels (Support/Resistance)
The script automatically draws straight horizontal reference lines for:
Previous Day OHLC:
PDO – Previous Day Open (Blue)
PDC – Previous Day Close (Yellow)
PDH – Previous Day High (Red)
PDL – Previous Day Low (Green)
Previous Week OHLC (lighter shades):
PWO – Previous Week Open (Light Blue)
PWC – Previous Week Close (Light Yellow)
PWH – Previous Week High (Light Red)
PWL – Previous Week Low (Light Green)
These levels help traders identify:
Potential support/resistance zones.
High-probability breakout or reversal points.
Institutional liquidity levels.
Trading Logic
Wait for EMA cross to set bias (bullish or bearish).
Within 3 bars, check for a break of the last swing high/low in the direction of bias.
Plot signal (green triangle up for bullish, red triangle down for bearish).
Use PD/PW levels as confluence zones for entry, stop placement, or target setting.
Advantages
Filters out many false signals from simple EMA cross strategies.
Adds market structure awareness.
Automatically integrates important daily/weekly reference levels.
Signals are visually intuitive for faster decision-making.
Best Use Cases
Intraday trading: Using PD/PW levels for scalping or day trades.
Swing trading: Waiting for higher timeframe EMA cross + structure break confirmation.
Breakout trading: Combining PDH/PDL or PWH/PWL breaks with EMA confirmation.

VWAP BANDSThe VWAP bands are like moving-average bands, but instead of being based on a simple or exponential moving average, they are calculated around the Volume Weighted Average Price (VWAP).
Here’s the breakdown:
1. VWAP (Volume Weighted Average Price)
VWAP is the average price a security has traded at throughout the day, weighted by volume.
Formula:
𝑉
𝑊
𝐴
𝑃
=
∑
(
𝑃
𝑟
𝑖
𝑐
𝑒
×
𝑉
𝑜
𝑙
𝑢
𝑚
𝑒
)
∑
𝑉
𝑜
𝑙
𝑢
𝑚
𝑒
VWAP=
∑Volume
∑(Price×Volume)
It tells you the “fair” intraday price based on where most trading happened.
2. VWAP Bands
VWAP bands are created by placing upper and lower boundaries around the VWAP line, usually using standard deviations or a fixed percentage distance.
Upper Band = VWAP + (k × standard deviation)
Lower Band = VWAP − (k × standard deviation)
Here, k is how many standard deviations you want (often 1 or 2).
3. Purpose
Shows potential overbought/oversold zones relative to the day's VWAP.
Works like Bollinger Bands, but tied to VWAP instead of a moving average.
Used by day traders and scalpers to spot extremes where price may revert toward VWAP.
4. Interpretation
Price near upper VWAP band → market extended above “fair” value, possible pullback.
Price near lower VWAP band → market extended below “fair” value, possible bounce.
Price crossing VWAP → potential change in short-term trend sentiment.

Multi-EMAMulti-EMA Indicator
This script plots five commonly used Exponential Moving Averages (EMAs) on your chart for trend identification and trade timing.
Included EMAs & Colors:
EMA 8 — Red
EMA 20 — Orange
EMA 50 — Yellow
EMA 100 — Cyan
EMA 200 — Blue
How to use:
Shorter EMAs (8 & 20) help identify short-term momentum and potential entry/exit points.
Mid-range EMA (50) gives a broader view of intermediate trends.
Longer EMAs (100 & 200) are used to confirm long-term trend direction and key support/resistance zones.
Crossovers between EMAs can signal potential trend changes.
Price trading above most EMAs often signals bullish conditions, while trading below suggests bearish momentum.
Designed to work on any timeframe or market.

Trend Filter (Higher Timeframe EMA)English (EN)
This indicator overlays the higher timeframe (default: 1H) EMA trend onto your current chart to serve as a directional filter for trading decisions.
- Fetches and plots EMA20 / EMA50 / EMA200 from a higher timeframe (user-configurable)
- Identifies LONG trend when EMA20 > EMA50 > EMA200, SHORT trend when EMA20 < EMA50 < EMA200
- Changes background color based on trend direction (Green = Long, Red = Short)
- Can trigger alerts when a new trend direction is detected
1. Apply this script to lower timeframes such as 5m or 15m charts to see the higher timeframe trend.
2. When the background is green, consider long setups; when red, consider short setups.
3. Use this as a filter in conjunction with your main entry signals, not as a standalone strategy.
- Default higher timeframe is 1 hour, but you can change it in the settings.
- This script does not provide financial advice. Use at your own risk.
日本語(JP)
このインジケーターは、現在のチャートに上位足(デフォルト:1時間足)のEMAトレンドを重ねて表示し、売買方向のフィルターとして利用できます。
【機能】
- 上位足(設定可能)のEMA20 / EMA50 / EMA200 を取得して表示
- EMA20 > EMA50 > EMA200 でロングトレンド、EMA20 < EMA50 < EMA200 でショートトレンド判定
- トレンド方向に応じて背景色を変化(緑=ロング、赤=ショート)
- トレンド発生時にアラートを送信可能
【使い方】
1. 5分足や15分足など短期足に適用し、背景色で上位足の流れを確認します。
2. 背景が緑の時は買い目線、赤の時は売り目線で短期エントリーを検討します。
3. 単独での売買判断ではなく、他のテクニカル指標と併用してご利用ください。
【注意】
- デフォルトは1時間足で計算していますが、設定から変更可能です。
- 本スクリプトは投資助言を行うものではありません。ご利用は自己責任でお願いします。

Clean Multi-Indicator Alignment System
Overview
A sophisticated multi-indicator alignment system designed for 24/7 trading across all markets, with pure signal-based exits and no time restrictions. Perfect for futures, forex, and crypto markets that operate around the clock.
Key Features
🎯 Multi-Indicator Confluence System
EMA Cross Strategy: Fast EMA (5) and Slow EMA (10) for precise trend direction
VWAP Integration: Institution-level price positioning analysis
RSI Momentum: 7-period RSI for momentum confirmation and reversal detection
MACD Signals: Optimized 8/17/5 configuration for scalping responsiveness
Volume Confirmation: Customizable volume multiplier (default 1.6x) for signal validation
🚀 Advanced Entry Logic
Initial Full Alignment: Requires all 5 indicators + volume confirmation
Smart Continuation Entries: EMA9 pullback entries when trend momentum remains intact
Flexible Time Controls: Optional session filtering or 24/7 operation
🎪 Pure Signal-Based Exits
No Forced Closes: Positions exit only on technical signal reversals
Dual Exit Conditions: EMA9 breakdown + RSI flip OR MACD cross + EMA20 breakdown
Trend Following: Allows profitable trends to run their full course
Perfect for Swing Scalping: Ideal for multi-session position holding
📊 Visual Interface
Real-Time Status Dashboard: Live alignment monitoring for all indicators
Color-Coded Candles: Instant visual confirmation of entry/exit signals
Clean Chart Display: Toggle-able EMAs and VWAP with professional styling
Signal Differentiation: Clear labels for entries, X-crosses for exits
🔔 Alert System
Entry Notifications: Separate alerts for buy/sell signals
Exit Warnings: Technical breakdown alerts for position management
Mobile Ready: Push notifications to TradingView mobile app
Market Applications
Perfect For:
Gold Futures (GC): 24-hour precious metals trading
NASDAQ Futures (NQ): High-volatility index scalping
Forex Markets: Currency pairs with continuous operation
Crypto Trading: 24/7 cryptocurrency momentum plays
Energy Futures: Oil, gas, and commodity swing trades
Optimal Timeframes:
1-5 Minutes: Ultra-fast scalping during high volatility
5-15 Minutes: Balanced approach for most markets
15-30 Minutes: Swing scalping for trend following
🧠 Smart Position Management
Tracks implied position direction
Prevents conflicting signals
Allows trend continuation entries
State-aware exit logic
⚡ Scalping Optimized
Fast-reacting indicators with shorter periods
Volume-based confirmation reduces false signals
Clean entry/exit visualization
Minimal lag for time-sensitive trades
Configuration Options
All parameters fully customizable:
EMA Lengths: Adjustable from 1-30 periods
RSI Period: 1-14 range for different market conditions
MACD Settings: Fast (1-15), Slow (1-30), Signal (1-10)
Volume Confirmation: 0.5-5.0x multiplier range
Visual Preferences: Colors, displays, and table options
Risk Management Features
Clear visual exit signals prevent emotion-based decisions
Volume confirmation reduces false breakouts
Multi-indicator confluence improves signal quality
Optional time filtering for session-specific strategies
Best Use Cases
Futures Scalping: NQ, ES, GC during active sessions
Forex Swing Trading: Major pairs during overlap periods
Crypto Momentum: Bitcoin, Ethereum trend following
24/7 Automated Systems: Algorithmic trading implementation
Multi-Market Scanning: Portfolio-wide signal monitoring
