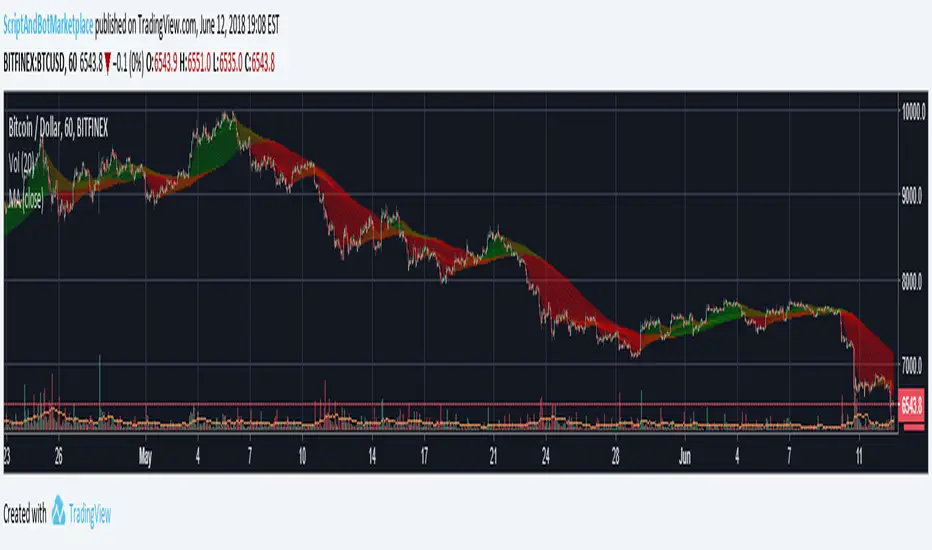
Script and Bot Marketplace's Trend Detector 2.0Use this custom indicator to analyze the current trend of any market that you choose on all time frames. Works great as a secondary indicator while day or swing trading.
Interested? Check us out here: www.scriptandbotmarketplace.com
Join our discord to talk about bots, scripts, and crypto: discord.gg
Custom
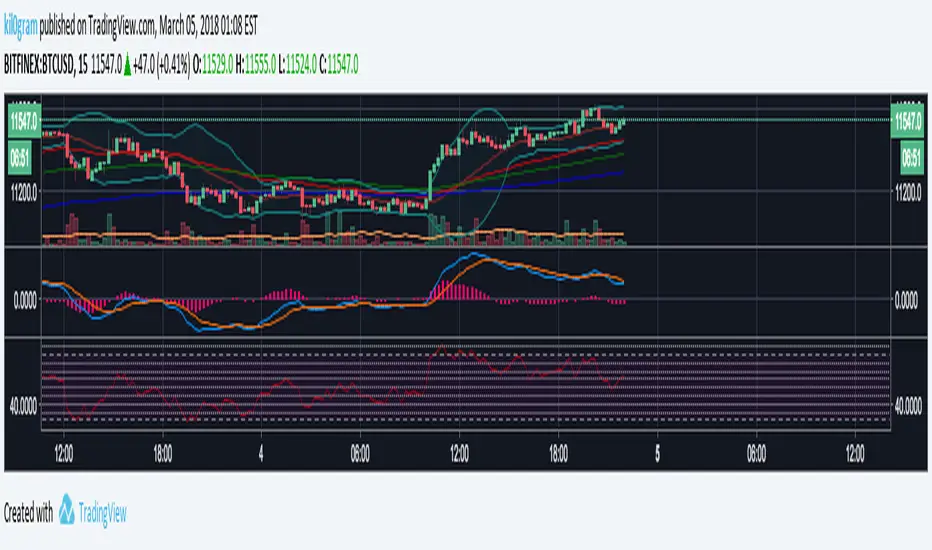
TDI Complementary Overlay by YardleyRosetteMay 2018, Traders Dynamic Index Overlay Indicator ( Free Indicator )
The Full 'TDI' Complementary Overlay for all securities. FOREX, BITCOIN (CRYPTOCURRENCIES), STOCKS, etc.
This is the overlay of Traders Dynamic Index updated in my knowledge to optimal settings.
Added an "Xtreme" Phaser for noticing major moving average/trendline breakouts.
Added representation of Overbought/Sold level lines.
Moving Averages visually reordered.
Settings I found of moving averages to correlate the best with Traders Dynamic Index all in one overlay indicator.
Using KK_Traders Dynamic Index_Bar Highlighting which is the closest to Traders Dynamic Index Pro on MT4, I set the best alignment to Traders Dynamic Index with potential target price points as an overlay indicator representing Traders Dynamic Index components and a level as moving averages on price chart.
"Phaser", as in phase changing; shifting direction.
Especially for those who do not have TV PRO.
______________
El Índice Dinámico de Comerciantes encimadas a gráficas de precio.
En especial para quienes solo pueden usar 3 indicadores.
_____________

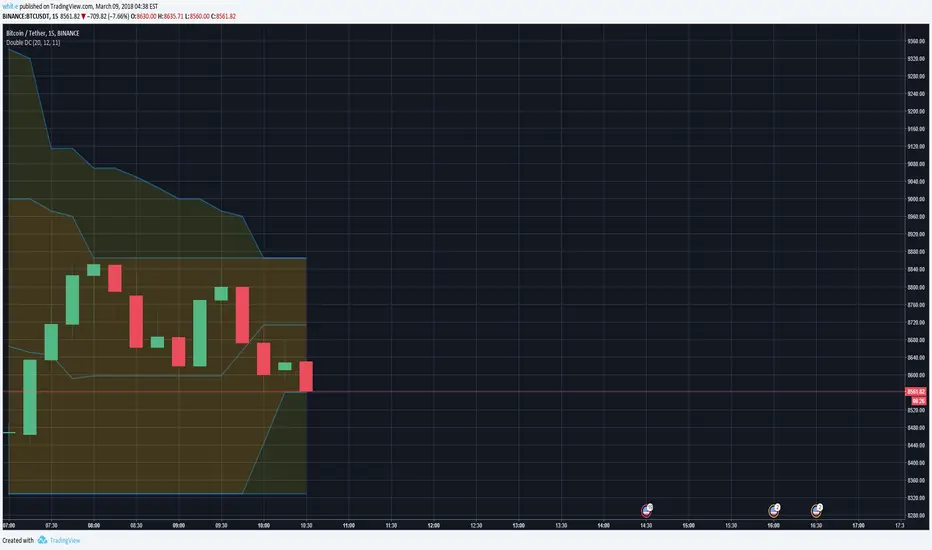
Double Donchian Channels & Custom AverageAllows to calculate 2 Donchian Channels and plot the average of a 3rd Donchian which can be arbitrary.
Donchian 1 and 2 Completely displayed (without average)
Donchian 3 only shows the average
RSI with ChannelsRSI with support/resistance lines in increments of 5. I've found this to be another good indicator to tell where the momentum is going.
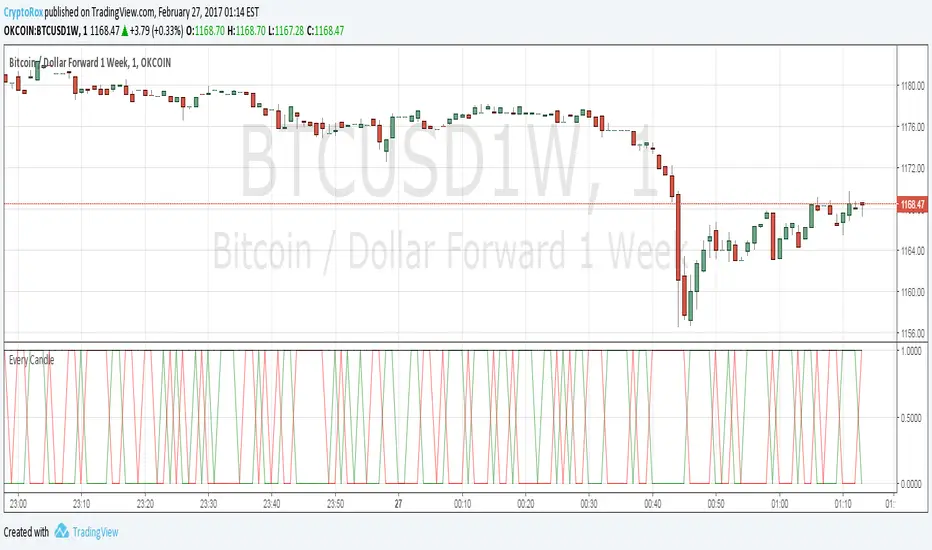
[Autoview] Every Candle Alert ScriptThis script is designed specifically for firing an alert every candle. It can also be used to just fire an alert on a green candle, or a red candle to slow it down a bit.
This is a script we use to close all of our orders or positions on any of the integrated exchanges.
You can use a fire once alert with greater than on condition and the alert will typically fire within seconds. You can also use this to place orders for you without having to navigate away from TradingView to your exchange/brokerage site.
If you would like a better understanding of how to create an alert for automation, please visit the article this strategy is being published for.
use.autoview.with.pink
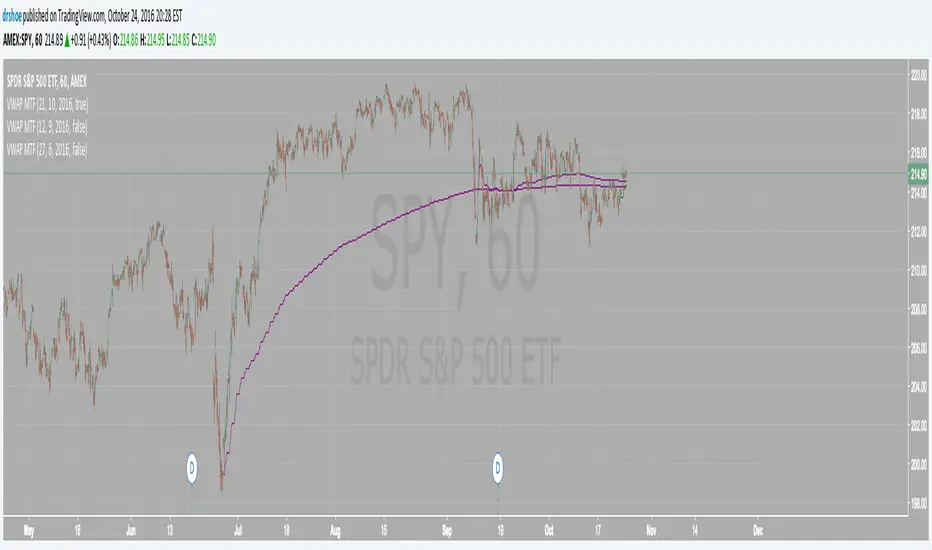
VWAP MTF Custom Dates (Multi Timeframe VWAP with Custom Dates)This is extremely useful tool for analyzing the market. Brian Shannon from alphatrends.net uses this very frequently and I've programmed it for tradingview.
you can calculate the VWAP from any dates on the chart and it works with any intraday timeframe. Simply select on the settings icon and select your day month and year parameters!
Please follow for more future updates
Happy trading!
Daniel
DecisionPoint Volume Swenlin Trading Oscillator [LazyBear]This is the volume version of "DecisionPoint Breadth Swenlin Trading Oscillator"
DecisionPoint Swenlin Trading Oscillator can be used to identify short-term tops and bottoms. You can read about the interpretation of the signals (& gotchas) in the link below.
I have added support for NYSE / NASD / AMEX and also a combined mode. You can specify custom advancing/declining volume symbols too.
More Info:
DBSTO:
Article: stockcharts.com
List of my public indicators: bit.ly
List of my app-store indicators: blog.tradingview.com
Having both Swenlin Breadth and Volume oscillators help spot the divergences quickly:

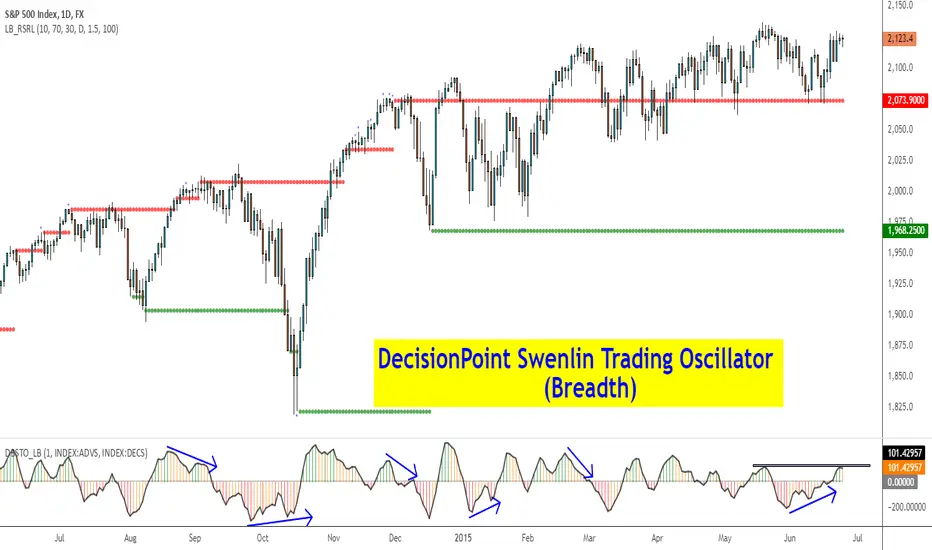
DecisionPoint Breadth Swenlin Trading Oscillator [LazyBear]DecisionPoint Swenlin Trading Oscillator can be used to identify short-term tops and bottoms. This is a breadth indicator. STO is designed to be calculated using either issues or volume, I will post a follow up indicator that makes use of volume.
You can read about the interpretation of the signals (& gotchas) in the link below.
I have added support for NYSE / NASD / AMEX and also a combined mode. You can specify custom advancing/declining mkt symbols too.
More Info:
stockcharts.com
List of my public indicators: bit.ly
List of my app-store indicators: blog.tradingview.com
DecisionPoint Price Momentum Oscillator [LazyBear]The DecisionPoint Price Momentum Oscillator (PMO) is an oscillator based on a Rate of Change calculation that is smoothed twice with custom exponential moving averages. Because the PMO is normalized, it can also be used as a relative strength tool.
PMO can be used in many ways:
- PMO can be used to determine the OB/OS state. While the +2.5 to -2.5 is the usual range for broad stock market indexes, each price index will have its own “signature” range. You may have to tune this for your instrument.
- PMO triggers buy/sell on signal crossovers and ZERO crossovers.
- Common patterns like BullKiss, BearKiss are useful to track. See the link below for more info.
- Divergences.
- Histo-only mode that can be used similar to MACD-Histo.
I have exposed all params as configurable. Have fun tuning :) Don't forget to share what you found for your instrument.
More Info:
stockcharts.com
List of my public indicators: bit.ly
List of my app-store indicators: blog.tradingview.com
Some Sample Charts:
TWTR:
MSFT:
GOOGL:

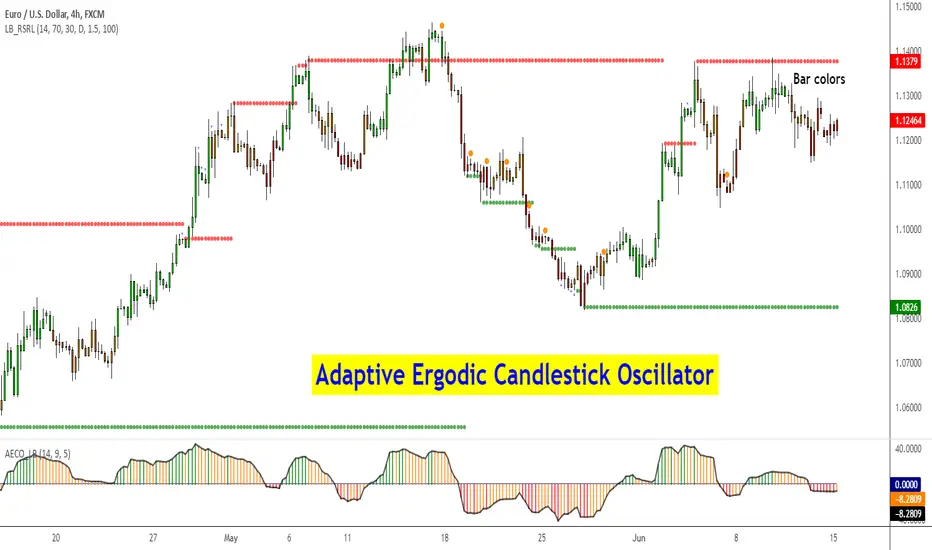
Adaptive Ergodic Candlestick Oscillator [LazyBear]This updates Blau's excellent Candlestick oscillator to be adaptive by using the length of a scaled stochastic indicator and an exponent (for calculating the smoothing coefficient) to obtain the moving average.
Check out the options page for configurable variables.
More info on Ergodic Oscillator:
Book: "Momentum, Direction and Divergence" by William Blau
List of my public indicators: bit.ly
List of my app-store indicators: blog.tradingview.com
Apirine Slow RSI [LazyBear]The slow relative strength index (SRSI) indicator created by Vitali Apirine is a momentum price oscillator similar to RSI in its application and interpretation. Oscillating between 0 and 100, it generates both OB/OS signals and midline (50) cross over signals and divergences.
As author suggests, bullish/bearish divergences generated by SRSI are not as effective during strong trends. To avoid fading an established trend, the system is used in conjunction with a trend confirmation tool like ADX indicator.
You can configure the OB/OS levels, default are 70/30.
More info:
The slow relative strength index, TASC 2015-07
List of my public indicators: bit.ly
List of my app-store indicators: blog.tradingview.com

Ehlers Smoothed Adaptive Momentum [LazyBear]Bored of Ehlers yet? :) I still have plenty of Ehlers in my collection, was thinking of publishing one of his Fishers or Adaptive RVI next, but @ChartArt requested Smoothed Adaptive Momentum (SAM), so here we go...
This is my 200th script (not including the variations and other custom scripts I shared over PM). My complete list of indicators here - bit.ly
Now, about the indicator :)
This smoothed adaptive momentum is straightforward to use (per Ehlers original rules). If it crosses above zero buy the next open, if it crosses below zero sell the next open. Of course, I strongly suggest filtering the signals.
Finally, here's an Ehlers-only chart to help determine where BTC is heading :P
More info:
- Ehlers CG Oscillator:
- Cybernetic Analysis for Stocks and Futures (Ehlers)
List of my public indicators: bit.ly
List of my app-store indicators: blog.tradingview.com
--Updated chart--
Here's the chart with barcolors ON (forgot to turn it on in the published one)

Ehlers Adaptive CG Indicator [LazyBear]Lets go with another adaptive indicator today. BTW, this is my 199th script (1 more and I am planning to work on my other backlogs).
This is the adaptive version of Ehlers' Center Of Gravity (CG) (already published, check "More info" below). Idea behind making something "adaptive" is to calculate it using dynamic cycle period inputs instead of static setting. In adaptive CG, Ehlers uses the dominant cycle period as the length in computation of alpha.
According to Ehlers this should be more responsive than the non-adaptive version. Buy and sell signals should often occur one bar earlier than for the non-adaptive version.
I have the usual options in place. Check out plain CC for comparison.
Here's a quick comparison between CG and Adaptive CG:
More info:
- Ehlers CG Oscillator:
- Cybernetic Analysis for Stocks and Futures (Ehlers)
List of my public indicators: bit.ly
List of my app-store indicators: blog.tradingview.com

Ehlers Adaptive Cyber Cycle Indicator [LazyBear]Another famous Ehlers indicator.
This is the adaptive version of Ehlers' Cyber Cycle (CC) (already published, check "More info" below). Idea behind making something "adaptive" is to calculate it using dynamic cycle period inputs instead of static setting. In adaptive cyber cycle, Ehlers uses the dominant cycle period as the length in computation of alpha.
According to Ehlers this should be more responsive than the non-adaptive version. Buy and sell signals should often occur one bar earlier than for the non-adaptive version.
I have the usual options in place. Check out plain CC for comparison.
More info:
- Cyber Cycle Indicator:
- Cybernetic Analysis for Stocks and Futures (Ehlers)
List of my public indicators: bit.ly
List of my app-store indicators: blog.tradingview.com

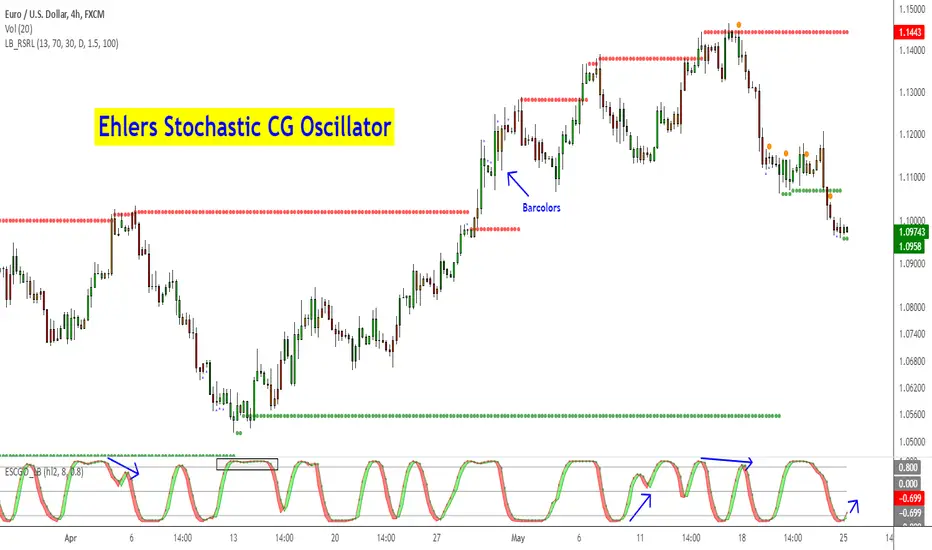
Ehlers Stochastic CG Oscillator [LazyBear]Another one from Ehlers.
Ehlers likes the idea behind StochRSI so much, he dedicated a full chapter in his book (linked below) on how stoch works with his "superlative" (his words, not mine) indicators. This is stoch of his CG oscillator.
Standard stochastic oscillator uses fixed period for calculations and does not adjust to the constantly changing market cycle length. Stochastic CG Oscillator does not have such a drawback.
Use this like normal stochRSI osc (Uncheck "Fill Osc/Trigger" option, sample chart below)
More info:
- CG oscillator:
- Cybernetic Analysis for Stocks and Futures (Ehlers)
List of my public indicators: bit.ly
List of my app-store indicators: blog.tradingview.com
Ehlers MESA Adaptive Moving Average [LazyBear]Another one to add to Ehlers collection.
The MESA Adaptive Moving Average (MAMA) adapts to price movement based on the rate of change of phase as measured by the Hilbert Transform Discriminator. This method features a fast attack average and a slow decay average so that composite average rapidly ratchets behind price changes and holds the average value until the next ratchet occurs. Consider FAMA (Following AMA) as the signal.
Here are some of the options:
Fill MAMA/FAMA region (ribbon mode):
Mark Crossovers:
The above options (along with the bar colors) allow this to be used as a standalone system.
BTW, John Ehlers calls MAMA, "Mother of all Adaptive Moving Averages", lemme know what you think :)
More info:
- MESA Adaptive Moving Average, Stocks and Commodities Magazine, August 2001
- MAMA: www.mesasoftware.com
List of my public indicators: bit.ly
List of my app-store indicators: blog.tradingview.com

Ehlers Simple Cycle Indicator [LazyBear]One of the early cycle indicators from John Ehlers.
Ehlers suggests using this with ITrend (see linked PDF below). Osc/signal crosses identify entry/exit points.
Options page has the usual set of configurable params.
More info:
- Simple Cycle Indicator: www.mesasoftware.com
List of my public indicators: bit.ly
List of my app-store indicators: blog.tradingview.com

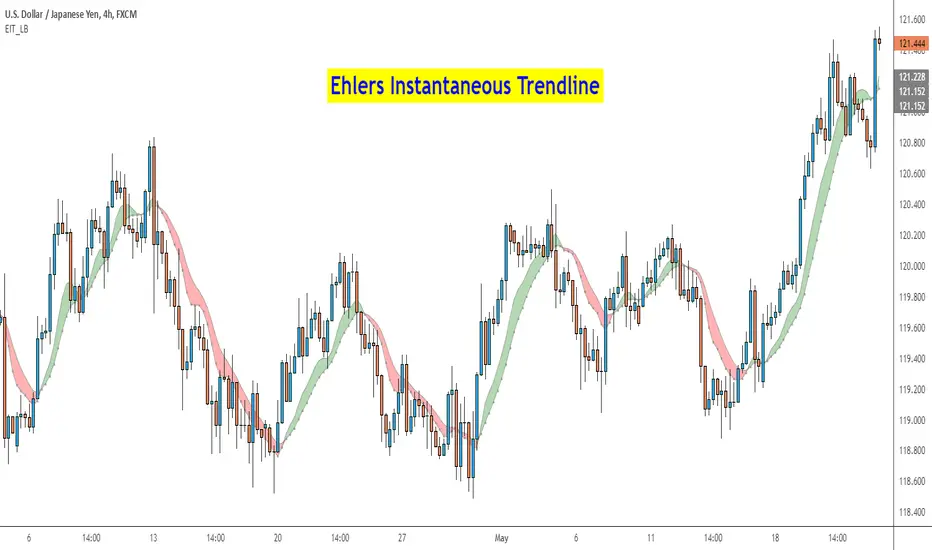
Ehlers Instantaneous Trend [LazyBear]One more to add to the Ehlers collection.
Ehlers Instantaneous Trendline, by John Ehlers, identifies the market trend by doing removing cycle component. I think, this simplicity is what makes it attractive :) To understand Ehlers's thought process behind this, refer to the PDF linked below.
There are atleast 6 variations of this ITrend. This version is from his early presentations.
Is this better than a simple HMA? May be, May be not. I will leave it to you to decide :)
I have added options to show this as a ribbon, and to color bars based on ITrend. Check out the options page.
More info:
- ITrend: www.mesasoftware.com
List of my public indicators: bit.ly
List of my app-store indicators: blog.tradingview.com
Ehlers Center of Gravity Oscillator [LazyBear]As part of my "Ehler's Indicators week", here's one more.
CG Oscillator, by John Ehlers, provides a smoothed, essentially zero lag oscillator for identifying market turning points. The "CG" in the name of the oscillator refers to "Center Of Gravity" of the prices over the window of observation.
Entry/Exit are based on the osc/signal crossovers. Enabling the "Color bars" options helps in easily identifying crossovers.
More info:
- CG osc (pdf): www.mesasoftware.com
- TASC Article: traders.com
- Cybernetic Analysis for Stocks and Futures (Ehlers, 2004)
List of my public indicators: bit.ly
List of my app-store indicators: blog.tradingview.com

Premier RSI Oscillator [LazyBear]This is a modified form of PSO (original idea by Lee Leibfarth), to use RSI as the input.
This provides a quick response to changes in market direction. This highly sensitive indicator allows for early anticipation of price turns and can be used to establish definitive trading zones that identify potential trading opportunities.
Entry/Exit rules are the same as PSO. Enabling bar colors makes it easy to identify the entry/exits too (Refer to my comment below for more points to keep in mind regarding colors)
Here's a comparison against normal RSI.
More info:
PSO:
List of my public indicators: bit.ly
List of my app-store indicators: blog.tradingview.com

Ehlers Cyber Cycle Indicator [LazyBear]The Cyber Cycle Indicator, developed by John Ehlers, is used for isolating the cycle component of the market from its trend counterpart. Unlike other oscillators like RSI, Cyber Cycle Indicator's wave has a variable amplitude.
Use the osc/signal crossover for entry/exit points. You can enable highlighting the crossovers by using region fills (via options page). I have also added an option to color the bars based on this.
Actually I have lot of Ehlers indicators in my to-publish backlog, will try to prioritize them over the others in the pipeline. Lets have an Ehlers week for indicators :)
More info:
Cybernetic Analysis for Stocks and Futures
List of my public indicators: bit.ly
List of my app-store indicators: blog.tradingview.com

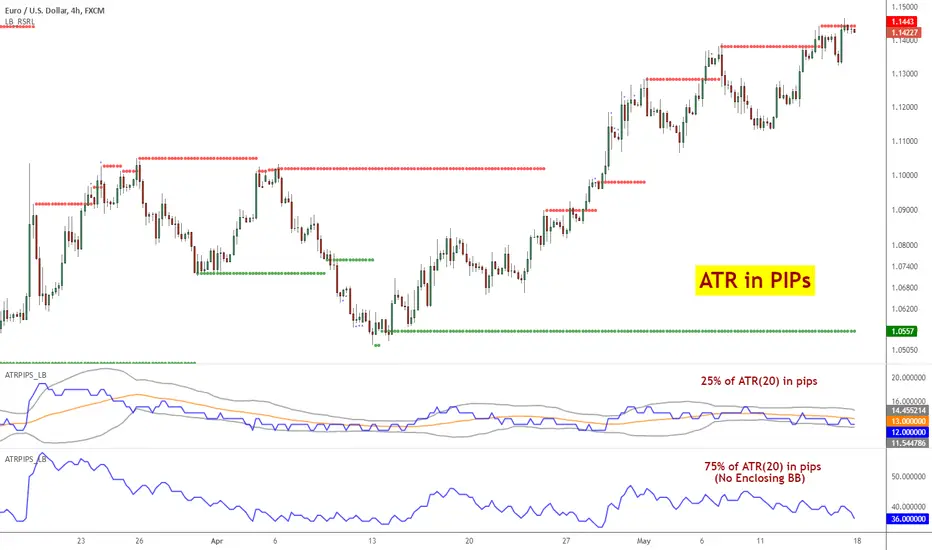
ATR Pips [LazyBear]This is ATR in pips. This was requested by user @ElixiumCapital. ATRPIPs in his words:
"ATR PIPs is useful for finding markets with your desired amount of volatility, for example I prefer to trade forex pairs with the highest amount of volatility in the past 5 days, setting the length parameter to 5 days. And setting my stop loss at 25% to 33% of the the indicators value."
I have added options to show a BB around ATR, as well as normal ATR (not in PIPs). All the parameters are configurable.
List of my public indicators: bit.ly
List of my app-store indicators: blog.tradingview.com
DiNapoli MACD & Stoch [LazyBear] --- Updated: May 19 2015 ----
Applicable only If you are setting up alerts:
I noticed I have switched the plot names. Histo shd be the MACD and DMACD shd be the Signal.
Replace lines 16 & 17 with these to get the correct names. NOTE that no functionality is affected, just the names.
plot(r, style=columns, color=r>0?green:red, transp=80, title="Dinapoli MACD")
plot(s, color=teal, linewidth=2, title="Trigger")
--- Original Description ---
These two indicators are from one of my favorite books - DiNapoli's Levels. These are custom MACD and Stoch used by him. There are more indicators - Detrended Osc, DisplacedMA - that he uses, will publish them all later.
The settings of normal MACD/Stoch can be tuned to obtain these DiNapoli indicators, or if you are lazy (like me!) just use these :)
DiNapoli Preferred Stoch source: pastebin.com
More info:
www.amazon.com
List of my public indicators: bit.ly
List of my app-store indicators: blog.tradingview.com
