Realtime Cumulative DeltaThis is a Real time volume Delta indicator which has to run real time on the chart to capture observation.
Start it when the session starts and log the data and observe. It plots histograms as well as candlesticks of the the cumulative volume delta, from the style switch whichever you want.
It is done based on real time tick and not based on candlesticks, so the accuracy of volume delta is more. Uptick volumes are added as buy and downtick volumes as sell which is the actual way of calculating CVD
Apply the CVD concepts for trading results.
Cumulative

WAP ⸗ Weighted Average PricingsOur W.A.P ( Weighted Average Pricing s ) indicator is made of four different types of "WAPs". We have added the two common types known as VWAP and TWAP . In addition, we added our two custom types known as CWAP and GWAP . Each is plotted using a fully customizable two-tone color palette represented by Bullish or Bearish. In addition, each WAP has a toggle line-extensions and price labels option.
This indicator has been pre-configured for Day-Trading and Scalping .
• VWAP : Volume Weighted Average Pricing
• TWAP : Time Weighted Average Pricing
• CWAP : Cumulative Weighted Average Pricing
• GWAP : Geometric Weighted Average Pricing
Additional script features allow for fully adjustable settings and configurations:
• Adjustable; Colors
• Adjustable; Resolutions
• Adjustable; Parameters
• Adjustable; Price Labels
• Adjustable; Line Extensions
• Adjustable; Toggles

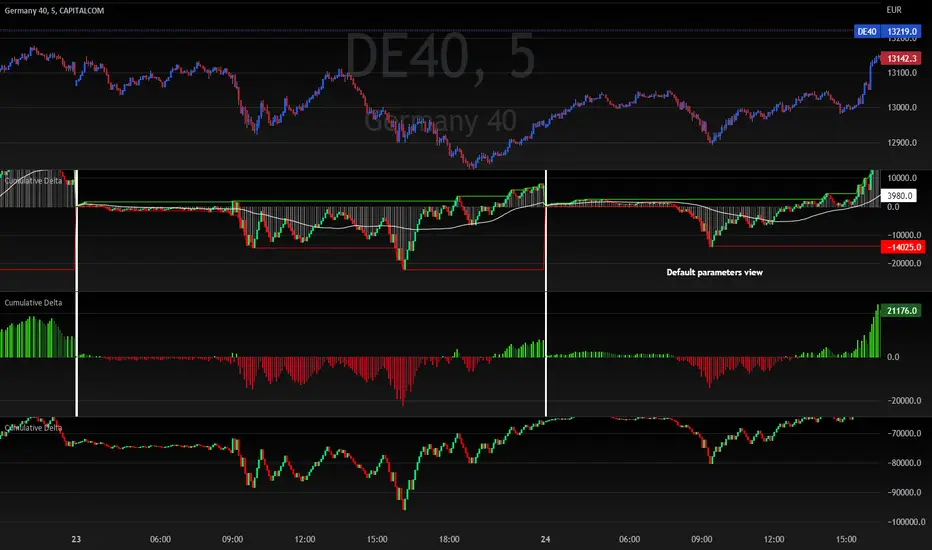
Cumulative DeltaThis scripts calculates the cumulative volume delta within the current day.
Options allow you to change the display type of this data (3 different configurations are given in the chart above)
The following options are available:
Colors selection
Reset cumulative delta everyday (can be disable to keep a continuous calculation of the delta over days)
Show histogram (used to display the delta as a positive/negative histogram)
Show daily High/Low levels (draw highest and lowest delta levels within the day)
Show candles (display the cumulative delta as candles)
Show Moving average (display a moving average which is reseted everyday at the same time as the cumulative delta itself)
Moving average length
This script will be updated if I feel the need to improve things or to add new features
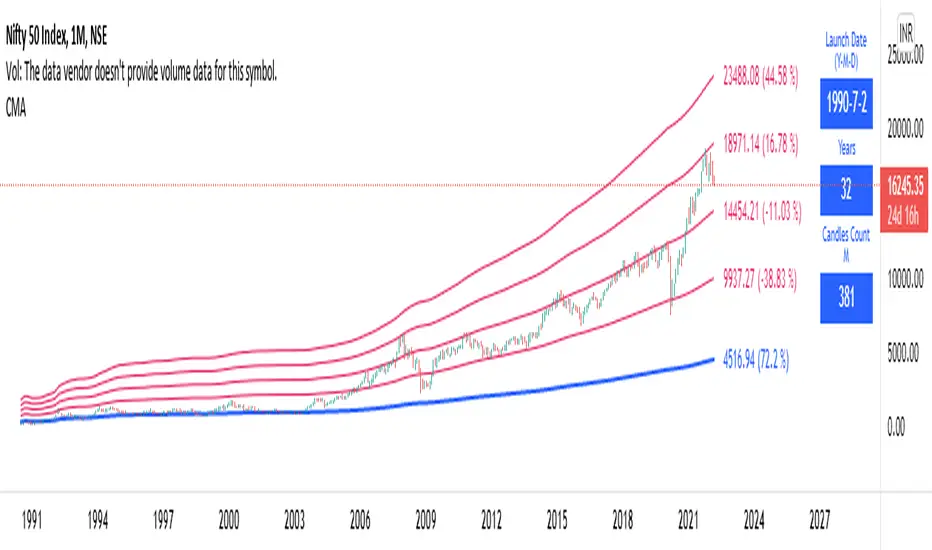
Long Term: Cumulative Moving AverageWho to use?
This indicator is for Long Term Investors or for Position trading and not for Day traders.
What time-frame to use?
• Daily, Weekly or Monthly
What is Blue line?
• Blue line is Cumulative Moving Average. It is cumulative sum of closing price.
• It is a trend reversal level.
• It is a strong support level.
• If price is below Blue line better not to take any Long position until it crosses above it.
What are Red lines?
• Red lines are Multiplier levels.
• These are target levels to exit the position.
• It can be breakout or pull back levels.
• The level combination numbers can be fully odd or even numbers.
• For example in certain stocks the working levels will be 1x, 3x, 5x etc., in others it will be even numbers like 2x, 4x, 6x etc.
• In some cases the levels need to be tweaked with custom decimals like 1.1x, 2.1x, 3.1x, 4.1x etc. to align the support & resistance levels.
How to use?
Entry
• Enter when the Price reach closer to the Blue line.
• Enter Long when the Price takes a pullback or breakout at the Red lines.
Exit
• Exit position when the Price reach closer to the Red lines in Long positions.
Indicator Menu
• Works only in higher time-frames like D, W & M.
• Will not work in Lower time-frames less than "D" or the Launch Date shows wrong in Lower time-frames.
Multipliers:
(Read above What are Red lines?)
Launch Date:
• Launch Date: Starting date of stock when it appeared in the exchange. Works only in D, W & M timeframes.
• Years: Total number of years from the Launch Date. Accurate date will be shown in Daily timeframe.
• Candles Count: Total number of candles from the Launch Date in the current timeframe.
Labels:
• First number is last traded price.
• Second number in () is percentage change from last traded price to that level.
Dollar Weighted Cumulative SPY Sectors VolumeThis plots the combined volume of the subsectors of the SPY using (open+close)/2, both per bar (narrow candles) and cumulative (wide faded candles).
This aims to use dollar volume and weights each sector individually in dollar amounts. NOT with the weighting used in the SPY index. This indicator is NOT equally weighted., it is weighted according to each subsector's own dollar volume.
Green lines means there is more money flowing into the subsectors combined than out. This is a breadth indicator.
Green and red crosses indicate divergence.
Green crosses are shown when the SPY is outperforming this indicator.
Red crosses are shown when this indicator is outperforming the SPY.
Perhaps the best use of this indicator is to stop you from being aggressive when the whole market isn't moving with you.
Enjoy! Feel free to ask any questions.

+ Rate of ChangeNOTE!* If you were using my previous + Rate of Change (and OBV) indicator, I will not be updating that. OBV was moved to my + Breadth & Volume indicator.
This indicator here is basically and updated version of the old indicator, without OBV.
The Rate of Change, or RoC, is a momentum indicator that measures the percentage change in price between the current period and the price n periods ago.
It oscillates above and below a zeroline, basically showing positive or negative momentum.
I applied the OBV's calculation to it, but without the inclusion of volume (also added a lookback period) to see what would happen. I rather liked the result.
I call this the "Cumulative Rate of Change." I only recently realized that this is actually just the OBV without volume, however the OBV does not have a lookback period, and this indicator does.
Doing some more fiddling, I realized that removing both the signum and the volume from the calculation gets you basically a price chart, but calculated as the change in price over n periods. I'm leaving this in because maybe someone discovers they really like having a line chart with moving averages or some other indicator on it to leave their main chart indicator free (giving a more clear look at price action). Can't hurt, right?
Default lookback is set to 1, but play with longer settings (especially if using the traditional RoC, which is by default in TV set to 10, and is nigh on useless at 1--I like 13).
Default source is set to each candle close, but give ohlc4 a look. It smooths out the indicator a bit, and because it's an average of the open, high, low, and close it should give a better idea of what price in general is doing.
Moving averages, Bollinger Bands, Donchian Channels, candle coloring and alerts are my usual additions.
Below are some comparison images of the different indicators wrapped up in here.
Comparison of Cumulative Rate of Change with two different sources. Lookback set to 1.
Cumulative Rate of Change as a price chart, essentially.
And, lastly, the traditional Rate of Change indicator.

+ Balance of PowerThe Balance of Power is an indicator that measures the strength of buyers versus that of sellers in the market, and needs to be smoothed by a moving average to be of much practical use (come to think of it, most indicators are smoothed by a moving average; this is why the RSI lookback mostly commonly used is 14, and not 1, but I digress...). I suppose it is possible to use it without smoothing, but that would be very difficult I think.
The oscillator pivots around a center line, and as with most indicators like this, above 0 is generally considered bullish in a bullish trend, and vice versa in a downtrend.
It can be good for spotting divergences (moreso with smaller lookback periods than I like).
To wit, you might be wondering why I have the default lookback period set at such a large number. My only answer I can give is that I prefer it that way.
The indicator is quite choppy, even when smoothed. The long period helps me to make beter sense of the data (smooth it with a Hull or Jurik MA and you get a different story, though).
In my version of this indicator I provide a pretty broad selection of moving averages with which one may choose to smooth out the BOP, as well as an EMA provided to use as a sort of signal line for trade entries and/or exits, taking partial profits, scaling into a position, etc.
I've also added the option for a second BOP, which is on by default. I think you might find the results interesting by pairing differently smoothed BOPs together.
Of course, you don't have to use both. In the case of the default settings you might look at the EMA-BOP crossing the JMA-BOP as an opportunity to look into exiting or entering trades.
Candle coloring is, as usual, included. I'd say I kind of overdid it here, but that seems to be my style. I just couldn't deal with the fact that with the indicator set to cumulative modes there is no zero line, therefor the color of the indicator plot and the candle coloring would not match the color swatches for bullish/bearish colors. So, there are selections for cumulative indicator/candle colors, and standard indicator/candle colors. Donchian Channels obviously doesn't matter because the colors of things are based on the channel only.
I've added Donchian channel bands (which I've begun adding to many of my indicators), and all necessary alerts as well.
The Donchian Channels can be a really effective tool for entering and exiting trades. I haven't mentioned it in my other indicators that have it, so I will here:
The outermost edge of the band is that which references the indicator for where it is plotted, and the inner channel is sort of dragged along, creating the band
It's a simple mathematical calculation that TradingView actually provided themselves in their manual for pinescript.
When the BOP (or any other indicator using this) enters the band and then exits that could be an indication that price may be reversing, this the bands themselves act, or rather, show a current area of support/resistance for the BOP plot.
One thing that I did with it that they did not, is give the user the ability to change the width of the band. It can only go so narrow, obviously, but anywhere from three (quite wide) to eight is probably sufficient.
I've also provided the option of plotting the BOP as a cumulative line (like OBV), making it no longer an indicator which oscillates around a central pivot.
Because the balance of power is plotted as an accumulation, you may actually want to set the lookback to 1 (it works because it's not an oscillator then).
If you wish to smooth the noise, I suspect a low number would be acceptable here, but it's not necessary.
Oh, and lastly (almost forgot, as this was a late addition), I've added options for the BOPs calculated with volume as well. Gives a different bit of a perspective on the market, versus the traditional version which does not include volume. Screenshots below.
The above image is the balance of power calculated with volume. You can see the obvious difference versus the traditional indicator, where price is in a downtrend and you'd want to sell the orange.
Cumulative version. Looks a lot like OBV.
Cumulative version with volume.

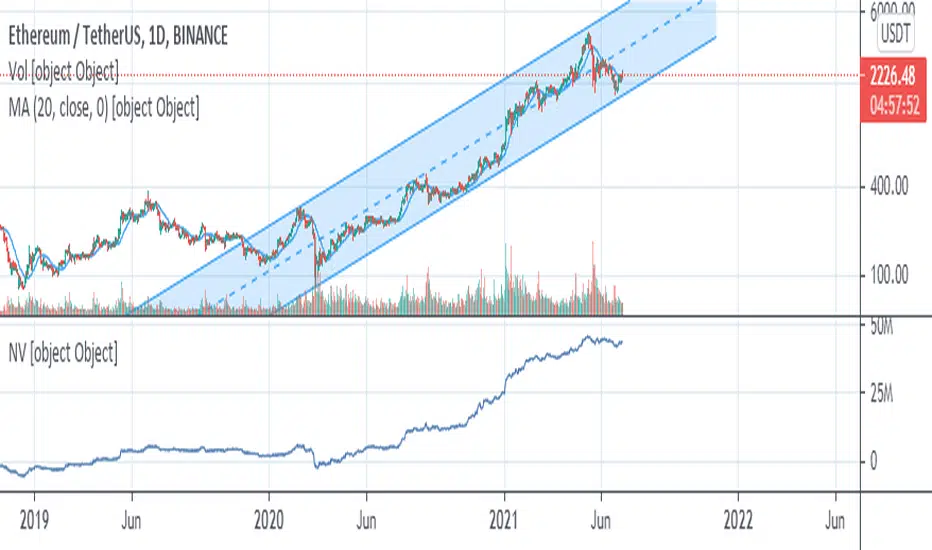
Net VolumeNet Volume, or NV in short, is a cumulative volume indicator similar to OBV and A/D. Though it might look similar to these two indicators (especially A/D), rest assured it's better and more accurate than both. What it basically does, is dividing the volume session into buyers and sellers volumes; then subtracts former from the latter and adds the result to previous session's net volume (In the script, these two intermediate volumes are not calculated and only the subtraction is formulated in an integrated form).
Another important difference between NV and A/D indicator, is that it brings price gaps into account. That's why it requires next session's open price to calculate current session's NV. What it actually mean is that the price gap, in either direction, is the result of the traders' efforts in respective direction in previous session, as if the current session closes where next session opens.
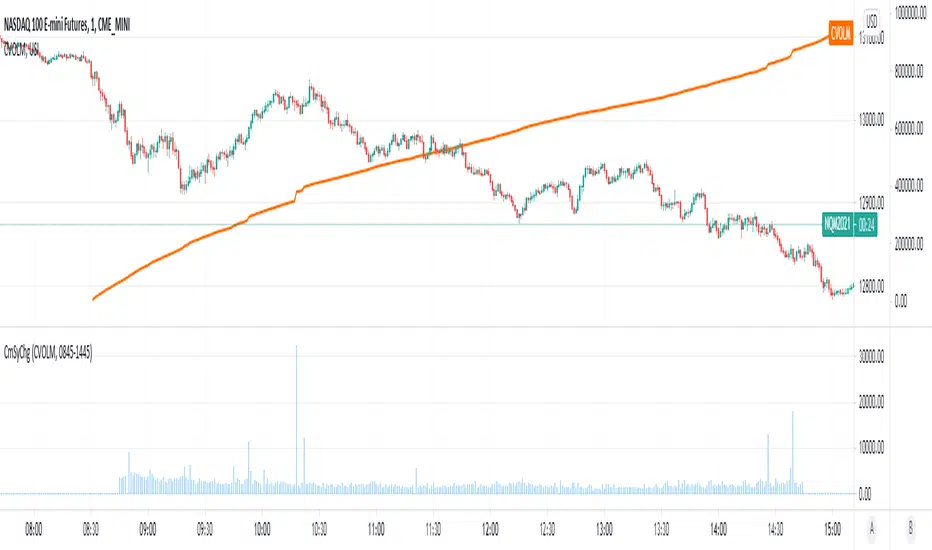
Cumulative Symbol ChangeSome symbols in trading view are cumulative - meaning they increment continuously throughout the trading day and are reset to 0 at the new trading day.
For example USI:CVOLM (Call Volume in Miami).
This script subtracts the current cumulative value from the prior cumulative value, so the change/delta in the cumulative value can be determined bar-by-bar.
Cumulative Volume DeltaCumulative Delta Volume is one of the key analysis in figuring out the Volume Price Action dependencies
Its very Intuitive in nature,
The below image shows how it is computed!
Enjoy

[co.n.g] - Simple CVD over MAThis Single Volume Delta (SVD), respectively Cumulative Volume Delta (CVD) is a really simple script computing the difference of the volume of the actual in comparison the the volume of the "Calculation Bars Threshold", calculated by smoothing through a simple moving average - the "CVD MA Smoothing".
Therefore, if the "Calculation Bars Threshold" and the "CVD MA Smoothing" are set to 1, the script will display the difference of the actual compared to the previous candle;
furthermore, if the "Calculation Bars Threshold" is set to 3 and the "CVD MA Smoothing" is set to 14, then the indicator will display the the summed difference of the past 3 values, smoothed over a period of 14 candles.
This indicator may also be set to a different time frame, allowing multi time frame analysis; f.e. if you're going to set a lower time frame than the actual, the deltas of the lower time frame will be displayed and will be showing the volume trend of the lower time frame; if you're going to set a higher time frame, this is respectively working as described.
To understand volume and price action, it is - imho - especially helpful to display the volume of higher time frames to visualize the "Where the heck am I and what are the big players doing?"
This indicator is coloring the histogram in green as positive, red as negative and gray as indecisive CVD.
Hopefully, this will be helpful in your VSA and your trading decisions.
Cheers,
Constantine
p.s.: I am also working on a far more sophisticated version of SVD/CVD, so stay tuned!

Cumulative Volume AverageHey traders!
I've received dozens of requests for this style of Cumulative Volume indicator over the past year since I released my RVOL By Time and standard RVOL indicators.
After studying Pine Script deeply and using a bit of old fashioned trial and error over the past few months, I finally got it to work!
This script adds up the cumulative volume throughout any given trading day (the blue & green volume bars) on any given intraday timeframe on any given market - and then it compares that cumulative volume value to the total volume of the previous day AND the average cumulative volume of the previous X days for whatever time of day the current bar is printing on.
By default it compares today's cumulative volume to yesterday's, but you can set the Lookback higher in the settings menu if desired.
It even takes into consideration random gaps in price action (unlike my RVOL By Time indicator) – so as far as I can tell, it’s as accurate as I can possibly make it.
However it does not work on extended hours for stocks so don’t use it if you have pre-market hours enabled. And there is an inbuilt limitation to how many bars a script can reference on TradingView, so on 5-minute timeframes and lower your Lookback period will be limited and may crash the script if you set it too high.
The PURPLE LINE is the total volume of the previous day.
The GRAY COLUMN is the average cumulative volume of the previous X days.
The COLORED COLUMN is the current cumulative volume for the current bar.
The BLACK LINE is the Previous Cumulative Volume Line which represents the average cumulative volume for the past X days. It only draws if today’s CV exceeds the average – this is useful for comparing exactly how far today’s cumulative volume exceeds the average, but it can be turned off in the Style menu if you don't want it there.
The ORANGE NUMBER is the ratio of today's CV compared to the average (CV ÷ Average CV).
If the current cumulative volume is less than the previous day's cumulative volume for that time of day, the bar is blue.
If the current cumulative volume is greater than the previous day's cumulative volume for that time of day, the bar is dark green.
If the current cumulative volume is greater than the previous day's total volume, the bar is bright green.
This script also comes with alert functionality.
You can set a Cumulative Volume Alert which will trigger an alert if the current bar's cumulative volume exceeds the average cumulative volume for that time of day.
You can also set a Total Cumulative Volume Alert which will trigger an alert only if the current bar's cumulative volume exceeds the total volume of the previous day.
And you can set a CV Ratio Alert which will trigger an alert if today's CV ÷ Average CV >= Specified Ratio.
Apart from that, the script is fairly self-explanatory so I hope you enjoy using it!
Check my signature for a link to the source code + all my other indicators.
Good luck with your trading, and feel free to drop any suggestions or bug reports and I'll do my best to help out :)
Kind regards,
Matthew

Cumulative Volume Ratio v1.0Simple.
NYSE only.
0700am-1200pm only.
5 minute candles only.
The code compares the cumulative volume of the current day to the 20 day cumulative average up to that same point in time.
This is commonly referenced as the Zanger Ratio.
The colors are based on the that version.
Below 60 = drying up (grey)
Above 60 = below average (orange)
Above 80 = average (pink)
Above 120 = High (magenta)
Above 200 = Extreme (red)
I purposely have these bars slightly transparent so we can quickly identify this indicator apart from my Specific Bar Volume Ratio or other bar based indicator.
This example is in Central time.
Contact me if you are interested.

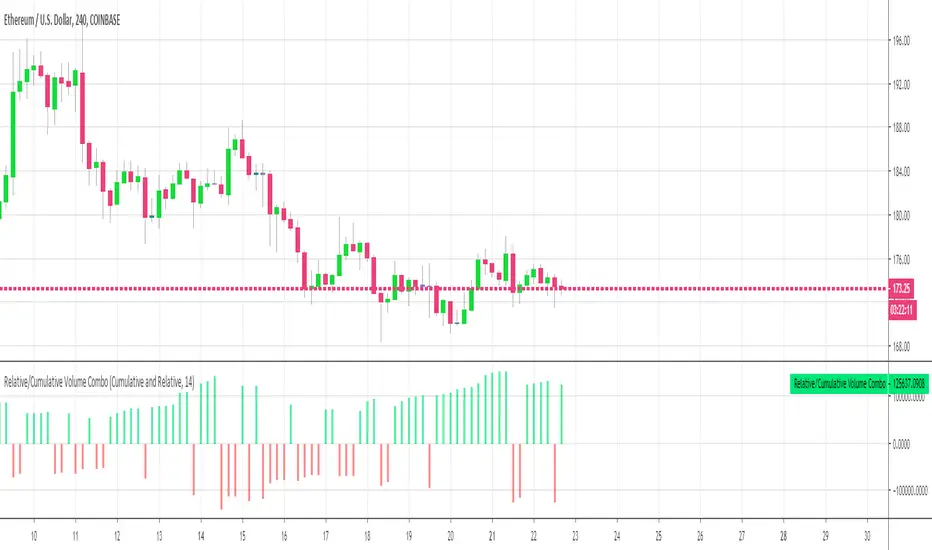
Relative Volume Combined With a Cumulative FunctionHi everyone
The today's script was suggested by a follower.
--------------------------------------
1 minute of Knowledge
--------------------------------------
Many traders look at volume as a pre-signal that a move may happen.
In trading, some say that "the volume precedes the movement".
This simply means that often volume will increase before a significant move in the stock.
Imagine if a unique trader is buying a crypto/stock. The volume is unlikely to move.
But, if all the mass goes to mass spot buy an asset, then we could see a volume spike announcing a potential upwards move.
---------------------------------------------
What's the story with that indicator?
---------------------------------------------
It's an interesting way of presenting the volume data.
Will show the total volume for the selected period.
You can choose between relative and cumulative presentation.
The users can display the consecutive rising volume above the 0 line and the failing volume below that line.
--------------------------------------
Mix knowledge with usefulness
--------------------------------------
A price making a higher/high (HH) or lower/low (LL) has a real and strong meaning- a HH or LL on a volume has a significant meaning also.
Increasing volume for a stock/crypto, could signify that buyers were willing to purchase a bigger number of shares at a higher price (comparatively to the day before)
Obviously, non-stop crazy buying/shorting won't work at some point - and that "some point" may hurt a bit.
Such volume indicator combined with others like momentum or strength indicators is a nice trading strategy.
The volume announces that a move may happen and the other indicators will confirm the prophecy :)
Peace
Dave
L&S Cumulative Volume Delta L&S Cumulative Volume Delta
All you need to know @ longandshort.io
Team L&S
longandshort.io
Intraday Cumulative VolumeThis script allows to calculate the cumulative volume during the intraday session. Let's just define the start and the end time of the day you want the cumulated volume to be calculated within and you'll be good to go! You can also define two thresholds (min and max) where to plot it on a different color. For my strategy, I find it very useful for calculating the pre-market volume since I need to see enough (but not too much) interest on a stock for trusting it after the bell rings. I place it in the same panel where I display the actual volume, so that no extra space on my layout needs to be allocated to this one indicator. I hope you'll be finding it useful too!

Cumulative Weekdays VolumesHello traders!
This indicator shows you cumulative weekdays' volumes across the instrument history.
What is included
An option to start calculations from specific date
It works on ANY instrument that has available volume data.
It works on all resolutions
I attached some screenshots to show you how it works with other instruments.
Good luck and happy trading!

Cumulative Price Change %Tracking cumulative percentage change in price for each candle over a period.

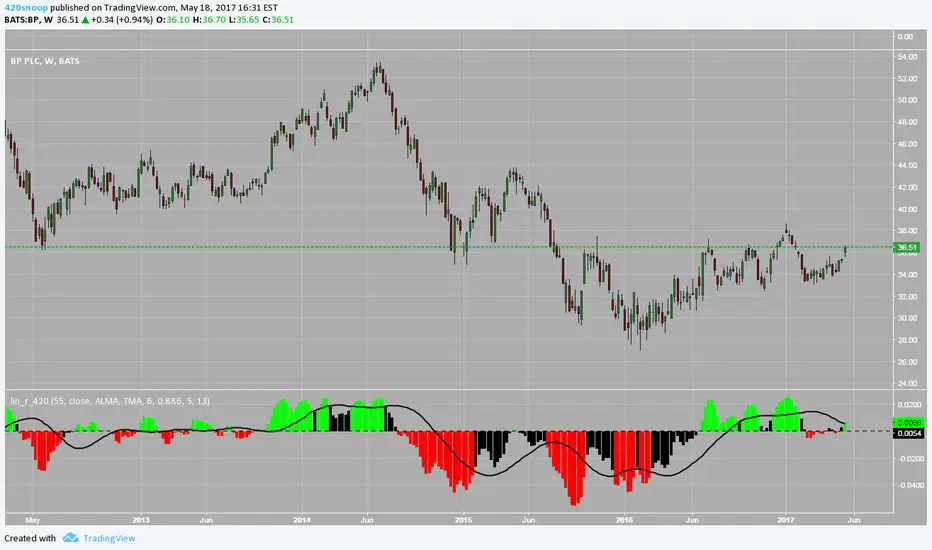
lin.reg.s_420Hey all,
Snoop here with another script this one is linear regression slope analysis;
I used a base skeleton script of /u/ucsgears before adding some other cumulative log filtering and average customization functions I like :)
If you have success with this script feel free to buy me a coffee through my bitcoin address :)
Appreciate the love I get from the community! Thanks all and happy trading!
-Snoop
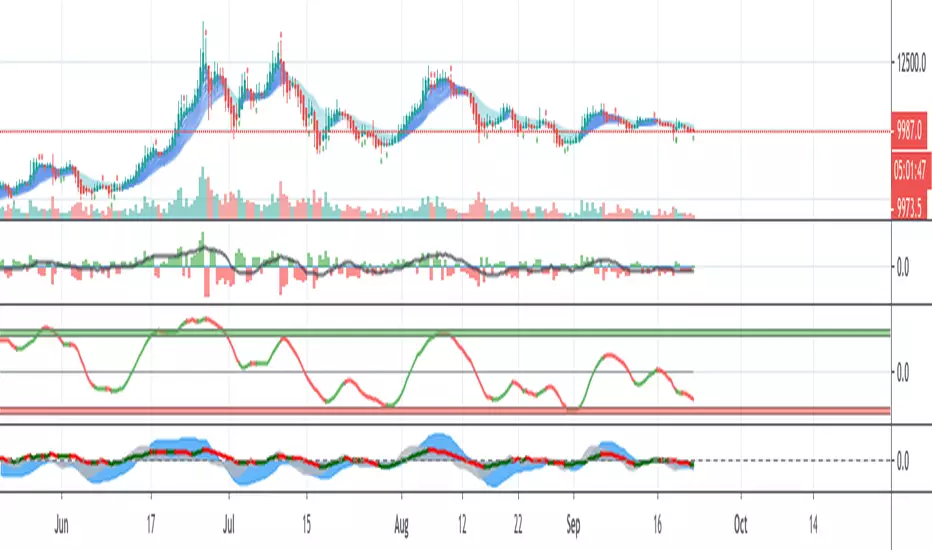
Osc_420Hey all;
Been a while since I posted anything that didnt require approval to use -- so here is one that I really like
I call it 420_osc
essentially it is a volume weighted moving average cross that also take into account some log() filtering and some other cumulative summing
This also has a BBand shrinkage indicator (blue crosses at bottom) to see when the b bands are shrinking and 'explosive movements' are possible in the future.
I use this along side with another script I have yet to publish called 'Volume_Master' which I may release soon -- or not ;) to find confluence signals for anything from crypto to commodities to forex to stocks!
Anyways this script is highly modular and can do more than just VWMA, it can do HullMa, ALMA, TEMA, DEMA, LSMA, and many others as well!
Beware that sometimes if you are using a ticker with bad volume data etc your results may vary.
Enjoy and if you have success feel free to share the love and donate to the coding cause at my btc address shown in my profile
--

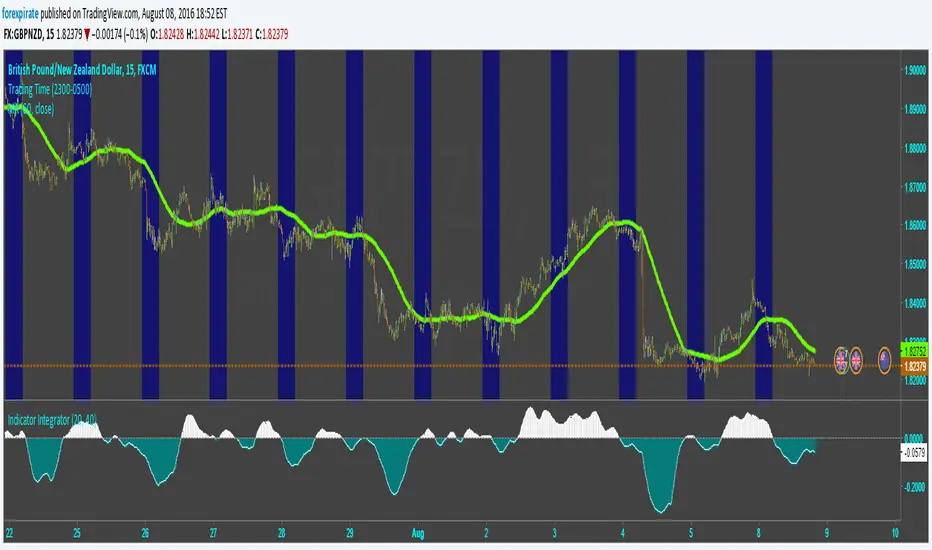
Indicator IntegratorHere is a light piece of code, The Indicator Integrator. It sums up a function (like an integral for you calculus folks). Unlike the 'cum' function that does a million bars of look back you can change the look back period, like limits of integration.
Built in is a difference of the close from an SMA. And there is an ROC. By changing what is summed up in the loop you can sum up the differences from the SMA or sum up the ROC. Pick your SMA length/ROC length. Then pick your look back period of how much to add up (bars to add up). There is a built in SMA smoother of three bars on the final summation.
Comments welcomed
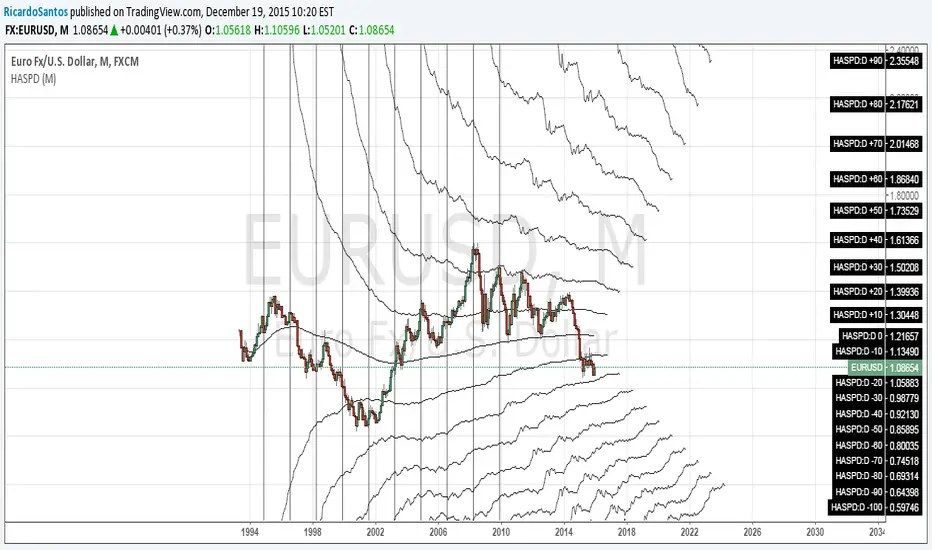
[RS]Cumulative Average Price Gridgrid based on the cumulative average price.
on a sidenote: looks like im baned from chat for a week.
