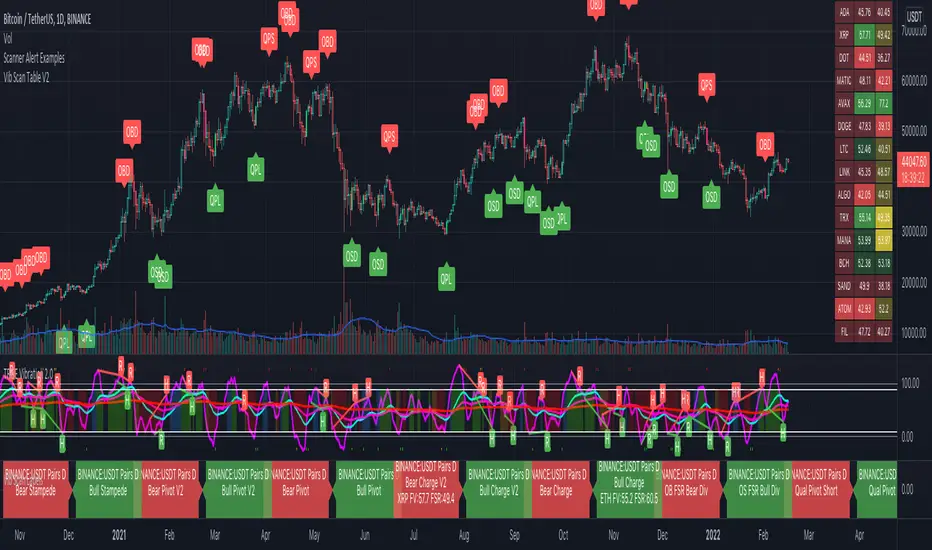
Scanner Alert ExamplesThis is a visual representation of the alerts built into the Vib Scanner Table (right side of main panel) and Vib Scanner Labels (bottom most panel) that are based on Mr. A's TrueVibration (other lower panel). Instead of a table or scanner labels, this indicator will print labels direction under/over candles identifying where the scanners will trigger alert, but this script only looks at a single asset. You can use this script to see how various settings play out across an asset's entire history and fine tune your scanner settings to your likings.
All of the alerts are coded the exact same way across all 3 of these:
Qualified pivots longs trigger with a "potential pivot long" occurs with a higher local low compared to the last time SmoothVib was under 30. Qualified shorts require the potential pivot short occur at a lower local high than the last time SmoothVib was over 70. As with the table, there is the option to choose to either require a Full Reset (SmoothVib goes all the way to the other extreme first) or just a partial reset (SmoothVib only comes out of OB/OS territory and back into it).
Overbought/Oversold FSR Divergences look for regular and hidden divergences in the FSR while it is in overbought or oversold territory.
Charge V1 Bull Alert is triggered when Full Vib is over the Full Vib Bull Threshold and FSR crosses over the Full Vib. Bear alert is Full Vib below Full Vib Bull Threshold and FSR crosses below Full Vib.
Charge V2 uses a "most recent DBI" filter and will trigger an alert any time the FSR crosses the Full Vibration and is in agreement with the most recent DBI .
Pivots V1 Bull Alert is triggered when Full Vib is over the Full Vib Bull Threshold and FSR pivots above the Full Vib. Bear Pivots are the opposite of this.
Pivots V2 look for similar FSR pivots , but with a Leading/Lagging Full Vib comparison. Bull Alerts require Leading Full to be above Lagging Full and the FSR to pivot on top of both. Bear pivots are the exact opposite.
Bull and Bear Stampede's look for FSR crossing over 120 or under -20, respectively, and indicate EXTREME momentum.
Please note: these alerts are my extensions of the TrueVibration indicator and concepts by TrueCrypto28, aka Mr. A. HUGE thank you to him for all his incredible work!
While these scanners can be used as standalone to some extent, an understanding of TrueVibration will take them to another level.
Cryptotrading
Vib Scanner LabelsVib Scanner Labels (bottom most panel) is an alternate option for the Vib Scanner Table (seen on right side of main chart area). Instead of a table that only sends alerts on bar close, this will print labels identifying any asset that is meeting the chosen alert criteria IN REAL TIME, though the alerts will still only trigger on bar close. It can be useful if you want to get an early eye on assets that may trigger an alert in the very near future.
Please note: these alerts are my extensions of the TrueVibration indicator and concepts by TrueCrypto28 Mr. A (TrueCrypto28). HUGE thank you to him for all his incredible work!
I've inset a pared down version of it in the main chart image here for some clarity. The TrueVibration indicator is still driving the candle colors in this chart image.
While these scanners can be used as standalone to some extent, an understanding of TrueVibration will take them to another level.
Two other indicators go hand in hand with this:
The "Vib Scanner Table" (again, seen on the right side of the main panel) will display all scanned assets in a table with momentum readings colored for various reasons explained in that indicator detail. All of the alerts are identical.
"Scanner Alert Examples" (labels displayed directly under/over candles) will display labels directly on the chart you're looking at, see the results across an asset's entire history, and can tweak the scanner settings to your liking.
All of the alerts are coded the exact same way across all 3 of these:
Qualified pivots longs trigger with a "potential pivot long" occurs with a higher local low compared to the last time SmoothVib was under 30. Qualified shorts require the potential pivot short occur at a lower local high than the last time SmoothVib was over 70. As with the table, there is the option to choose to either require a Full Reset (SmoothVib goes all the way to the other extreme first) or just a partial reset (SmoothVib only comes out of OB/OS territory and back into it).
Overbought/Oversold FSR Divergences look for regular and hidden divergences in the FSR while it is in overbought or oversold territory.
Charge V1 Bull Alert is triggered when Full Vib is over the Full Vib Bull Threshold and FSR crosses over the Full Vib. Bear alert is Full Vib below Full Vib Bull Threshold and FSR crosses below Full Vib.
Charge V2 uses a "most recent DBI" filter and will trigger an alert any time the FSR crosses the Full Vibration and is in agreement with the most recent DBI .
Pivots V1 Bull Alert is triggered when Full Vib is over the Full Vib Bull Threshold and FSR pivots above the Full Vib. Bear Pivots are the opposite of this.
Pivots V2 look for similar FSR pivots , but with a Leading/Lagging Full Vib comparison. Bull Alerts require Leading Full to be above Lagging Full and the FSR to pivot on top of both. Bear pivots are the exact opposite.
Bull and Bear Stampede's look for FSR crossing over 120 or under -20, respectively, and indicate EXTREME momentum.

CRC.i Bollinger Bands ®This script is yet another variant of the famous Bollinger Bands® TA tool used to track price volatility as it deviates from the mean of a security using standard deviations (positive &negative). Built for my own personal preferences. But perhaps you might like it, too.
Includes
+ Chart Lines: price, upper and lower bands
+ User Options: SMA length, stdev value
+ Heads up Display (HUD) with TARGET's and other related stats
Bugs? Comments? Requests? Ping me @calmrat

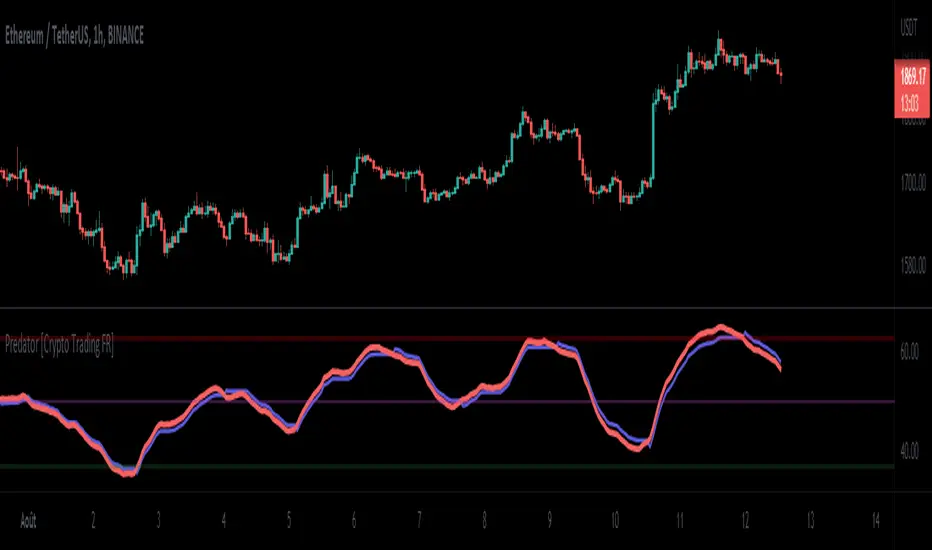
Predator [Crypto Trading FR]The Predator indicator is an oscillation indicator based on a complex mathematical equation that draws two lines, a fast and a slow one. Having two oscillating lines allows for crossovers between fast and slow lines, which can be used as confirmation of a slight trend bias.
Another advantage of the Predator indicator is the 50% Line. This could be added as another filter for trading rules. Having the lines above the 50% Predator line indicates that the price is on an uptrend while the lines below the 50% line indicates that the price is on a downtrend.
In this way, the algorithm can serve as a trend filter. For example, long trades can only be taken when values are above 50, while short trades require values below 50.
When the Predator line (orange) crosses above the slow trailing line, it indicates short-term momentum is to the upside, and long trades may be taken. Conversely, when the smoothed RSI crosses below the slow trailing line, short-term momentum is to the downside, and shorts may be more appropriate.
The indicator rarely generates false alarms and has virtually no lag, which makes it invulnerable both during periods of increased volatility and during flats with wide amplitude. Larger timeframes deserve special attention, as you can catch a very strong movement.
Summarizing, we should note that the Predator indicator does not raise any problems, it can be useful for both the beginners who just set foot on the way to learn trading and experienced traders as an additional method or as a signal module.
Relative Strength Index + Candle coloringRelative Strength Index (RSI)
>The Relative Strength Index (RSI), developed by J. Welles Wilder, is a momentum oscillator that measures the speed and change of price movements. The RSI oscillates between zero and 100.
>Traditionally the RSI is considered overbought when above 70 and oversold when below 30. But blindly selling at 70 and buying at 30 is a bad idea because price can make very low movement while oscillator makes large moves and vice versa.
>In RSI Signals can be generated by looking for divergences and failure swings. RSI can also be used to identify the general trend.
>Calculation
The RSI is a fairly simple formula, The basic formula is:
RSI = 100 –
>In this script I have used the standard 14 period RSI and added candle coloring feature, I used two other periods other than 14 to determine the major trend and use the position of 14 period RSI relative to other 2 periods to color the candle.
>color reference, what they represent :
>also look out for divergences, its not included in this script will provide in next updates, divergence are HH on price but LH on RSI, LL on price but LH on RSI, easy to identify. the best divergences are often easy to find they occur within next 5-10 candles, do not overcomplicate when it doesn't exist.
How to use this candle coloring:
>best during major trends.
>not best for mean reversion plays.
>use it as an addition to your system.

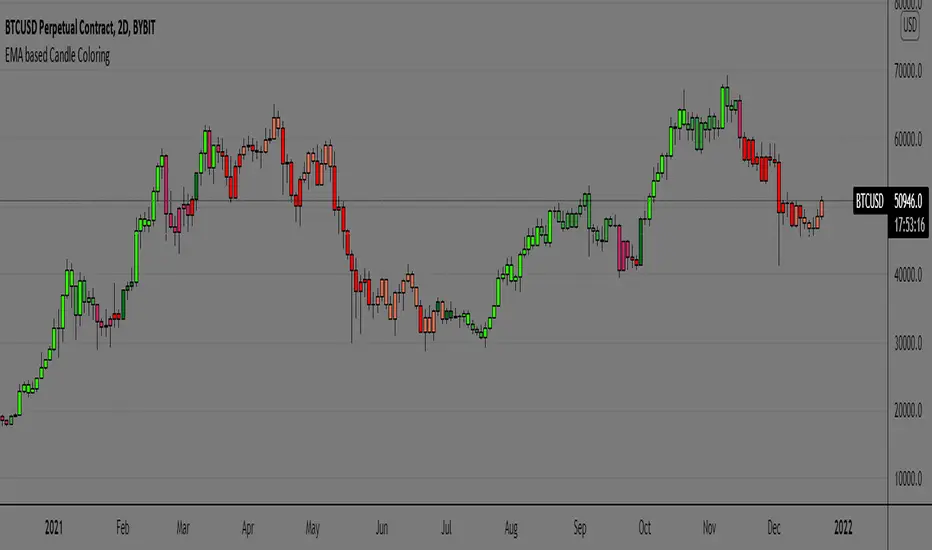
EMA based Candle ColoringEMA or Exponential Moving Average (EMA) is a technical indicator used in trading practices that shows how the price of an asset or security changes over a certain period of time. The EMA is different from a simple moving average in that it places more weight on recent data points (i.e., recent prices)
In this script plain EMA or MA is not used for candle coloring, but it takes multiple EMAs of the original EMA and then subtracts lag from the result to get data points of each candle of two certain periods defined. As it differs from traditional EMAs and MAs by reacting quicker to price changes and is able to subtract lag with its calculated formula.
The candle coloring is able to interpret short-term price direction and overall trend and its suitable for active traders. As it tracks price more closely than SMAs
Since EMAs can also provide support or resistance for price and is highly reliant on the asset’s lookback period we can make sure we stay with the trend rather than going against the trend.
*First of all here's what the colors represent and how to interpret them is shown in below image
Examples of how I use the Coloring pattern
Spotting a fakeout/stophunt
during trends:
* No strategy is 100% accurate this script is one of those too , traders must use this as an addition to their system rather than making it a standalone system.
* Context is important as the coloring is done using calculations, different timeframes has different context hence traders discretion is key.
Hope you find this helpful,
Thankyou.
happy trading.
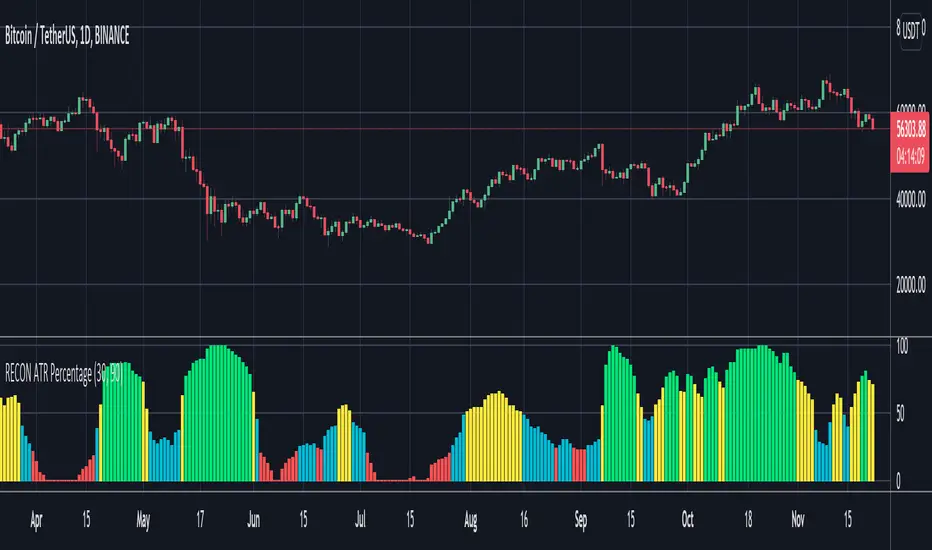
RECON ATR Volatility PercentageThe original Average True Range (ATR) indicator is a technical analysis indicator designed to measure volatility. The higher the ATR the higher the volatility.
The RECON ATR Volatility Percentage indicator calculates the Average True Range (ATR) as a percentage.
Suggested chart timeframes: 1h, 4h and 1D seem to produce the most useful intel but can be used on lower timeframes as well.
The Recon ATR Volatility Percentage can be utilized for identifying trading pairs with a desired amount of volatility, for example deploying a grid trading strategy on pairs that are trending up with a high amount of volatility (say over 50%) might produce desirable results.
It is important to note the ATR does not indicate price direction and can be high in both a rising or falling market.
The ATR Length, Period Look Back Length parameters as well as the color of the columns can be configured per your specifications.
Reversal zone finderThis script would find potential reversal price zones according to RSI over bought or sell condition and big reversal candle.
It works better in range markets and lower time frames like 5M and especially in Support/Resistance zones.
Suit for scalping in forex or crypto markets.
* Use it as a trade assistant not a trade signal!

WhaleCrew Long/Short Ratio (Bitfinex)Shows the long/short ratio (amount of longs per short) on ANY Bitfinex pair (BTCUSD, ETHUSD, ADAUSD, ...).

Six Factors Ichimoku 1.0This strategy has the purpose to help dummies to get experienced when trade with Crypocurrencies, using the Ichimoku indicator
The following script shows an strategy based on Ichimoku indicator. Taking into account the theoretical concepts of the Ichimoku Kinko Hyo, are defined six (6) factors to open position and two (2) factors to close it. According to the author of the book, in which is based the script, it is stablished that the proper combination of the six factors when the timeframe is set in 1D and the assest Cryptocurrencies (not applicable to stable Coins), has demonstrated in the Backtesting good results.
Althoug is not the purpose, the Ichimoku indicator is composed by six components (Tenkan Line, Kijun Line, Senkou Span A, Senkou Span B and Kumo Cloud) and the relative position of the current price of the assest compared with ichimoku components define these factor.
Factors to open position
Factor one. The current price is over the Ichimoku Cloud
Factor two. When Senkou Span A is greater thant Senkou Span B, proyected 22 periods forward.
Factor three. Senkou Span A, has a positive slope, during the previous periods.
Factor four.The Tenkan Line (quick line) is above the Kijun Line (slow line) during the previous periods.
Factor five. The Chikou Span Line is above the Kumo
Factor six. The slope of the sma (200) is positive.
The long entry is recomended when the following expresion is matched
F1 and F2 and F4 and F5 and (F3 or F6)
Factors to close position
Factor one. Tenkan line has a downward trajectory for previous periods. If the price change during this periods the counter reset and start again trying to prevent exit from quick variations.
Factor two. Current price is below Kijun line
The time to close position is recommended when the following expresión occurs
F1 and F2
Some of the features of the script are the following:
Initial amount of investment stablished on 100€, but can be modified by the user.
User can easily modified the period for backtesting purposes.
"Show factors" give the user and easy interface to know the current status of the strategy`s factors. The factors appears color red (false) and color green (true)
It is possible to cancel Factor F5, which is interesting after the assests has dumped strongly. The color black means that F5 is canceled.
Change the output criteria by F1 or F2 (not recommended) but available for learning purposes.
Auxiliary lines that help to idenfify strong resistances that could compromise the strategy
Enjoy it !!!
Miguel A. Calatayud

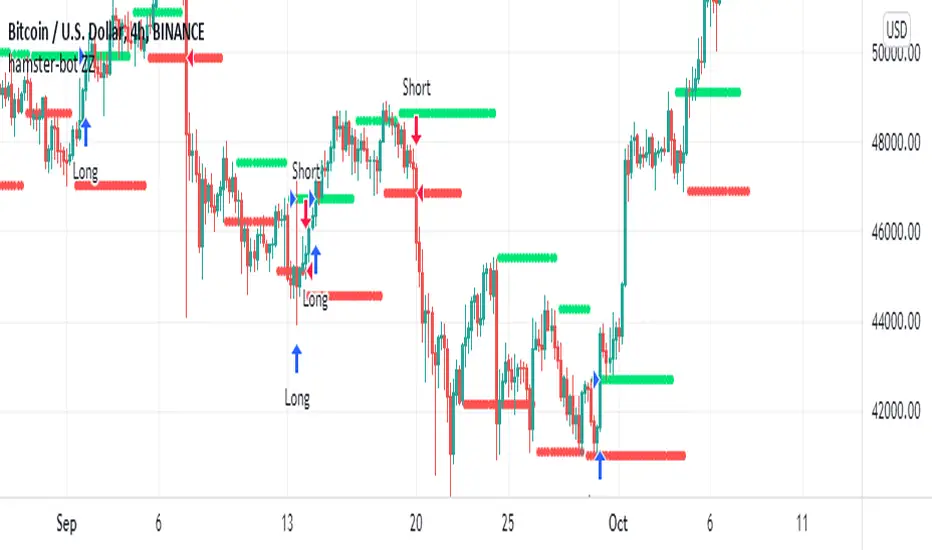
hamster-bot ZZCompilation of various modifications of the trend breakout reversal strategies based on the ZigZag .
Includes past versions of scripts:
version 1 ZZ2 Breakout reversal strategy
version 2 ZZ2 with experimental options hamster-bot ZZ Breakout reversal strategy
version 3 ZZ6 Noro's ZZ-6 by hamster-bot The original script is available here
The original script is available here
Description ZZ6 :
New version of ZZ-strategy.
Repaint?
Normal lines are not redrawn. Dotted lines repaint, but do not affect trading (do not affect backtests). You can turn off repaint in the script settings. Repaint (dotted lines) are needed only for clarity. To make it clear from which bar the level is created.
Levels
Lime lines above - level from a local high bar. To open a long position. Using a market stop order.
Red line at the bottom - the level from a local low bar. To open a short position. Using a market stop order.
Trading
You can trade without short positions. Then the red line is the level for a stop-loss order.
Reverse trading can be used. Without stop-loss orders.
Risk size
Order size depends on the risk size parameter and possible loss. If risk size = 2%, it means that the loss will be no more than 2%.
For crypto
Symbols: XBT/USD, BTC /USD, BTC /USDT, ETH/USD, etc - need USD(T)
Timeframes: 1h, 4h, 1d
This new ZZ strategy includes all the best practices for this strategy. the script has great flexibility of settings.
Instructions for script parameters:
Parameter ZZ Type - is responsible for the basic type of strategy used (usually it is responsible for building levels)
then you will need to configure the settings block corresponding to the selected ZZ type .
At the moment the script contains types: ZZ2 + ZZ6
The rest of the parameters are common for any type of ZZ.
Further development will be done in this script. The above scripts will not be updated.
At the moment the options are already available:
- Take Profit
- Stop Loss
- One entry Long/Short
- Single entry
- Levels offset
- Levels multiplier
- Levels angle
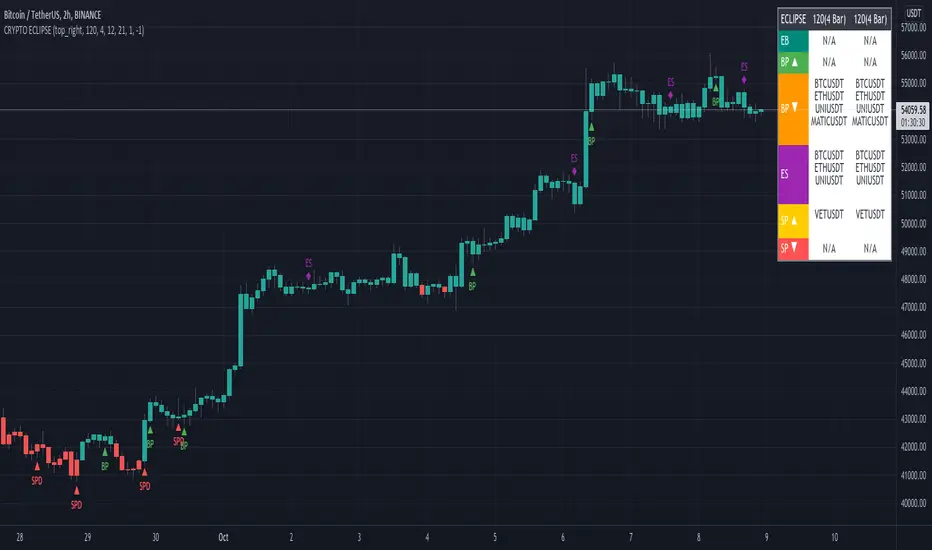
CRYPTO ECLIPSEWelcome to CRYPTO ECLIPSE!
If you see the market as a game between buyers and sellers, CRYPTO ECLIPSE is the EASY MODE.
Don't believe in any word I wrote, but please don't doubt about it until you TEST IT. Just go ahead and take your own conclusions, maybe this script changes your life, like it changed mine.
What would be like if you could see the markets through the eyes of a trader with many years of experience? (and If you are already this trader, you could add this as a live second opnion)
Imagine if you could consistently predcit buyers and sellers actions, attempts and rejections. That's what Price action technical analysis tries, but price action often feels like very subjective and to succeed and learn it, you will probably need at least 4 years of trading, winning and loosing to find consistancy, that's the process. CRYPTO ECLIPSE will show how you will see the market after this years spent, You''ll be skipping this years.
CRYPTO ECLIPSE is a setup that translates the market to you and give you the view of the market as it is, and not only how it was in the past. Differently from almost all other indicators i've seen in my life, CRYPTO ECLIPSE is a setup focused in PREDICT, not REACT. In my opnion that's why indicators not work well, they are too focused in the past, giving late decisions.
Truth be told, it's sounds good, but how do I use it?
I will explain you the main features, what you need to do is: Take some time to learn it, mess with the configs. Until you see the chart as you believe is the best predict scenario for the past, and then just sit and see how it will keep predicting the next moviments. Well, it works for me :)
Why am I renting this setup?
I am not. This is made for you to test for free, and for those who this setup makes all sense, we will build a small comunity around it. Just watch as we go, or Join us.
Before I forget, the setup is also a screener to track the 6 conditions above in the last 1-5 periods.
Main Features description:
BAR COLOR 2 = Strong Buyers domain(Candle's color)
BAR COLOR 3 = Strong Sellers domain(Candle's color)
BAR COLOR 0 e 1 = Fine Tuning(Advanced) There are 3 main ways to use it:
-Standard, following the same 2 and 3 bar colors.
-Changing both 0 and 1 bar colors. You can use Orange or pink or white colors for both 0 and 1, or other any color, try to use one that does not match with green or red for distinction. Consider the 0 and 1 bars as trend changing in course, or the breath of the market before a trend continuation (pullback).
Another option, that's indicated for Professionals only: change bar zero to dark green and 1 to a lighter red. This way you will see the gain and loose game in real time, take some time and you will see dark red going to lighter red will indicate a seller's weakness and the oposite for the buyers. If you are already a PRO, go ahead and play with these 2 options.
BP= STRONG BUYERS DOMAN
BPD= STRONG BUYERS DOMAN DECREASING
SP= STRONG SELLERS DOMAN
SPD= STRONG SELLERS DOMAN DECREASING
EB= POSSIBLE EARLY BUYERS DOMAIN SIGNAL
ES= POSSIBLE EARLY SELLERS DOMAIN SIGNAL
Note that BPD AND SPD are the same as EB and ES, I made this as a double entries so we can combine two different periods. If you look close you'll learn that the periods are related to the range of past periods you want to consider.
IF you pick a low period, it will show more signals, and it willl be more sensitive to the market changes. All the signals are real things that happened there, you will see that there was always a pullback or a consolidation, since this is very sensitive it's better to traders who want what's happening all the time
If you pick a high period, it will show less signals and with significant and strong movement, there are no guesses in this signals, if it did not proceed with a strong moviment, the opposite forces rejected their attempt.
Fit to your market point of view: Mess with the period numbers until you see the signals(arrows) where you understand is the best place to take a trade in the past, and watch it repeat the alert for you in the future, same as bar colors.
Note: If you want to enter only with big movements signals, use Stronger signals and high periods. if you want to try to get the movement begin, go with the early signals, using short periods.
Play with the configs until the chart give you the confidence you want to have to trade your money.
I don't recomend to use it with many indicators, if you add more than one indicator with this, you are probably insecure, and this will be useless to you.
But go ahead and add a trend indicator, if you are a trend trader or a oscillator, if you are a oscillator guy... Whatever you need until you feel confident.
Alway remember, this is only a tool. it's your decision, this is not a buy/sell indicator (maybe in the future), this is a tool to read the market. Always trade SPOT never FUTURES, always keep your stop loss as close as you can.
Enjoy the ECLIPSE
COIN FX PRO TRADERCoin Fx Pro strategy makes the cryptocurrency markets buy and sell automatically. 5 stoploss, fixed profit take and stoploss level can be customized from strategy settings. There are 4 separate strategies that you can set in the strategy. First of them, there are strategies that decide long and short positions in accordance with your settings at the pivot levels, second of the super trend, third of the potential return levels, third of the up and down breaks. Pyramiding can offer multiple entry points. Strategy back tests can be adjusted to the desired time period and can be used as spot or term if desired. Frostybot is set to work fully compatible with js when the necessary inputs are made from these strategy settings. When installing an alarm for FROSTYBOT JS, the alarm message field is {{strategy.order.alert_message}}.
For best back test performance results. Use it
BTCUSDTP and 5 MIN TIME FRAME!!!

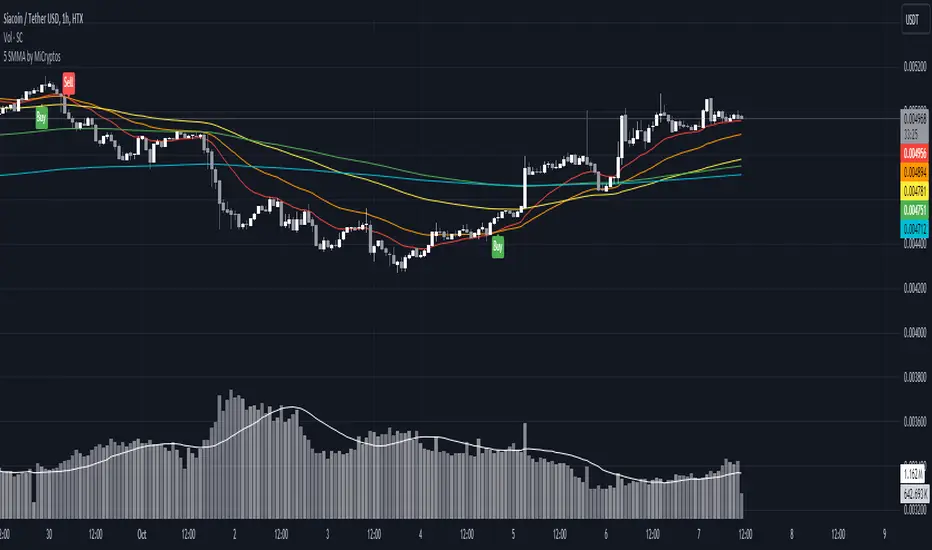
5 SMMA - by MiCryptoGives you the 5 most common SMMA for crypto in day trading:
- 10
- 21
- 50
- 100
- 200
This can be configured as you want.
Hope this can help you to get more indicators in a free plan.
RaBot V1.0.0Rabot is an indicator for new users as well as experienced users.
This indicator tries to predict both buy and sell signals. You can configure it for both scalping and swing trading.
It has two modes, one more "conservative", where the number of entries will be less than the other "greedy" mode.
Based on the famous and complex indicator "Koncorde" that combines both trend and volume knowing the manipulation of strong and weak hands, patterns, and crossing of emas customized by us; for example: a buy signal in conservative mode will only open if the trend is bullish and vice versa.
The user can configure the way they like by opening many positions or few but more secure based on their trading style.
The indicator also has the option to configure which chart we want to obtain the trend from, this is to avoid perhaps opening shorts in a very bullish trend line for example.
Rabot is a fairly complex indicator, which can be used for automatic use of inputs and outputs, as well as manual.
You also have the option of NOT opening a position if there is one currently open, and the option for the next signal to be the opposite of the last one.
5TPs, 1SL, and Breakeven after take profit achieved.
Finally version 1.0.0 is now available! :)
This version does not have backtesting (we have another that yes)
We are continuously working, testing and updating bugs and improvements.
Do not hesitate to get in touch for a feedback, it will be welcome and we will take it into account.

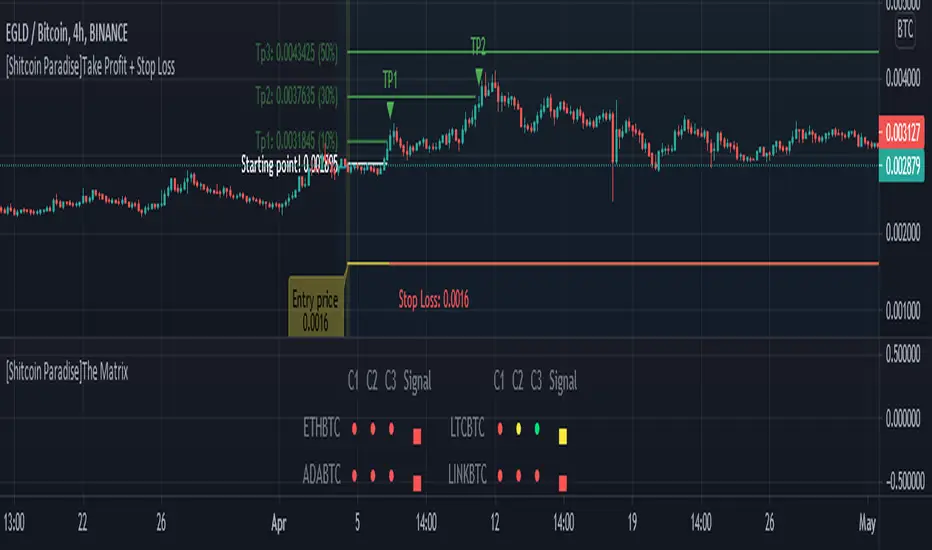
[Shitcoin Paradise]Take Profit + Stop LossThe Take profit + Stop loss indicator is built around The Matrix strategy , it is not suitable for anything else!
*Use it only on 4h charts*
How to use it:
- when a setup from The Matrix is ready, set the date and hour when that setup happened
- set the entry price
- set the targets (you can use the default ones)
- for conservative trading, check the "Use only one TP?" box
- set alert messages for every event
When the price reached the first TP, the stop loss will automatically be moved at entry price, yellow line (entry price) become red(stop loss).
The indicator can be set to have 3 take profits (it takes longer to finish a trade, the reward is greater, but also the risk is bigger), or the conservative way, with only one take profit.
The Take profit + Stop loss indicator uses 3 different stop losses in cascade, multiple algorithms and MTF to calculate them and calculate the starting point, from where the targets are calculated.
Scenario 1:
The price have a setup for continuing the trade, the price touches 1st TP, SL is moved to the entry price, the price reaches all targets => the trade is closed.
Scenario 2:
The price have a setup for continuing the trade, the price touches 1st TP, SL is moved to the entry price, the price fail to touch the other TPs and SL is triggered.
Scenario 3:
The price does not have a setup for continuing the trade, the SL is triggered.
Scenario 4 (conservative trading):
The price have a setup for continuing the trade, the price touches 1st TP => the trade is closed.
For invites, more details and questions, you can send us a private message.
Enjoy!
Shitcoin Paradise

[Shitcoin Paradise]The MatrixThe Matrix strategy is a strategy developed by @zsone and @edward_Z, that combine multiple indicators and algorithms on various time frames.
*Use it only on 4h charts*
The Matrix is built for multiple currencies/pairs and user friendly.
Features:
- possibility to choose your own crypto currencies
- setup is ready when the square from the Signal tab is green (3 green dots)
- set only 1 alert for the entire script (no need to set one alert for each pair)
- it uses multi time frames for better entries
- it uses multiple confirmations
- it have a safety net (you can set to not buy if the candle is greater than x%)
- can be easily paired with 3commas or other trading platform via webhooks
- it is user friendly, so it's ready to use/plug and play
The Matrix strategy gives setups for entries, after that you can set your own exits (take profit, stop loss, trailing stop...), or you can use our Take Profit + Stop Loss indicator , which is built for The Matrix.
For invites, more details and questions, you can send us a private message.
Enjoy!
Shitcoin Paradise
The Manager The Manger is a simple and repeatable trade management indicator suite for all instruments and for all timeframes.
The strategy that makes up this trade management tool includes:
1. Average volume calculations with auto lookbacks - Each candle then is identified as being above or below average volume with Dots above or below each candle.
2. Volume Distribution or Accumulation candles - Identifies if the candle has higher or lower volume compared to previous candle
a. If Higher volume and is a Down candle it is a distribution candle and is coloured Red.
b. If Higher volume and is an Up candles it is an accumulation candle and is coloured Green.
3. Adjustable BIAS cloud with four settings for Day Trading and Swing Trading. Red is Bearish BIAS with Price action and Green is a Bullish BIAS with Price Action.
Some of the simple rules to follow when using "The Manager" to help manage your trades Long or Short. (More is covered in our tutorial video)
1. When Short Trading and you get a Green Accumulation Candle with a Cyan Dot Above candle (Higher than Average Volume) printed. This is a sign of a potential reversal against your short trade and an aggressive profit taking exit is necessary.
2. When Long Trading and you get a Red Distribution Candle with a Cyan Dot Above candle (Higher than Average Volume) printed. This is a sign of a potential reversal against your long trade and an aggressive profit taking exit is necessary.
3. Pullbacks against the direction of your trade with Blue Dots Below Candles (Lower than average volume) show low momentum pullbacks and a sign to stay in your trade or revert to BIAS Cloud rules.
4. BIAS Cloud - When Green Changes to Red, this is your conservative exit for Long Trades. - When Red changes to Green, this is your conservative exit for short trade.
5. BIAS Cloud - When day trading and your position has a parabolic move - change settings to day trading aggressive
6. BIAS Cloud - When Swing trading and your position has a parabolic move - change settings to day trading conservative or moderate depending on how much room you want to give for a pullback against the direction of your swing trade.
Remember when day trading or swing trading, there is usually a data or news catalyst that reverses the direction of an instrument and potentially a trade that you are in. "The Manager" soon spots those with either accumulation or distribution candles combining with higher than average volume. And usually with a distinct candle stick formation rejecting highs or lows. The ability for you to visually see this on your chart with our indicator gives you chance to maximise your profits by understanding the behaviour represented by the coloured candles and the dots above or below the candles. The BIAS cloud allows for a more conservative approach to this as discussed above

Compare Crypto Bollinger Bands//This is not financial advice, I am not a financial advisor.
//What are volatility tokens?
//Volatility tokens are ERC-20 tokens that aim to track the implied volatility of crypto markets.
//Volatility tokens get their exposure to an asset’s implied volatility using FTX MOVE contracts.
//There are currently two volatility tokens: BVOL and IBVOL.
//BVOL targets tracking the daily returns of being 1x long the implied volatility of BTC
//IBVOL targets tracking the daily returns of being 1x short the implied volatility of BTC.
/////////////////////////////////////////////////////////////////
CAN USE ON ANY CRYPTO CHART AS BINANCE:BTCUSD is still the most dominant crypto, positive volatility for BTC is positive for all.
/////////////////////////////////////////////////////////////////
//The Code.
//The blue line (ChartLine) is the current chart plotted on in Bollinger
//The red line (BVOLLine) plots the implied volatility of BTC
//The green line (IBVOLLine) plot the inverse implied volatility of BTC
//The orange line (TOTALLine) plots how well the crypto market is performing on the Bolling scale. The higher the number the better.
//There are 2 horizontal lines, 0.40 at the bottom & 0.60 at the top
/////////To Buy
//1. The blue line (ChartLine) must be higher than the green line (IBVOLLine)
//2. The green line (IBVOLLine) must be higher than the red line (BVOLLine)
//3. The red line (BVOLLine) must be less than 0.40 // This also acts as a trendsetter
//4. The orange line (TOTALLine) MUST be greater than the red line. This means that the crypto market is positive.
//5.IF THE BLUE LINE (ChartLine) IS GREATER THAN THE ORANGE LINE (TOTALLine) IT MEANS YOUR CRYPTO IS OUTPERFOMING THE MARKET {good for short term explosive bars}
//6. If the orange line (TOTALLine) is higher than your current chart, say BTCUSD. And BTC is going up to. It just means BTC is going up slowly. it's fine as long as they are moving in the same position.
//5. I use this on the 4hr, 1D, 1W timeframes
///////To Exit
//1.If the blue line (ChartLine) crosses under the green line (IBVOLLine) exit{ works best on 4hr,1D, 1W to avoid fakes}
//2.If the red line crosses over the green line when long. {close positions, or watch positions} It means negative volatility is wining

BULLSEYE BORDERS (Combined Price Action Follower)Developed for Crypto Currency Market! Use for 15 minutes period or more! Under 15 minutes, results are unpredictible.
This script had been orginized with Donchian Lines based on support and resistance levels.
Rules:
If the price is under top line, you will be ready for short position, and over the bottom line, long position.
When the price passes the red and green area you can take action and enter the trade!
Orange area refers the squeezed or floating position, so you can either stop or wait for price action!
If you see boring candles frequently, check out the last high and low levels.
If the price close to the last high, take long position. If not, short position.
Use ALMA , if you want to put and alert on script. It is identical to price line.
Thanks to @millerrh for 'Breakout Trend Follower'. Just used the last low and high features to complete the script. Combined with 'Boring Candles' from ©Prasad Raut, Modified on 20190811 (Updated to %30 full candle)
Trend Tip: You can use the script with Linear Channel so you can also see the trend. (not always)
CRYPTOPRODear traders,
Welcome to CRYPTOPRO indicator. Only for crypto markets! This is an invite only script, please PM me to request permission for testing and access.
This indicator is developed as a scalping, intraday or swingtrade strategy.
Been working on indicators for years now, now back to trading again and made the best possible indicator for different timeframes.
The indicator uses market data, multiple timeframe ma/rsi charts and price action for determining a long or short strategy.
The indicator does not repaint!
I have made the indicator as easy as possible to use with added background colors.
How to use:
- Long strategy: when background turns to green after bar closing.
- Short strategy: when background turns to red after bar closing.
Alerts:
- Alerts are included in the indicator and are very simple to use.
- Alert "buy" for long strategy (green background)
- Alert "sell" for short strategy (red background)
- The alerts can also be used for automated trading/bot trading.
Time Frames :
- Can be used for all different timeframes.
Chart candles:
- Indicator is to be used with standard prince candles.
Note:
- Trading and financial markets are always risky and unpredictable.
- All trades made based on this indicator and his results are always your own responsibility.
- As an author i will not be held responsible for any of your trading profit or loss. Always be cautious when trading.
Charts can be applied to all TV supported crypto charts.
If you find the indicator usefull share your support and feedback in the comments.
Any questions PM me for more info.Thank you!
DISCLAIMER:
No sharing, copying, reselling, or any other forms of use are authorized for our scripts / strategy, and the information published with them.
This script / strategy is strictly for individual use.
This is not financial or investment advice. Investments are always made at your own risk and are based on your personal judgement.
NYTRADE is not responsible for any losses you may incur. Please trade wisely.

Crypto Strategy for Bearish Markets (Binance, FTX, Futures...)BINANCE:BTCUSDTPERP
Even in months like May '21 you can win by going long on Bitcoin. This strategy proves it and is not overwhelmed by Elon's ...
The backtest was carried out during the month of May of this year and, as you can see, all the long operations opened during the fall were successful.
So if we are going to continue to have a bear market for some time, why not take advantage of it while we remain bulls?
This strategy uses Dollar-Cost-Average (DCA) to average the entry price. Thanks to this, it is able to close profitable trades even in times of great volatility and bearish pressure.
It includes alerts that can be configured that will be sent every time the conditions to operate are met. These alerts can also be linked with 3commas for a fully automatic operation.
For Leverage Futures or Margin traders, all you have to do is divide the initial capital by the leverage used.
Enjoy!

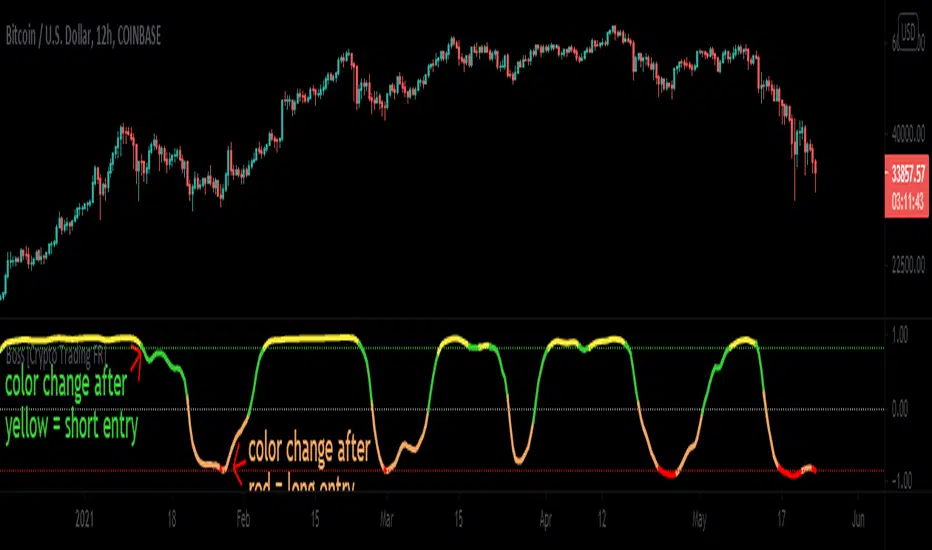
Boss Oscillator [Crypto Trading FR]The Boss Oscillator is a momentum indicator using support and resistance levels and refers to the position of the closing price in relationship to the price range over a period of time. It is calculated as the difference between the close and the low, divided by the price range (the difference between the high and low over a certain period of time). Thus, the indicator takes a value between 0,1 and -0,1 and is expressed in percentage points.
A Boss Oscillator value over 0,92% (yellow) indicates that the security is OVERBOUGHT and a crossover below that threshold represents a potential sell signal while a value below -0,92% (red) indicates that the security is OVERSOLD and a crossover above that threshold indicates a potential buy signal.
Optimal conditions for considering a short Entry
During an uptrend, sell when you get a short signal: the "Boss Oscillator" (yellow overbought line) drops below 0,92% (higher band) and is turning green.
Optimal conditions for considering a long Entry
During a downtrend, buy when you get a long signal: the "Boss Oscillator" (red oversold line) rises above -0,92% (lower band) and is turning orange.
Triggers for scaling/adding into your position = Keeping in mind that this oscillator on its own is not meant to be the sole reason for taking a trade, here are some triggers you will see for getting into position (preferably with the optimal conditions being met) The Oscillator flips from yellow color into a red slide and vise versa. The Oscillator crosses the midline up or down. The Oscillaor begins going up/down and is crossing the midline levels at 0. The Oscillator shift from one color to the next in the favored direction of the trade you wish to make.
Signs for taking profit and protecting your trade = the Boss Oscillator changes colors at the top or bottom.