[CR] BTCLONG_SHORT MTF RSI DIV+ MTF x 3 BTCSHORT and BTCLONG on BITFINEX RSI
+ SHORT vs LONG RSI + Difference
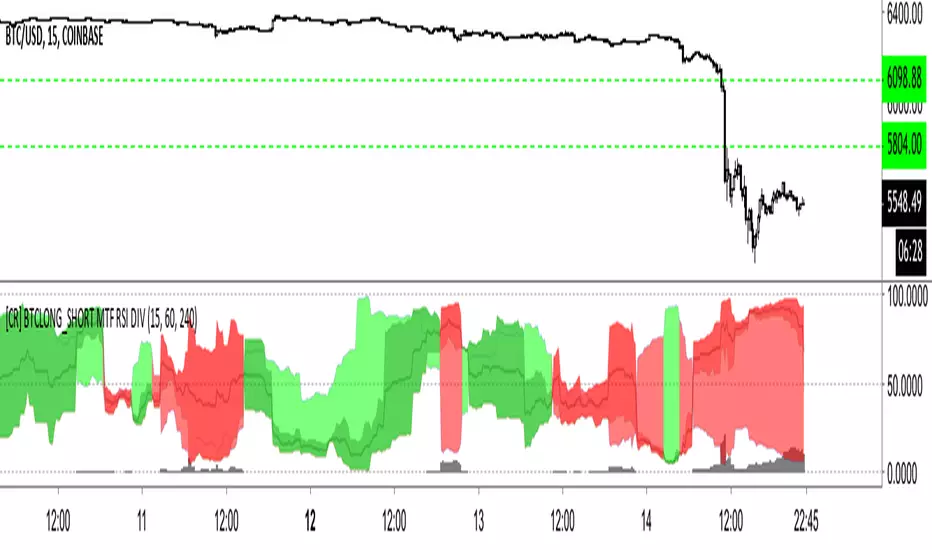
This indicator demonstrates the difference between BTCLONG and BTCSHORT values on BITFINEX and compares their relative difference also in RSI.
Red = SHORT > LONG
Lime Over Green = LONG > SHORT difference RSI greater than LONG vs SHORT RSI.
Red Over Darker Red = SHORT > LONG difference RSI greater than SHORT vs LONG RSI.
Black trend line = Total SHORT/LONG RSI
Grey Columns = Total RSI / Difference RSI
Mata Uang Crypto
TradingLive24 System EOSUSDThis is a script for EOSUSD in 5 minutes resolution.
It will show you when you must to Buy, Sell or Exit from the Crypto.
The strategy has 80% of success. You can modify and adapt it to your requirements.
If you want to have more entries, you only need to modify the parameters 3 and 4, preferably with values less than 20.
Usually, the parameter 4 need to be grater than parameter 3.
The parameters 1 and 2 don't need to be modified, but you can touch them too.
Also, the TakeProfit1 and StopLoss1, usually are greater than TakeProfit2 and StopLoss2.
If you want more percent of success, you can modify the TakeProfit with a smaller number.
Get 10-day Free Trial, just send us your TradingView Username here www.tradinglive24.com

TradingLive24 System LTCUSDThis is a script for LTCUSD in 5 minutes resolution.
It will show you when you must to Buy, Sell or Exit from the Crypto.
The strategy has 80% of success. You can modify and adapt it to your requirements.
If you want to have more entries, you only need to modify the parameters 3 and 4, preferably with values less than 20.
Usually, the parameter 4 need to be grater than parameter 3.
The parameters 1 and 2 don't need to be modified, but you can touch them too.
Also, the TakeProfit1 and StopLoss1, usually are greater than TakeProfit2 and StopLoss2.
If you want more success percent, you can modify the TakeProfit with a smaller number.
Get 10-day Free Trial, just send us your TradingView Username here www.tradinglive24.com

TradingLive24 System ETHUSD This is a script for the ETHUSD in 5 minutes resolution.
It will show you when you must to Buy, Sell or Exit from the Crypto.
The strategy has 80% of success. You can modify and adapt it to your requirements.
If you want to have more entries, you only need to modify the parameters 3 and 4, preferably with values less than 20.
Usually, the parameter 4 need to be grater than parameter 3.
The parameters 1 and 2 don't need to be modified, but you can touch them too.
Also, the TakeProfit1 and StoppLoss1, usually are greater than TakeProfit2 and StoppLoss2.
If you want more success percent, you can modify the TakeProfit with a smaller number.
Get 10-day Free Trial, just send us your TradingView Username here www.tradinglive24.com

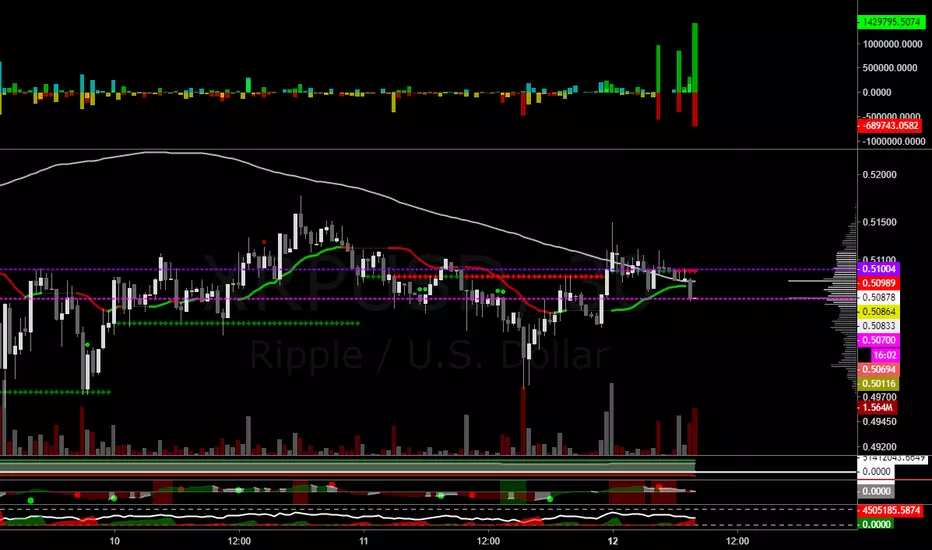
Bitfinex Margin ΔShows long/short position changes per chart period
Works for all Bitfinex margin pairs
Red = Short Open
Yellow = Long Close
Cyan = Short Close
Green = Long Open
CryptoMedics Algorithmic Trading Bands CryptoMedics are happy to announce the release of our new Algorithmic trading bands!
The Bands are used as dynamic moving support and resistance levels and can be used for anything from scalping on low timeframes to swing trading larger moves.
An example of this would be if a coin pumped 20% and you're expecting it to go up more you wait for it to return to either the upper middle or one of the core bands and long it there.
The amount of usecases for this indicator is endless.
Developed using tried and proven methods that everyone from private individuals to wallstreet hedge funds have used. Now available to CryptoMedics subscribers.
The indicator works across any assets since it isn't based on any pair-specific data but rather more broad data that exists on all trading pairs.

Bitfinex Longs/Shorts Ratio AlertableThis script contains Bitfinex longs/short ratio and generates alarms with a given input .default value is 60 which means alerts when either shorts/longs reach 60:40 ratio

Ninja EMA Cross 5/8/13This is a short term EMA cross which is used primarily used for the 1HR chart and below perfect for highly volatile markets . Color coded for clear signals and easy to read crossovers strategy. I recommended for crypto currency trading or high volatility markets.
Green over Red= Buy Signal
Red over Green= Sell Signal
Green over White= Uptrend
Red under White= Downtrend

Bones1390's GANN Strategy AlertsThese are the alerts to go along with my GANN Strategy. You can find the strategy here:
If you like my stuff, leave me a comment below.
If you're feeling kind or want to show some appreciation, you can donate Bitcoin to this Address here:
3Jp9Kow1VxvzAiLLwCdeeQ2g11wKyaT4rC
Also if there's anything you want to talk about PM me! I'm free to speak about anything. Want a custom indicator? I can do my best to code it for you!
Thanks!
Bones

PpSignal ADX Moving Average The ADX indicator uses a smoothing moving average in its calculation and we find out that the best ADX indicator settings to use is 14 periods. ... The ADX indicator can only help us to gauge the intensity of the trend so we need to RSI or Ewo indicator for entry signals.
Gray color is hold, lime buy and orange sell.

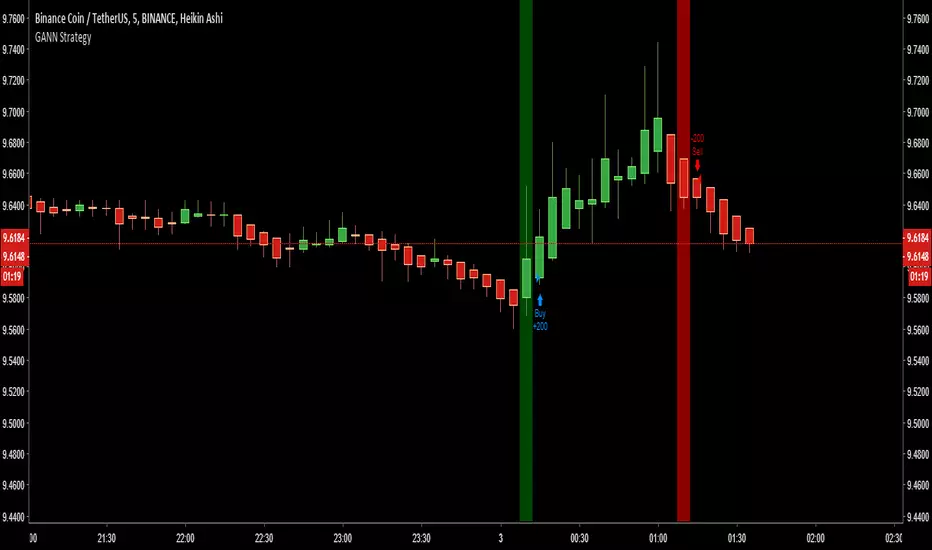
Bones1390's GANN Strategy - Works for Cryptocurrency too! [MTF]Simple Strategy.
Use this strategy with Heiken Ashi candlesticks.
RULES:
Enter Long ONE BAR after the green Vertical Signal Line plots, and sell as soon as a red Vertical Signal Line. Vice versa. You get it. ;)
Crypto Correlations HeatmapA utility tool to find linear relationships between major cryptocurrency pairs and specified symbol.
Features
31 well known cryptocurrency pairs (Pine Script has its limits and incomprehensible "study" errors)
Ability to specify any symbol to see correlations
Ability to specify a preferred timeframe
Ability to specify correlation lookback
Ability to specify different sources (standard prices, volumes, true range, double true range)
How to interpret
The darker the color, the stronger the correlation
Green colors mean positive correlations
Red colors mean negative correlations
Transparent colors mean no correlation or absence of the symbol data
How to get access
PM me for more details
Supported pairs
BTCUSD
ADAUSD
BCHUSD
DASHUSD
EOSUSD
ETCUSD
ETHUSD
LTCUSD
NEOUSD
TRXUSD
USDTUSD
XEMUSD
XLMUSD
XMRUSD
XRPUSD
ZECUSD
ADABTC
BCHBTC
DASHBTC
EOSBTC
ETCBTC
ETHBTC
LTCBTC
NEOBTC
TRXBTC
USDTBTC
XEMBTC
XLMBTC
XMRBTC
XRPBTC
ZECBTC


PpSignal Step Moving AverageStep Moving Average
The indicator calculates the moving average and draws price movement in steps. To some extent, it is similar to a Renko chart, because a new horizontal line is drawn after the prices moves a fixed distance in any direction.

PpSignal Super SignalGreat signals is a Metatrader 4 (MT4) indicator and the essence of the forex indicator is to transform the data of the accumulated history.
Great signals provides an opportunity to detect various peculiarities and patterns in price dynamics that are invisible to the naked eye.
Based on this information, traders can take the price movement further and adjust their strategy accordingly.

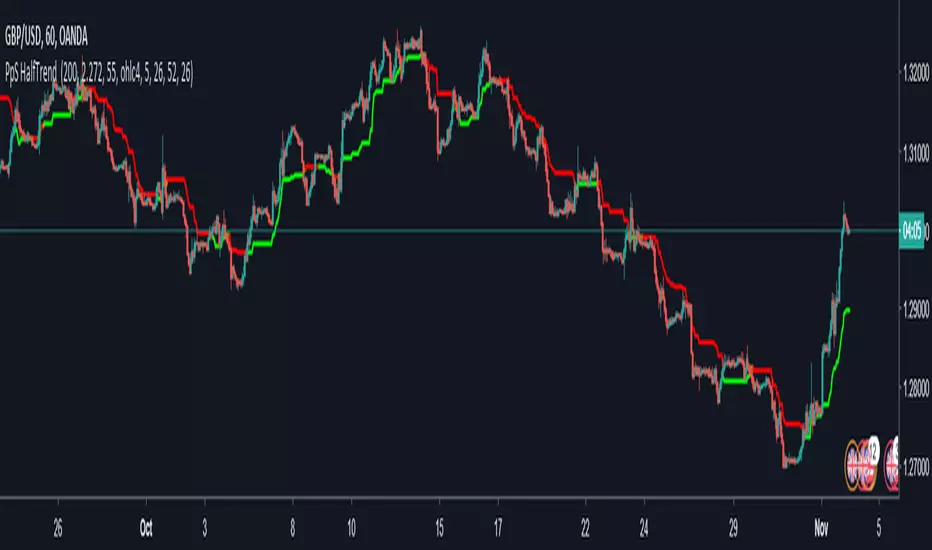
PpSignal HalfTrend 1.18Multi-trend advisor is based on the classic indicators Exponential Moving Average (EMA) with optional parameters and filter to confirm the order opening the indicator Relative Strength Index (RSI) on the signal and selectively EMA. Orders are opened while crossing at a slow fast EMA EMA or vice versa, a confirmation signal filtering.