DMI Swings (by Coinrule)The Directional Movement Index is a handy indicator that helps catch the direction in which the price of an asset is moving. It compares the prior highs and lows to draw three lines:
Positive directional line (+DI)
Negative directional line (-DI)
Average direction index (ADX)
DMI is simple to interpret. When +DI > - DI, it means the price is trending up. On the other hand, when -DI > +DI, the trend is weak or moving on the downside.
The ADX does not give an indication about the direction but about the strength of the trend.
Typically values of ADX above 25 mean that the trend is steeply moving up or down, based on the -DI and +D positioning. This script aims to capture swings in the DMI, and thus, in the trend of the asset, using a contrarian approach.
ENTRY
-DI is greater than +DI
ADX is greater than 45
EXIT
+DI is greater than -DI
ADX is greater than 45
Trading on high values of ADX, the strategy tries to spot extremely oversold and overbought conditions. Values of ADX above 45 may suggest that the trend has overextended and is may be about to reverse.
Our backtests suggest that this script performs well for very short-term scalping strategies on low time frames, such as the 1-minute.
The script considers a 0.1% trading fee to make results more realistic to those you can expect from live market conditions. So realistically, live results should be similar to backtested results.
You can plug this script directly into your crypto exchange using TradingView Signals on Coinrule.
Trade Safely!
Contrarian

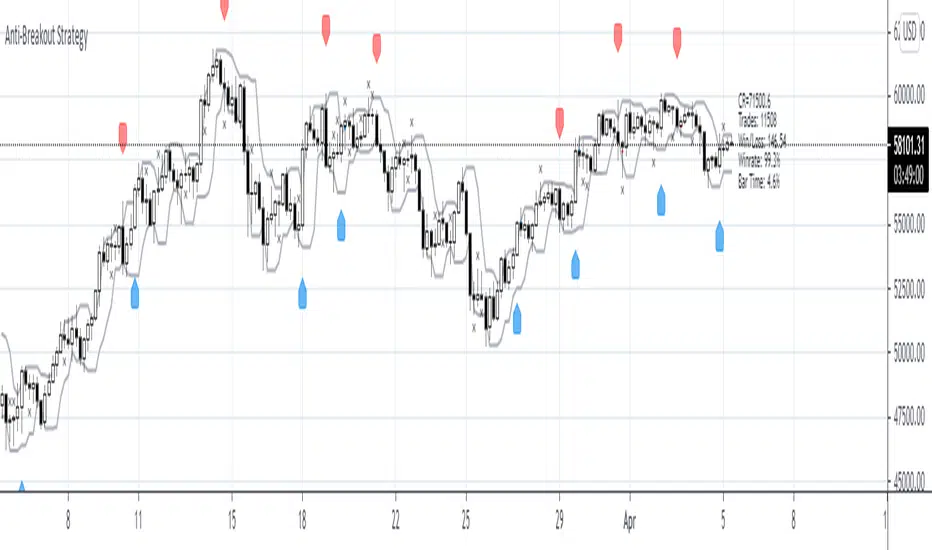
Anti-Breakout StrategyAnti-Breakout Strategy
Description:
This is a contrarian entry strategy for trading false breakouts. The high/low of the breakout bar is used for the entry in the opposite direction.
To reduce repainting set ptype variable to OHL3.
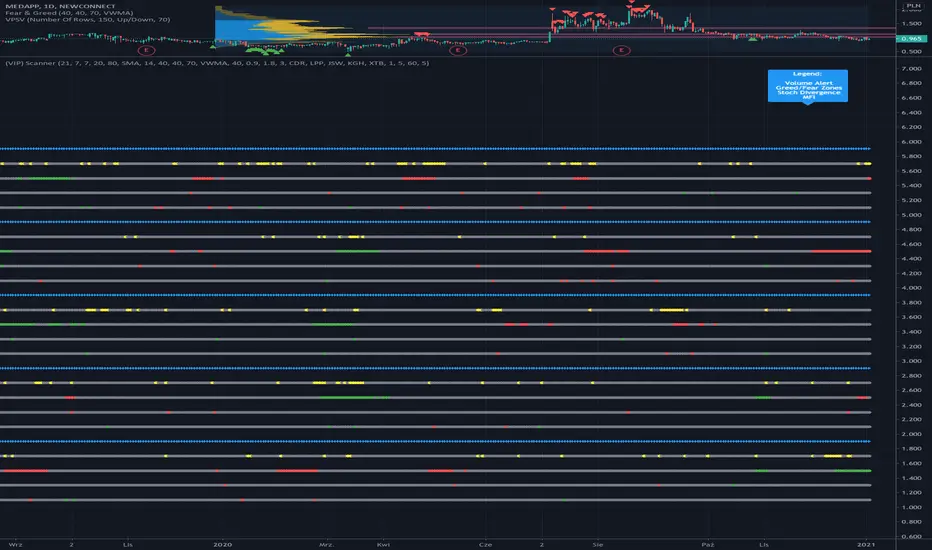
(VIP) Sniper ScannerScript is able to scan up to 5 instruments per one instance of indicator being added to chart. In case of need to monitor more instruments in parallel, please add more instances of indicator to chart. Limit of 5 instruments is applied due to Pine limitations and performance.
Please wait couple of seconds for recalculations that happen in background after changing settings of the indicator.
Scanner is checking per instrument for any entry opportunities, taking into account:
- volume spikes (anomalies)
- appearance of Contrarian Zones (accordingly to Greed & Fear logic)
- Stochastic divergences
- MFI Extreme Zones (Oversold & Overbought) exit as great opportunities to open new position
Timeframe of scanner: is automatically set to the same as the chart; example: if you want to perform scan for Daily timeframe , please select chart also to Daily timeframe
Default settings works quite efficiently on various markets and timeframes, but feel free to experiment!
To get access to indicator, become our subscriber - leave me a message or visit Documentation of my scripts mentioned in my signature.
Optimized RSI Strategy - Buy The Dips (by Coinrule)Buy low and sell high is every trader's mantra. While this approach looks straightforward in theory, it's sometimes challenging to put into practice. That requires stress-management to buy when price drops and resolution in selling when the price is rising. RSI is a useful tool to implement long-term and effective trading strategies. The script presents an optimized RSI trading strategy that uses a Moving average to spot the best time to buy the dip.
The strategy buys when the RSI is lower than 35, and at the same time, the price is below the MA100. In this way, the approach helps avoid catching early dips, increasing buying when the bottom approaches.
The position closes when the RSI value is above 65 . Depending on the volatility of the coins that the strategy will trade, it's possible to adjust the RSI exit value to chase larger profits.
The setup is optimized on a 15-minutes time frame and trading cryptocurrencies versus USD or stable coins.
The strategies was backtested over 150 times with multiple setups and coin to assess the best long-term system.
The strategy assumes each order to trade 30% of the available capital. A trading fee of 0.1% is taken into account. The fee is aligned to the base fee applied on Binance, which is the largest cryptocurrency exchange.

(VIP) Contrarian Reversal Zones Script is showing potential reversal zones on chart, based on calculations of High/Low of selected period, smoothing it with selected type of Moving Average and applying Standard Deviation. Preferred to be used for contrarian traders. Another alternative usage would be to lock profit from open positions as this is very often early warning before reversal ahead.
If you're interested with access to indicator, please contact me via DM (private message) on Tradingview.com ;)

Trend & Contrarian (Expo)Trend & Contrarian (Expo) is a powerful trend tool with adaptive contrarian- signals. A strong trend is displayed by the background color and the unique Trend dots/line can be used to confirm a strong trend or to identify early trend reversals. The contrarian-signals are adapting dynamically to price moves and should be used as 'preparation' or 'warning' prior to trigger, should be confirmed by a trend reversals signal or by other indicators.
The contrarian signals should only be used if the user fully understands how they work, please test the feature before entering a trade based on it. However, these signals can be very valuable if used correctly.
Green background color ➞ Strong Positive Trend
Red background color ➞ Strong Negative Trend
No background color? ➞ No strong trend. The Trend Dots/line determine the trend
HOW TO USE
Identify strong trends
Identify trend reversals
Identify contrarian signals
INDICATOR IN ACTION
4-hour chart
I hope you find this indicator useful , and please comment or contact me if you like the script or have any questions/suggestions for future improvements. Thanks!
I will continually work on this indicator, so please share your experience and feedback as it will enable me to make even better improvements. Thanks to everyone that has already contacted me regarding my scripts. Your feedback is valuable for future developments!
-----------------
Disclaimer
Copyright by Zeiierman.
The information contained in my scripts/indicators/ideas does not constitute financial advice or a solicitation to buy or sell any securities of any type. I will not accept liability for any loss or damage, including without limitation any loss of profit, which may arise directly or indirectly from the use of or reliance on such information.
All investments involve risk, and the past performance of a security, industry, sector, market, financial product, trading strategy, or individual’s trading does not guarantee future results or returns. Investors are fully responsible for any investment decisions they make. Such decisions should be based solely on an evaluation of their financial circumstances, investment objectives, risk tolerance, and liquidity needs.
My scripts/indicators/strategies/ideas are only for educational purposes!
ACCESS THE INDICATOR
• Contact me on TradingView or use the links below

Multi Time Frame Buy the Dips (by Coinrule)Buying the dips is a relatively easy automated trading strategy that can return impressive profits, especially during uptrend times. Not all price drops are for buying, though. This trading system is based on a multi time frame buy-the-dip approach to optimize each trade.
The strategy catches sudden price drops on a 1-hr time frame when the price increases significantly in the last 12 hours. During steep uptrends, profit-taking price actions result in flash crashes that provide great opportunity to enter at convenient prices.
Buy Condition
The setup of the script is optimized on a 30 min time frame. You can adjust the parameters to fit different time frames.
The system gets a buy signal when
- the price drops 1% from the two previous candles (1 hour time frame = two 30-min candles)
- the price is up 3% from the last 12 hours (twenty-four 30-min candles equal the desired time frame)
Sell Condition
Each trade comes with a stop loss of 3% and a take profit of 4%.
This setup has been optimized, running over 150 backtests on more than 20 different crypto trading pairs.
The strategy assumes each order to trade 30% of the available capital. A trading fee of 0.1% is taken into account. The fee is aligned to the base fee applied on Binance, which is the largest cryptocurrency exchange.

QUANTUMQUANTUM INDICATOR
Contains trend and contrarian buy and sell signals. Fear and greed levels lines.
You can select signal risk level 1 to 6.
Trend signal buy color : lime and sell color : red
Contrarian signal buy color : orange and navy and sell color : blue
Signals are numbered 1 to 6
open indicator settings and select risk level
1 very low risk signal
2 low risk risk signal
3 normal risk
4 normal risk
5 high risk signals
6 very high risk signals
indicator contains key levels. Support and resistance lines. And you can see breakout and breakdown arrows. When Rahul Mohindar indicator give buy signal tha price bar color change blue and sell signal price bar change gray color. When Know Sure Thing indicator give you buy signal the price bar color change aqua and sell signal black.
For access message me.

Buy The Dips - MA200 OptimisedThe strategy combines a contrarian approach (buying the dips) with a trend-following logic (only when the price is above the MA200)
The strategy seeks to find the best times when buying the dips on the asset should result to be more profitable.
The price above a long-term moving average indicates momentum that increases the possibility of profiting from buying the asset on short-term weakness.

Fearzone & Greedzone Levels - Contrarian & Breakout (Expo)"Be fearful when others are greedy, and greedy when others are fearful" - Warren Buffett. Fearzone & Greedzone Levels - Contrarian & Breakout (Expo) is a contrarian and breakout indicator that gives us an indication when fear and greed begins to take over in the market. Traders should be prepared for increased volatility and good trading opportunities.
This indicator can both be used to identify potential reversal points and be used to identify breakouts from previous Fear and Greed Levels.
The Fearzone and Greedzone can be visualized with candlesticks or with circles depending on what you prefer.
Alert conditions are added.
HOW TO USE
1. Use the indicator to identify when investors are fearful and greedy.
2. Use the indicator to identify potential reversal points.
3. Use the indicator to identify potential breakouts.
INDICATOR IN ACTION
4 hour chart
4 hour chart
I hope you find this indicator useful , and please comment or contact me if you like the script or have any questions/suggestions for future improvements. Thanks!
I will continually work on this indicator, so please share your experience and feedback as it will enable me to make even better improvements. Thanks to everyone that has already contacted me regarding my scripts. Your feedback is valuable for future developments!
-----------------
Disclaimer
Copyright by Zeiierman.
The information contained in my scripts/indicators/ideas does not constitute financial advice or a solicitation to buy or sell any securities of any type. I will not accept liability for any loss or damage, including without limitation any loss of profit, which may arise directly or indirectly from the use of or reliance on such information.
All investments involve risk, and the past performance of a security, industry, sector, market, financial product, trading strategy, or individual’s trading does not guarantee future results or returns. Investors are fully responsible for any investment decisions they make. Such decisions should be based solely on an evaluation of their financial circumstances, investment objectives, risk tolerance, and liquidity needs.
My scripts/indicators/ideas are only for educational purposes!

GreedZone indicator - Contrarian Indicator"Be fearful when others are greedy, and greedy when others are fearful" - Warren Buffett. Greedzone is a contrarian indicator that gives us an indication when greed begins to take over in the market. Traders should be prepared for increased volatility and good trading opportunities.
The Greedzone is visualized with green candlesticks above the price.
HOW TO USE
1. Use the indicator to identify when investors are greedy.
2. Use the indicator to identify potential reversal points.
INDICATOR IN ACTION
1 hour chart
5 min chart
I hope you find this indicator useful , and please comment or contact me if you like the script or have any questions/suggestions for future improvements. Thanks!
I will continually work on this indicator, so please share your experience and feedback as it will enable me to make even better improvements. Thanks to everyone that has already contacted me regarding my scripts. Your feedback is valuable for future developments!
-----------------
Disclaimer
Copyright by Zeiierman.
The information contained in my scripts/indicators/ideas does not constitute financial advice or a solicitation to buy or sell any securities of any type. I will not accept liability for any loss or damage, including without limitation any loss of profit, which may arise directly or indirectly from the use of or reliance on such information.
All investments involve risk, and the past performance of a security, industry, sector, market, financial product, trading strategy, or individual’s trading does not guarantee future results or returns. Investors are fully responsible for any investment decisions they make. Such decisions should be based solely on an evaluation of their financial circumstances, investment objectives, risk tolerance, and liquidity needs.
My scripts/indicators/ideas are only for educational purposes!

Fearzone (Expo) - Contrarian Indicator"Be fearful when others are greedy, and greedy when others are fearful" - Warren Buffett. Fearzone is a contrarian indicator that gives us an indication when fear begins to take over in the market. Traders should be prepared for increased volatility and good trading opportunities.
The Fearzone is visualized with red candlesticks below the price.
This version of the FearZone indicator is slightly different from the one ©kruskakli has published.
HOW TO USE
1. Use the indicator to identify when investors are fearful.
2. Use the indicator to identify potential reversal points.
INDICATOR IN ACTION
1 hour chart
5 min chart
I hope you find this indicator useful , and please comment or contact me if you like the script or have any questions/suggestions for future improvements. Thanks!
I will continually work on this indicator, so please share your experience and feedback as it will enable me to make even better improvements. Thanks to everyone that has already contacted me regarding my scripts. Your feedback is valuable for future developments!
-----------------
Disclaimer
Copyright by Zeiierman.
The information contained in my scripts/indicators/ideas does not constitute financial advice or a solicitation to buy or sell any securities of any type. I will not accept liability for any loss or damage, including without limitation any loss of profit, which may arise directly or indirectly from the use of or reliance on such information.
All investments involve risk, and the past performance of a security, industry, sector, market, financial product, trading strategy, or individual’s trading does not guarantee future results or returns. Investors are fully responsible for any investment decisions they make. Such decisions should be based solely on an evaluation of their financial circumstances, investment objectives, risk tolerance, and liquidity needs.
My scripts/indicators/ideas are only for educational purposes!

Trend Checker by Hally - IndicatorIt is an indicator that overlaps MACD and Stochastics.
It has both characteristics.
The trend changes when two lines intersect.
I think the reaction is bad in the range market.
Also, when there are Stochastics and MACD lines above the indicator, it is possible to think whether it is overbought while riding the trend, and it may be helpful for making decisions such as "maybe it will reverse soon". Hmm.
Also, I think it is better to use it in combination with other indicators.
This is my first pine script, and I couldn't find it even if I searched for the script with overlapping indicators of different scales, so I tried making it by trial and error.
I hope it helps somebody trying to do the same.
MACDとStochasticsを重ね合わせたインジケーターです。
それぞれの特徴を併せ持っています。
2本のラインが交差する時トレンドが変化します。
レンジ相場では反応が悪いと思います。
また、インジケーターの上の位置にStochasticsとMACDラインがあるときはトレンドに乗りながらも買われすぎかどうか考えられることが出来ますし、「そろそろ反転するかも」などの判断の助けになるかもしれません。
また、他の指標との併用して使うほうが良いと思います。
pineスクリプトは初めてで、異なるスケールのインジケーターを重ね合わせていスクリプトは探しても見つからなかったので試行錯誤で作ってみました。
同じようなことをやろうとしてる誰かの参考になれば幸いです。

Smart Envelope - Running Away From The TrendIntroduction
Envelopes indicators consist in displaying one upper and one lower extremity on the price chart. They are most of the time built by adding/subtracting a volatility estimator (rolling stdev, atr, range...etc) to a central tendency estimator (SMA, EMA, LSMA...etc) . Their interpretation is often subject to debate amongst technical analyst, some will use a support and resistance methodology, where price will start a downtrend once it cross the upper extremity, and a down trend once it cross the lower one. Others will prefer a breakout methodology, where price will reach higher highs once it cross the upper extremity, and lower lows when it cross the lower one. Because of price non stationarity its hard to select the best methodology, the support and resistance one will mostly work on ranging markets, while the breakout methodology mostly work on trending ones.
Therefore new methods where proposed, instead of using moving averages with a high lag, faster filters where used, such as the least squares moving average or zero lag exponential moving average, other band indicators where also created using adaptive filters, but improvements remain relatively low. The most difficult task would be to make extremities with the ability to return accurate support and resistances levels, and today i want to provide a new way to construct such extremities by using the recursive bands framework that allow extremely creative and efficient indicators.
The Main Idea
With classical bands indicators, the upper and lower extremity will still be correlated with the main trend, the problem behind such method is that we can't use a support and resistance methodology with trending markets, the fact that reversals exist tells us that our extremities will always be crossed by the main trend, here is an example :
Here the support is correlated with the main trend, in order for it to be accurate we must assume the trend will go on for ever, and will only detect higher lows, this is what we expect with the orange line, but we can see that a severe down trend totally destroy our plan.
In short we need to give some headroom to our extremities, and thus one extremity can't be correlated with the main trend.
The proposed Indicator
We want to minimize the correlation between the extremities, so if the upper extremity rise, the lower one must fall. This allow to give some headroom and allow the user to anticipate larger movements, this is how bands seeking to give support and resistances points should work.
The indicator has a length setting that control the wideness of the extremities, unlike other indicators low values such as 14 can still create really wide bands, take that into account.
length = 5. Lower length values allow for more motion from the extremities, but does not necessarily involve detecting shorter terms support and resistances levels. The factor setting is not that important, but it allow to return extremities with more motion when high, and really wide bands when below 1 and greater than 0.
Central Tendency Estimator
Something fun with the recursive band framework is that the bands are no longer based on the central tendency estimator but its the central tendency estimator who is based on the bands. The central tendency estimator can also provide support and resistances points with the price, like classical moving averages, altho its lack of motion is this time a downside.
Conclusion
Altho the extremities are more accurate than other band indicators, the problem remain the same, larger trend will always break the extremities and continue creating higher/lower highs/lows, at this point our stop loss would certainly be triggered. This is a huge downsides of contrarian strategy, we sure might anticipate reversals earlier, but we are exposed to larger price movements, therefore the risk is extreme.
But the proposed methodology might still prove useful to develop more robust support and resistances levels based on envelopes indicators.
Thanks for reading !

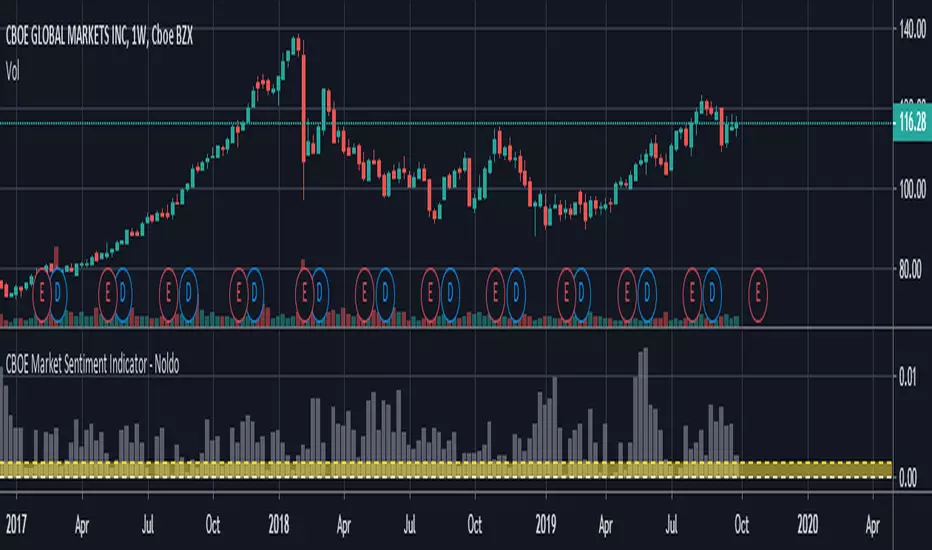
Call / All Ratio ( C / A ) - NoldoFirst of all this script inspired by MagicEins' Put/Call-Ratio-Buschi script .
What is the Put-Call Ratio
The put-call ratio is an indicator ratio that provides information about relative trading volumes of an underlying security's put options to its call options. The put-call ratio has long been viewed as an indicator of investor sentiment in the markets, where a large proportion of puts to calls indicates bearish sentiment, and vice versa. Technical traders use the put-call ratio as an indicator of performance and as a barometer of overall market sentiment. Put-call ratios on broader indexes such as the S&P 500 are also used as more general gauges of market climate.
Put-Call Ratio Interpretation
One way to interpret the put-call ratio is to say that a higher ratio means it's time to sell and a lower ratio means it's time to buy, because when the ratio is high it suggests that people are either expecting or protecting more readily against a future decline in the price of the underlying. A Put-Call ratio between 0.5 and 1 is considered a sideways trend in the markets.
Some also view the Put-Call ratio as a contrarian indicator. Traders know that derivatives are used to do more than place bets; they are used as hedges and insurance. If there's a lot of insurance being placed to the sell side, it means traders are worried about prices falling.
Some traders buy when the put-call ratio is above 1, meaning the market is out of balance to the sell side, and sell when the put-call ratio is below 1, meaning the market is out of balance to the buy side. These traders are looking to make money on the correction. The interpretation of the ratio is left to the analyst's or trader's investment philosophy.
Reference : Investopedia (www.investopedia.com)
Let' s start.
In short, calls represent "bulls" and puts represent "bears".
Some analysts do the opposite,for trend reversals the choice is up to you.
I usually look at the opposite comments in commercial positions because I look at this flow angle neutral.
If you want to do the opposite, you must create Put / All Ratio.
So i created this ratio to observe easily movements under or over 0.50 area .
Or you can take the point close to 0.50 as a horizontal trend. Many more comments can be made.I have a few ideas about this, and I'm going to publish them soon . My best suggestion is that it covers a single bar and is very volatile, so you can look for averages and strong accelerations.
This code is open source under the MIT license. If you have any improvements or corrections to suggest, please send me a pull request via the github repository github.com
Stay tuned , best regards.
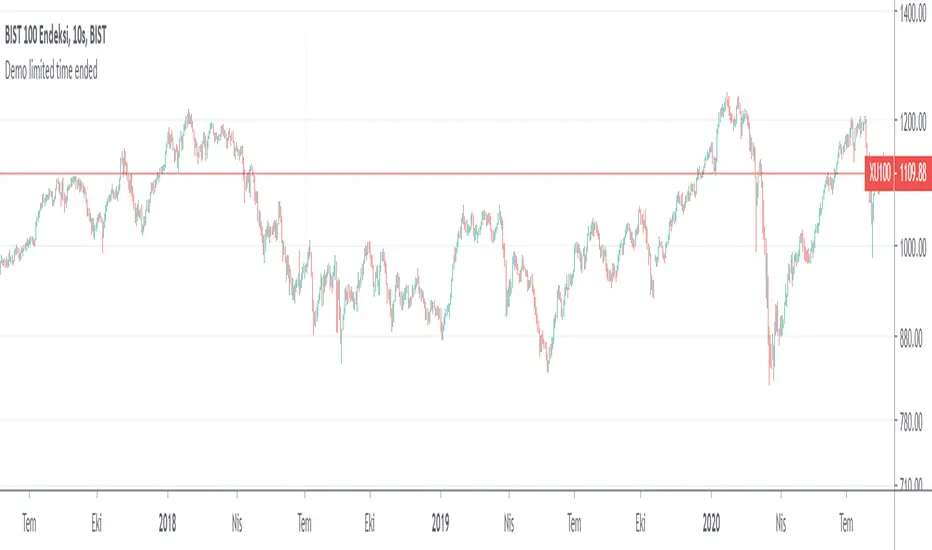
Borsaca StrategyThis indicator uses contrarian investment style. You can use Buy/Sell indicator and trade hibryd mentality. What do you say? Dont hear before what is mean?
Ok. Good Luck.
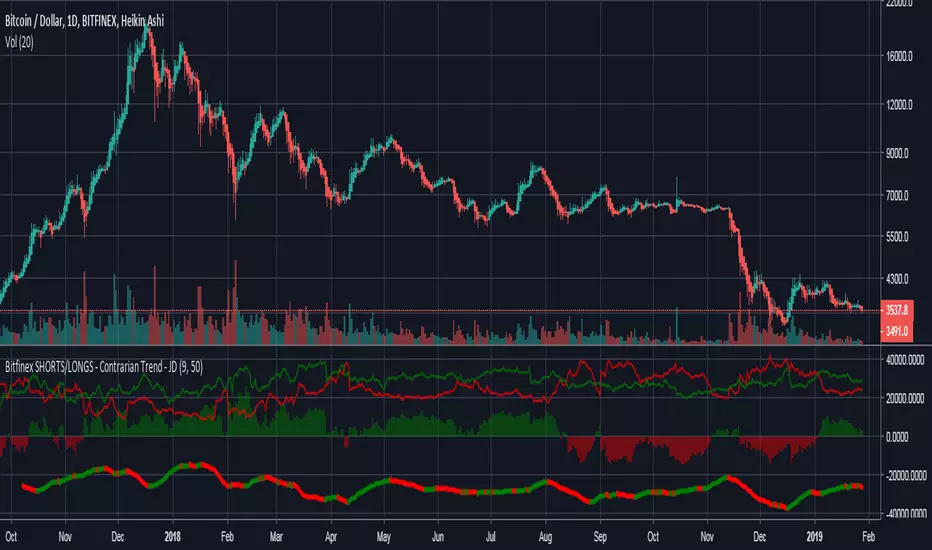
Bitfinex SHORTS/LONGS - Contrarian Trend - JDA script indicating BFX sentiment through the current long and short positions.
-The histogram shows the dominant position.
-The line on the bottom shows the expected market direction from a contrarian standpoint.
PS. cudo's to @alexgrover for the quad-reg function!!
JD.
#NotTradingAdvice #DYOR
UCS_Ready Set Go2017 - First Code
This is a another way of looking at DMI indicator. Almost similar to any oscillator. You still need to understand the indicator and chart before you can trade with these.
---------------------------------------------------------------------------

DP's Countertrend IndicatorShows your potential profit by going short(red)/long(green) against the current trend, use with you favorite entry/exit method for maximum effect, can be adjusted for share cost and commission.
