Hyper Strength Index | QuantLapse🧠 Hyper Strength Index (HSI) | QuantLapse 
 Overview: 
The Hyper Strength Index (HSI) is a composite momentum oscillator designed to unify multiple strength measures into a single, adaptive framework. It combines the Relative Strength Index (RSI), Chande Momentum Oscillator (CMO), Money Flow Index (MFI), and Stochastic RSI to deliver a refined, multidimensional view of market momentum and overbought/oversold conditions.
Unlike traditional oscillators that rely on a single formula, the HSI averages four distinct momentum perspectives — price velocity, directional conviction, volume participation, and stochastic behavior — offering traders a more balanced and noise-resistant reading of market strength.
 ⚙️ Calculation Logic: 
The Hyper Strength Index is computed as the normalized average of:
 
 📈 RSI — classic measure of relative momentum.
 💪 CMO — captures directional bias and intensity of moves.
 💵 MFI — integrates volume and money flow pressure.
 🔄 Stochastic RSI (K-line) — identifies momentum extremes and short-term turning points.
 
This fusion creates a smoother, more comprehensive signal, mitigating the weaknesses of any single oscillator.
 🎯 Interpretation: 
Overbought Zone (Default: > 75):
Indicates potential exhaustion of bullish momentum — a cooling phase or reversal may follow.
Oversold Zone (Default: < 7):
Suggests bearish exhaustion — a rebound or accumulation phase may emerge.
Neutral Zone (Between 7 and 75):
Represents balanced market conditions or trend continuation phases.
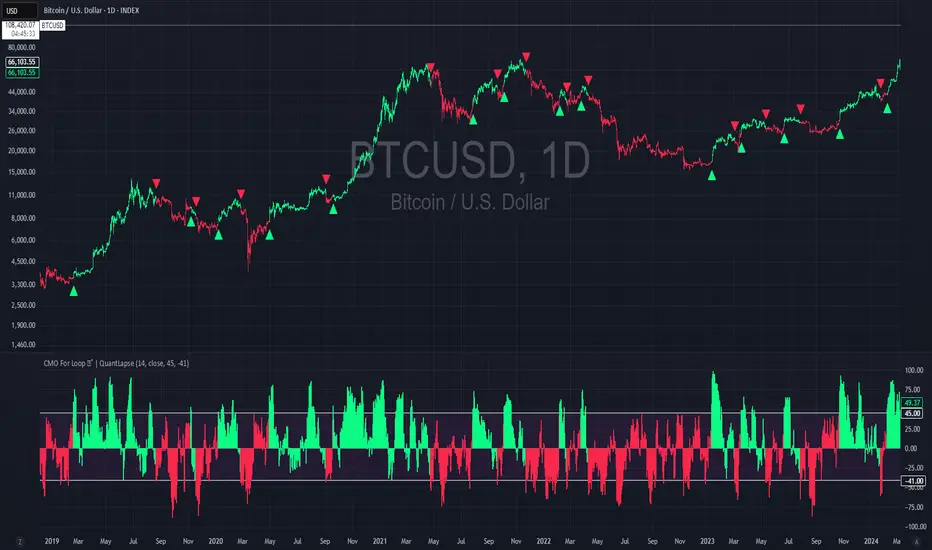
Visual cues highlight key conditions:
🔺 Red Highlights — Overbought regions or downward inflection points.
🔻 Green Highlights — Oversold regions or upward inflection points.
Neutral zones are shaded with subtle gray backgrounds for clarity.
 💡 Key Features: 
🔹 Multi-factor strength analysis (RSI + CMO + MFI + StochRSI).
🔹 Adaptive overbought/oversold detection.
🔹 Visual alerts via colored backgrounds and bar markers.
🔹 Customizable smoothing and length parameters for fine-tuning sensitivity.
🔹 Intuitive visualization ideal for both short-term scalping and swing trading setups.
🧭 Usage Notes:
Works best as a momentum confirmation tool — pair with trend filters like EMA, SuperTrend, or ADX.
In trending markets, use crossovers from extreme zones as potential continuation or exhaustion signals.
In ranging markets, exploit overbought/oversold reversals for high-probability mean reversion trades.
📘 Summary:
The Hyper Strength Index | QuantLapse distills multiple dimensions of market strength into a single, cohesive oscillator. By merging price, volume, and directional momentum, it provides traders with a more robust, responsive, and context-aware perspective on market dynamics — a next-generation evolution beyond the limitations of RSI or CMO alone.
CMO
CMO For Loop | QuantLapseCMO For Loop Indicator
The CMO For Loop indicator, inspired by Alex Orekhov's, "Chande Momentum Oscillator," and indicator originally made by Tushar Chande, the CMO designed as a fast and responsive tool to capture quick price movements in financial markets. This oscillator leverages Momentum to measure price deviations, providing a concise yet powerful framework for identifying potential trade entry and exit points. What makes this
"enhanced" CMO indicator special is its ability to identify trending periods more accurately. By using thresholds, this allows the script to enter accurate long and short conditions extremely quickly.
Intended Uses:
Used to capture long-term trends:
  
Used to identify quick reversals:
  
 Recommended Uses 
 
 Best suited for higher timeframes (8H+) to improve accuracy of signals.
 Designed for strategies that require fast entries and exits.
 Can also be applied to scalping approaches.
 
Not Recommended For
 
 Should not be used as a mean reversion tool.
 Should not be interpreted as a valuation indicator (overbought/oversold levels).
 
 Key Features 
Rapid Market Reaction
Built to prioritize speed over smoothing, making it ideal for traders who want to take advantage of quick price shifts in trending or highly volatile markets.
 Flexible Thresholds 
Users can customize the upper and lower CMO levels to trigger long or short conditions, allowing the indicator to adapt to different assets and trading styles.
 Embracing the Noise 
Signals may appear frequently, but this is intentional. The tool is optimized for traders who thrive on fast rotations, using the “noise” to catch short-lived yet impactful moves.
 Clear Visual Feedback 
Plots key oscillator levels and provides dynamic, color-coded candles and shapes that make it easy to identify bias and react quickly.
How It Works
 Oscillator Calculation 
The CMO (Chande Momentum Oscillator) is derived from comparing the source price’s deviations relative to its momentum. This approach emphasizes trend-driven price shifts.
 Signal Triggers 
When the oscillator rises above the upper threshold, a long bias is triggered and remains until the CMO drops below the lower threshold.
When the oscillator falls below the lower threshold, a short bias is triggered and remains until the CMO crosses back above the upper threshold.
No bias is active when the oscillator is between thresholds.
 Visual Signals 
Green candles = long bias
Red candles = short bias
Gray candles = neutral/no signal
Triangles mark points of change in signal direction.
Chande Momentum Oscillator (CMO) Buy Sell Strategy [TradeDots]The "Chande Momentum Oscillator (CMO) Buy Sell Strategy" leverages the CMO indicator to identify short-term buy and sell opportunities.
 HOW DOES IT WORK 
The standard CMO indicator measures the difference between recent gains and losses, divided by the total price movement over the same period. However, this version of the CMO has some limitations.
The primary disadvantage of the original CMO is its responsiveness to short-term volatility, making the signals less smooth and more erratic, especially in fluctuating markets. This instability can lead to misleading buy or sell signals.
To address this, we integrated the concept from the Moving Average Convergence Divergence (MACD) indicator. By applying a 9-period exponential moving average (EMA) to the CMO line, we obtained a smoothed signal line. This line acts as a filter, identifying confirmed overbought or oversold states, thereby reducing the number of false signals.
Similar to the MACD histogram, we generate columns representing the difference between the CMO and its signal line, reflecting market momentum. We use this momentum indicator as a criterion for entry and exit points. Trades are executed when there's a convergence of CMO and signal lines during an oversold state, and they are closed when the CMO line diverges from the signal line, indicating increased selling pressure.
 APPLICATION 
Since the 9-period EMA smooths the CMO line, it's less susceptible to extreme price fluctuations. However, this smoothing also makes it more challenging to breach the original +50 and -50 benchmarks.
To increase trading opportunities, we've tightened the boundary ranges. Users can customize the target benchmark lines in the settings to adjust for the volatility of the underlying asset.
The 'cool down period' is essentially the number of bars that await before the next signal generation. This feature is employed to dodge the occurrence of multiple signals in a short period.
 DEFAULT SETUP 
Commission: 0.01%
Initial Capital: $10,000
Equity per Trade: 80%
Signal Cool Down Period: 5
 RISK DISCLAIMER 
Trading entails substantial risk, and most day traders incur losses. All content, tools, scripts, articles, and education provided by TradeDots serve purely informational and educational purposes. Past performances are not definitive predictors of future results.
Auto Fibo on IndicatorsThis drawing tool aims to draw auto Fibonacci Retracement Levels on desired indicators.
Users can define the target indicator to draw Auto Fibo Lines, from the "settings tab":
There are six commonly used indicators below the charts that can be selected to draw Fibonacci Retracement lines on:
RSI : Relative Strength Index
CCI : Commodity Channel Index
MFI : Money Flow Index
STOCHASTIC : Stochastic Oscillator
CMF : Chaikin Money Flow
CMO : Chande Momentum Oscillator
Fibonacci Retracement Levels will appear automatically after applying the indicator.
The "Auto Fibo on Indicators" tool looks back. It checks the indicator levels for a desired number of bars and then draws the Fibonacci Levels automatically in the right way, considering the final movements of the indicator.
There are five commonly used Fibonacci Levels added between the Highest and Lowest values such as:
%23.6
%38.2
%50 (Not precisely a Fibonacci Level, indeed)
%61.8 (Golden Ratio)
%78.6
Four extra levels can be added from the settings tab by checking their boxes:
%127.2 (adjustable level)
%161.8
%261.8
%361.8
Default lookback bars of Auto Fibo Levels: 144 (which is also a Fibonacci number)
Default Indicator: RSI
Default Indicator length: 14
Default data source: CLOSE
Users can also define and show overbought and oversold levels by unchecking the "Do not Show Indicator Overbought / Oversold Levels?" button from the settings menu.
In technical analysis, Fibonacci Levels on price can guide valuable trading signals for investors.
Levels can be significant support and resistance levels for breakouts and turning points.
This drawing tool aims to follow those necessary levels on indicators to observe critical levels and breakouts.
Savitzky-Golay Filtered Chande Momentum OscillatorThe Savitzky-Golay Filtered Chande Momentum Oscillator (SGCMO) is a modified version of the Chande Momentum Oscillator that functions as a powerful analytical tool, capable of detecting trends and mean reversals. By applying a Savitzky-Golay filter to the price data, the oscillator provides enhanced visualization and smoother readings. (credit to © anieri for the Savitzky-Golay filter code: www.tradingview.com)
Chande Momentum Oscillator
The Chande Momentum Oscillator (CMO) is a technical indicator developed by Tushar Chande. It measures the momentum of an asset's price movement and provides insights into the overbought or oversold conditions of the market. The CMO calculates the difference between the sum of positive price changes and the sum of negative price changes over a specified period, and then normalizes it to a scale between -100 and +100. Traders and investors use the CMO to identify potential trend reversals, confirm the strength of a current trend, and generate buy or sell signals.
Smoothing
The Savitzky-Golay filter is a digital filter commonly employed for smoothing and noise reduction in time-series data. In the context of the SGCMO, the aim is to effectively smooth the CMO values, reducing the impact of short-term fluctuations and providing clearer insights into underlying trends. Additionally, an exponential moving average (EMA) filter is applied to further reduce noise and enhance trend visibility. This filtered CMO indicator may provide traders and investors with a clearer and more refined representation of momentum changes in the underlying asset, helping them make more informed trading decisions.
Application
The SGCMO serves as both a trend-following and mean-reversion tool. Traders can track the current trend using bullish white lines or bearish orange lines in trending markets. Alternatively, they can utilize green and red vertical lines, which indicate price retracement and help capture pullbacks and reversals. Green vertical lines appear when the trend reverses upwards in an oversold zone (-50 to -80), while red vertical lines indicate negative trend reversals in an overbought zone (50 to 80). Opening long positions when green and white lines appear, or short positions when red and orange lines are visible, can be considered. However, it is advisable to combine this indicator with other complementary technical analysis tools and incorporate it into a comprehensive trading strategy to maximize its effectiveness.
ALMA Smoothed Gaussian Moving AverageThis indicator is an altered version of the Gaussian Moving Average (GMA) (Credit to author: © LeafAlgo ). The GMA applies weights to the prices, giving more importance to the values closer to the current period and gradually diminishing the significance of older prices. The ALMA Smoothed Gaussian Moving Average (ASGMA) applies an ALMA smoothing to its price data to minimize lag and provide a more accurate representation of the underlying trend by dynamically adapting to changing market conditions. The Arnaud Legoux Moving Average (ALMA) is a specialized smoothing technique that adjusts the weights of the moving average based on market volatility. Its calculation uses Wavelet Transform techniques which enables this type of smoothing to capture both high-frequency and low-frequency components of a signal or data. The rationale for this mashup between ALMA and Gaussian filtering is to smooth the moving average line over the smoothed price data and produce stronger trend signals.
ASGMA serves as a trend-following indicator, identifying both bullish and bearish trends. It provides buy and sell signals indicated by "B" and "S" labels plotted alongside the price data. Additionally, the ASGMA's Exponential Moving Average (EMA) line alternates between green and red, indicating bullish and bearish momentum, respectively.
The ASGMA also incorporates two popular momentum indicators, the Relative Strength Index (RSI) and the Chande Momentum Oscillator (CMO). The inclusion of these indicators aims to enhance trend identification and reversal signals. For a strong buy signal, all three indicators (RSI, CMO, and ASGMA) must indicate bullish conditions, resulting in a vertical green line. Conversely, a vertical red line is plotted when all indicators indicate bearish conditions, representing a strong sell signal.
The ASGMA, with its unique combination of smoothing techniques and indicator amalgamation, provides traders and investors with powerful analytical tools. It can be applied in trend-following strategies using the regular buy and sell signals generated by labels and the EMA line. Alternatively, the vertical lines offer stronger buy and sell signals. These features aid in identifying potential entry and exit points, thereby enhancing trading decisions and market analysis. However, it is important to remember that the future performance of any trading strategy is fundamentally unknowable, and past results do not guarantee future performance.
Oscillator ExtremesThe Oscillator Extremes indicator plots the normalized positioning of the selected oscillator versus the Bollinger Bands' upper and lower boundaries. Currently, this indicator has four different oscillators to choose from; RSI, CMO, CCI, and ROC.  
When the oscillator pushes towards one extreme, it will bring the value of the prevailing line closer to zero. If the bullish or bearish line crosses the zero line, the oscillator is past the extreme of the Bollinger Band. 
Example: If the RSI crosses over the upper boundary of the Bollinger, the bullish(green) line will cross under the zero line. 
Crossovers of the bullish and bearish lines can indicate a shift in momentum and are a signal. Where the line crossing under, towards zero, is the prevailing trend. The plotted lines will highlight green(bullish) or red(bearish) to show the prevailing trend. This is similar to a DI+- crossover that is commonly associated with the ADX. 
We have included an optional normalized ADX to help validate signals. The ADX will change color based on the slope of the ADX.  Purple indicates a positive slope and white for a negative slope. 
Adaptive Fisherized CMOIntroduction 
Heyo, here is another no-repaint adaptive fisherized indicator. 
I added Inverse Fisher Transform, Ehlers dominant cycle analysis and smoothing to the Chande Momentum Oscillator (CMO).
 Usage 
The CMO is a momentum oscillator which shows the usual movement of an asset.
I recommend to use it from a lower timeframe with a higher timeframe set.
 Signals 
(Signal mode will come soon.)
 Zero Line 
CMO crosses above zero line => enter long
CMO cross below zero line => ente short
 Overbought/Oversold 
CMO crosses above bottom band => enter long
CMO crosses under top band => enter short
 MA   (Maybe this signals will vary. Then, check update notes.)
CMO crosses above MA => enter long
CMO crosses below MA => enter short
 Enjoy and share your experience with it! 
More to read:  CMO Explanationsp
Oscilator CandlesBased on the response received on Bollinger %B candles, thought it would be nice to get the same on oscillators.
Use cases include applying atr based indicators or any indicators which utilizes - high, low, open close on oscillator values. Example : supertrend
Note: length values are reused by different oscillator types based on input requirements.
Hybrid Overbought/Oversold Detector + Put/Call SignalsThere are many indicators of overbought/oversold conditions out there. Some of more common ones are:
- Bollinger Bands %B
- Money Flow Index (MFI)
- Relative Strength Index (RSI)
- Stochastic
This script uses a combination of these 4 oscillators to confirm overbought/oversold and filter the signals of market reverse which could be used for trading binary options.
You may select which oscillators you want to apply and of course change the source, the length of the calculations and the overbought/oversold levels.
Also the script will draw a combined graph which is the average of the selected oscillators in the options.
Send me your ideas!
All MAs displayedThis is a collection of moving averages.
Thanks to everget and other pinecoders to pubblish their codes in tradingview.
I just collect a lot of moving averages in one script and transform them in stand alone functions, so you can copy and paste in your script the MA that best fit your needs.
Furthermore, the chart shows which moving average has more smooth and which one has less lag and so on: in this way it is easy to graphically compare moving averages.
Combo Backtest 123 Reversal & CMOaDisparity Index This is combo strategies for get a cumulative signal. 
 First strategy
 This System was created from the Book "How I Tripled My Money In The 
 Futures Market" by Ulf Jensen, Page 183. This is reverse type of strategies.
 The strategy buys at market, if close price is higher than the previous close 
 during 2 days and the meaning of 9-days Stochastic Slow Oscillator is lower than 50. 
 The strategy sells at market, if close price is lower than the previous close price 
 during 2 days and the meaning of 9-days Stochastic Fast Oscillator is higher than 50.
 Second strategy
 The related CMOaDisparity Index article is copyrighted material from Stocks & Commodities Dec 2009
 My strategy modification.
 WARNING:
 - For purpose educate only
 - This script to change bars colors.
Combo Strategy 123 Reversal & CMOaDisparity Index This is combo strategies for get a cumulative signal. 
 First strategy
 This System was created from the Book "How I Tripled My Money In The 
 Futures Market" by Ulf Jensen, Page 183. This is reverse type of strategies.
 The strategy buys at market, if close price is higher than the previous close 
 during 2 days and the meaning of 9-days Stochastic Slow Oscillator is lower than 50. 
 The strategy sells at market, if close price is lower than the previous close price 
 during 2 days and the meaning of 9-days Stochastic Fast Oscillator is higher than 50.
 Second strategy
 The related CMO Disparity Index article is copyrighted material from Stocks & Commodities Dec 2009
 My strategy modification.
 WARNING:
 - For purpose educate only
 - This script to change bars colors.
Combo Backtest 123 Reversal & CMOfilt This is combo strategies for get a cumulative signal. 
 First strategy
 This System was created from the Book "How I Tripled My Money In The 
 Futures Market" by Ulf Jensen, Page 183. This is reverse type of strategies.
 The strategy buys at market, if close price is higher than the previous close 
 during 2 days and the meaning of 9-days Stochastic Slow Oscillator is lower than 50. 
 The strategy sells at market, if close price is lower than the previous close price 
 during 2 days and the meaning of 9-days Stochastic Fast Oscillator is higher than 50.
 Second strategy
 This indicator plots a CMO which ignores price changes which are less 
 than a threshold value. CMO was developed by Tushar Chande. A scientist, 
 an inventor, and a respected trading system developer, Mr. Chande developed 
 the CMO to capture what he calls "pure momentum". For more definitive 
 information on the CMO and other indicators we recommend the book The New 
 Technical Trader by Tushar Chande and Stanley Kroll.
 The CMO is closely related to, yet unique from, other momentum oriented 
 indicators such as Relative Strength Index, Stochastic, Rate-of-Change, etc. 
 It is most closely related to Welles Wilder`s RSI, yet it differs in several ways:
 - It uses data for both up days and down days in the numerator, thereby directly 
 measuring momentum;
 - The calculations are applied on unsmoothed data. Therefore, short-term extreme 
 movements in price are not hidden. Once calculated, smoothing can be applied to the 
 CMO, if desired;
 - The scale is bounded between +100 and -100, thereby allowing you to clearly see 
 changes in net momentum using the 0 level. The bounded scale also allows you to 
 conveniently compare values across different securities.
 WARNING:
 - For purpose educate only
 - This script to change bars colors.
Combo Strategy 123 Reversal & CMOfilt This is combo strategies for get a cumulative signal. 
 First strategy
 This System was created from the Book "How I Tripled My Money In The 
 Futures Market" by Ulf Jensen, Page 183. This is reverse type of strategies.
 The strategy buys at market, if close price is higher than the previous close 
 during 2 days and the meaning of 9-days Stochastic Slow Oscillator is lower than 50. 
 The strategy sells at market, if close price is lower than the previous close price 
 during 2 days and the meaning of 9-days Stochastic Fast Oscillator is higher than 50.
 Second strategy
 This indicator plots a CMO which ignores price changes which are less 
 than a threshold value. CMO was developed by Tushar Chande. A scientist, 
 an inventor, and a respected trading system developer, Mr. Chande developed 
 the CMO to capture what he calls "pure momentum". For more definitive 
 information on the CMO and other indicators we recommend the book The New 
 Technical Trader by Tushar Chande and Stanley Kroll.
 The CMO is closely related to, yet unique from, other momentum oriented 
 indicators such as Relative Strength Index, Stochastic, Rate-of-Change, etc. 
 It is most closely related to Welles Wilder`s RSI, yet it differs in several ways:
 - It uses data for both up days and down days in the numerator, thereby directly 
 measuring momentum;
 - The calculations are applied on unsmoothed data. Therefore, short-term extreme 
 movements in price are not hidden. Once calculated, smoothing can be applied to the 
 CMO, if desired;
 - The scale is bounded between +100 and -100, thereby allowing you to clearly see 
 changes in net momentum using the 0 level. The bounded scale also allows you to 
 conveniently compare values across different securities.
 WARNING:
 - For purpose educate only
 - This script to change bars colors.
Combo Backtest 123 Reversal & CMOav This is combo strategies for get a cumulative signal. 
 First strategy
 This System was created from the Book "How I Tripled My Money In The 
 Futures Market" by Ulf Jensen, Page 183. This is reverse type of strategies.
 The strategy buys at market, if close price is higher than the previous close 
 during 2 days and the meaning of 9-days Stochastic Slow Oscillator is lower than 50. 
 The strategy sells at market, if close price is lower than the previous close price 
 during 2 days and the meaning of 9-days Stochastic Fast Oscillator is higher than 50.
 Second strategy
    This indicator plots average of three different length CMO's. This indicator 
    was developed by Tushar Chande. A scientist, an inventor, and a respected 
    trading system developer, Mr. Chande developed the CMO to capture what he 
    calls "pure momentum". For more definitive information on the CMO and other 
    indicators we recommend the book The New Technical Trader by Tushar Chande 
    and Stanley Kroll.
    The CMO is closely related to, yet unique from, other momentum oriented 
    indicators such as Relative Strength Index, Stochastic, Rate-of-Change, etc. 
    It is most closely related to Welles Wilder?s RSI, yet it differs in several ways:
    - It uses data for both up days and down days in the numerator, thereby directly 
    measuring momentum;
    - The calculations are applied on unsmoothed data. Therefore, short-term extreme 
    movements in price are not hidden. Once calculated, smoothing can be applied to 
    the CMO, if desired;
    - The scale is bounded between +100 and -100, thereby allowing you to clearly see 
    changes in net momentum using the 0 level. The bounded scale also allows you to 
    conveniently compare values across different securities.
 WARNING:
 - For purpose educate only
 - This script to change bars colors.
Combo Strategy 123 Reversal & CMOavThis is combo strategies for get a cumulative signal. 
 First strategy
 This System was created from the Book "How I Tripled My Money In The 
 Futures Market" by Ulf Jensen, Page 183. This is reverse type of strategies.
 The strategy buys at market, if close price is higher than the previous close 
 during 2 days and the meaning of 9-days Stochastic Slow Oscillator is lower than 50. 
 The strategy sells at market, if close price is lower than the previous close price 
 during 2 days and the meaning of 9-days Stochastic Fast Oscillator is higher than 50.
 Second strategy
    This indicator plots average of three different length CMO's. This indicator 
    was developed by Tushar Chande. A scientist, an inventor, and a respected 
    trading system developer, Mr. Chande developed the CMO to capture what he 
    calls "pure momentum". For more definitive information on the CMO and other 
    indicators we recommend the book The New Technical Trader by Tushar Chande 
    and Stanley Kroll.
    The CMO is closely related to, yet unique from, other momentum oriented 
    indicators such as Relative Strength Index, Stochastic, Rate-of-Change, etc. 
    It is most closely related to Welles Wilder?s RSI, yet it differs in several ways:
    - It uses data for both up days and down days in the numerator, thereby directly 
    measuring momentum;
    - The calculations are applied on unsmoothed data. Therefore, short-term extreme 
    movements in price are not hidden. Once calculated, smoothing can be applied to 
    the CMO, if desired;
    - The scale is bounded between +100 and -100, thereby allowing you to clearly see 
    changes in net momentum using the 0 level. The bounded scale also allows you to 
    conveniently compare values across different securities.
 WARNING:
 - For purpose educate only
 - This script to change bars colors.
Combo Backtest 123 Reversal & CMOabsThis is combo strategies for get a cumulative signal. 
 First strategy
 This System was created from the Book "How I Tripled My Money In The 
 Futures Market" by Ulf Jensen, Page 183. This is reverse type of strategies.
 The strategy buys at market, if close price is higher than the previous close 
 during 2 days and the meaning of 9-days Stochastic Slow Oscillator is lower than 50. 
 The strategy sells at market, if close price is lower than the previous close price 
 during 2 days and the meaning of 9-days Stochastic Fast Oscillator is higher than 50.
 Second strategy
    This indicator plots the absolute value of CMO. CMO was developed by Tushar 
    Chande. A scientist, an inventor, and a respected trading system developer, 
    Mr. Chande developed the CMO to capture what he calls "pure momentum". For 
    more definitive information on the CMO and other indicators we recommend the 
    book The New Technical Trader by Tushar Chande and Stanley Kroll.
    The CMO is closely related to, yet unique from, other momentum oriented indicators 
    such as Relative Strength Index, Stochastic, Rate-of-Change, etc. It is most closely 
    related to Welles Wilder`s RSI, yet it differs in several ways:
        - It uses data for both up days and down days in the numerator, thereby directly 
          measuring momentum;
        - The calculations are applied on unsmoothed data. Therefore, short-term extreme 
          movements in price are not hidden. Once calculated, smoothing can be applied to 
          the CMO, if desired;
        - The scale is bounded between +100 and -100, thereby allowing you to clearly see 
          changes in net momentum using the 0 level. The bounded scale also allows you to 
          conveniently compare values across different securities.
 WARNING:
 - For purpose educate only
 - This script to change bars colors.
Combo Strategy 123 Reversal & CMOabs This is combo strategies for get a cumulative signal. 
 First strategy
 This System was created from the Book "How I Tripled My Money In The 
 Futures Market" by Ulf Jensen, Page 183. This is reverse type of strategies.
 The strategy buys at market, if close price is higher than the previous close 
 during 2 days and the meaning of 9-days Stochastic Slow Oscillator is lower than 50. 
 The strategy sells at market, if close price is lower than the previous close price 
 during 2 days and the meaning of 9-days Stochastic Fast Oscillator is higher than 50.
 Second strategy
    This indicator plots the absolute value of CMO. CMO was developed by Tushar 
    Chande. A scientist, an inventor, and a respected trading system developer, 
    Mr. Chande developed the CMO to capture what he calls "pure momentum". For 
    more definitive information on the CMO and other indicators we recommend the 
    book The New Technical Trader by Tushar Chande and Stanley Kroll.
    The CMO is closely related to, yet unique from, other momentum oriented indicators 
    such as Relative Strength Index, Stochastic, Rate-of-Change, etc. It is most closely 
    related to Welles Wilder`s RSI, yet it differs in several ways:
        - It uses data for both up days and down days in the numerator, thereby directly 
          measuring momentum;
        - The calculations are applied on unsmoothed data. Therefore, short-term extreme 
          movements in price are not hidden. Once calculated, smoothing can be applied to 
          the CMO, if desired;
        - The scale is bounded between +100 and -100, thereby allowing you to clearly see 
          changes in net momentum using the 0 level. The bounded scale also allows you to 
          conveniently compare values across different securities.
 WARNING:
 - For purpose educate only
 - This script to change bars colors.
Combo Backtest 123 Reversal & CMO & WMA This is combo strategies for get a cumulative signal. 
 First strategy
 This System was created from the Book "How I Tripled My Money In The 
 Futures Market" by Ulf Jensen, Page 183. This is reverse type of strategies.
 The strategy buys at market, if close price is higher than the previous close 
 during 2 days and the meaning of 9-days Stochastic Slow Oscillator is lower than 50. 
 The strategy sells at market, if close price is lower than the previous close price 
 during 2 days and the meaning of 9-days Stochastic Fast Oscillator is higher than 50.
 Second strategy
    This indicator plots Chande Momentum Oscillator and its WMA on the 
    same chart. This indicator plots the absolute value of CMO.
    The CMO is closely related to, yet unique from, other momentum oriented 
    indicators such as Relative Strength Index, Stochastic, Rate-of-Change, 
    etc. It is most closely related to Welles Wilder?s RSI, yet it differs 
    in several ways:
    - It uses data for both up days and down days in the numerator, thereby 
        directly measuring momentum;
    - The calculations are applied on unsmoothed data. Therefore, short-term 
        extreme movements in price are not hidden. Once calculated, smoothing 
        can be applied to the CMO, if desired;
    - The scale is bounded between +100 and -100, thereby allowing you to clearly 
        see changes in net momentum using the 0 level. The bounded scale also allows 
        you to conveniently compare values across different securities.
 WARNING:
 - For purpose educate only
 - This script to change bars colors.
Combo Strategy 123 Reversal & CMO & WMA This is combo strategies for get a cumulative signal. 
 First strategy
 This System was created from the Book "How I Tripled My Money In The 
 Futures Market" by Ulf Jensen, Page 183. This is reverse type of strategies.
 The strategy buys at market, if close price is higher than the previous close 
 during 2 days and the meaning of 9-days Stochastic Slow Oscillator is lower than 50. 
 The strategy sells at market, if close price is lower than the previous close price 
 during 2 days and the meaning of 9-days Stochastic Fast Oscillator is higher than 50.
 Second strategy
    This indicator plots Chandre Momentum Oscillator and its WMA on the 
    same chart. This indicator plots the absolute value of CMO.
    The CMO is closely related to, yet unique from, other momentum oriented 
    indicators such as Relative Strength Index, Stochastic, Rate-of-Change, 
    etc. It is most closely related to Welles Wilder?s RSI, yet it differs 
    in several ways:
    - It uses data for both up days and down days in the numerator, thereby 
        directly measuring momentum;
    - The calculations are applied on unsmoothed data. Therefore, short-term 
        extreme movements in price are not hidden. Once calculated, smoothing 
        can be applied to the CMO, if desired;
    - The scale is bounded between +100 and -100, thereby allowing you to clearly 
        see changes in net momentum using the 0 level. The bounded scale also allows 
        you to conveniently compare values across different securities.
Combo Backtest 123 Reversal & Chande Momentum Oscillator This is combo strategies for get a cumulative signal. 
 First strategy
 This System was created from the Book "How I Tripled My Money In The 
 Futures Market" by Ulf Jensen, Page 183. This is reverse type of strategies.
 The strategy buys at market, if close price is higher than the previous close 
 during 2 days and the meaning of 9-days Stochastic Slow Oscillator is lower than 50. 
 The strategy sells at market, if close price is lower than the previous close price 
 during 2 days and the meaning of 9-days Stochastic Fast Oscillator is higher than 50.
 Second strategy
    This indicator plots Chande Momentum Oscillator. This indicator was 
    developed by Tushar Chande. A scientist, an inventor, and a respected 
    trading system developer, Mr. Chande developed the CMO to capture what 
    he calls "pure momentum". For more definitive information on the CMO and 
    other indicators we recommend the book The New Technical Trader by Tushar 
    Chande and Stanley Kroll.
    The CMO is closely related to, yet unique from, other momentum oriented 
    indicators such as Relative Strength Index, Stochastic, Rate-of-Change, 
    etc. It is most closely related to Welles Wilder`s RSI, yet it differs 
    in several ways:
        - It uses data for both up days and down days in the numerator, thereby 
          directly measuring momentum;
        - The calculations are applied on unsmoothed data. Therefore, short-term 
          extreme movements in price are not hidden. Once calculated, smoothing 
          can be applied to the CMO, if desired;
        - The scale is bounded between +100 and -100, thereby allowing you to 
          clearly see changes in net momentum using the 0 level. The bounded scale 
          also allows you to conveniently compare values across different securities.
 WARNING:
 - For purpose educate only
 - This script to change bars colors
Combo Strategy 123 Reversal & Chande Momentum OscillatorThis is combo strategies for get a cumulative signal. 
 First strategy
 This System was created from the Book "How I Tripled My Money In The 
 Futures Market" by Ulf Jensen, Page 183. This is reverse type of strategies.
 The strategy buys at market, if close price is higher than the previous close 
 during 2 days and the meaning of 9-days Stochastic Slow Oscillator is lower than 50. 
 The strategy sells at market, if close price is lower than the previous close price 
 during 2 days and the meaning of 9-days Stochastic Fast Oscillator is higher than 50.
 Second strategy
    This indicator plots Chande Momentum Oscillator. This indicator was 
    developed by Tushar Chande. A scientist, an inventor, and a respected 
    trading system developer, Mr. Chande developed the CMO to capture what 
    he calls "pure momentum". For more definitive information on the CMO and 
    other indicators we recommend the book The New Technical Trader by Tushar 
    Chande and Stanley Kroll.
    The CMO is closely related to, yet unique from, other momentum oriented 
    indicators such as Relative Strength Index, Stochastic, Rate-of-Change, 
    etc. It is most closely related to Welles Wilder`s RSI, yet it differs 
    in several ways:
        - It uses data for both up days and down days in the numerator, thereby 
          directly measuring momentum;
        - The calculations are applied on unsmoothed data. Therefore, short-term 
          extreme movements in price are not hidden. Once calculated, smoothing 
          can be applied to the CMO, if desired;
        - The scale is bounded between +100 and -100, thereby allowing you to 
          clearly see changes in net momentum using the 0 level. The bounded scale 
          also allows you to conveniently compare values across different securities.
 WARNING:
 - For purpose educate only
 - This script to change bars colors.


