swami_money_flow
Description:
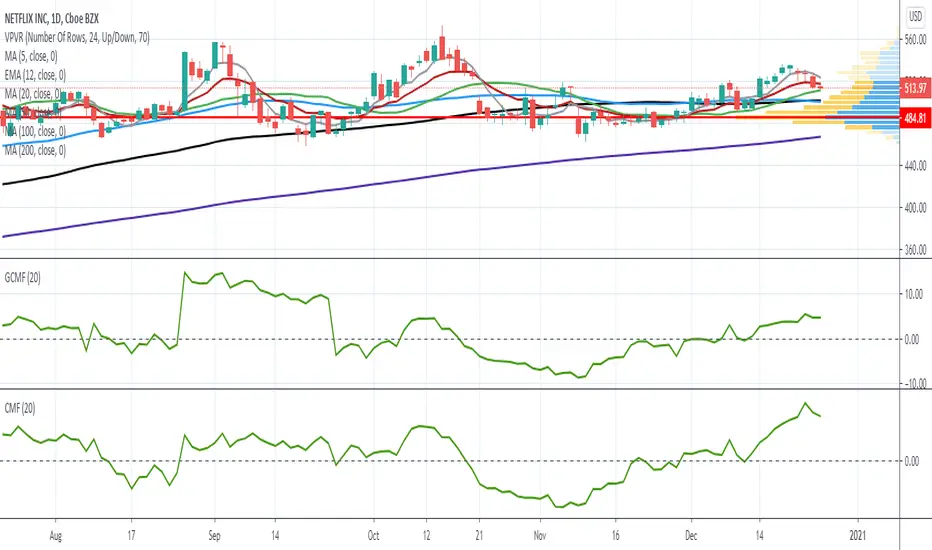
Chaikin Money Flow was an indicator that measuring of the volume-weighted average of accumulation and distribution over a specified period (as cited from Fidelity) developed by Marc Chaikin, aim to identify the changes in buying or selling momentum of an asset that leads to the increase or decrease of asset prices. In the original format, the cross above 0 of money flow depicts a buying pressure, while a cross under 0 means a selling pressure. In this indicator, the money flow was displayed in a swami chart, used for detecting a change not only in one specified period but instead in multiple periods at once. Sequencing from the very below, the indicator capture the shift in money flow in shorter lookback periods, going through the very above the indicator capture the change of money flow in greater lookback periods. The color is set to gradient from red as indicating the negative money flow, while green indicates a positive money flow. A smoothing function was given (from Ehlers smoothing function) to reduce noises.
Money Flow:
cmf = n-day sum of( (((close - low) - (high - close)) / (high - low)) x volume )/ n-day sum of volume
smoothed = (4*cmf + 3*cmf + 2*cmf + cmf )/10
Notes:
the Darker the color indicates the higher the value e.g. dark red means more selling pressure, and vice versa
if the color is a lineup in a one period, indicates a strong signal (both directions)
very below is for a shorter period, and increasing through to the longest (1 - 30 by default)
Other Example
Aliran Uang Chaikin / Chaikin Money Flow (CMF)

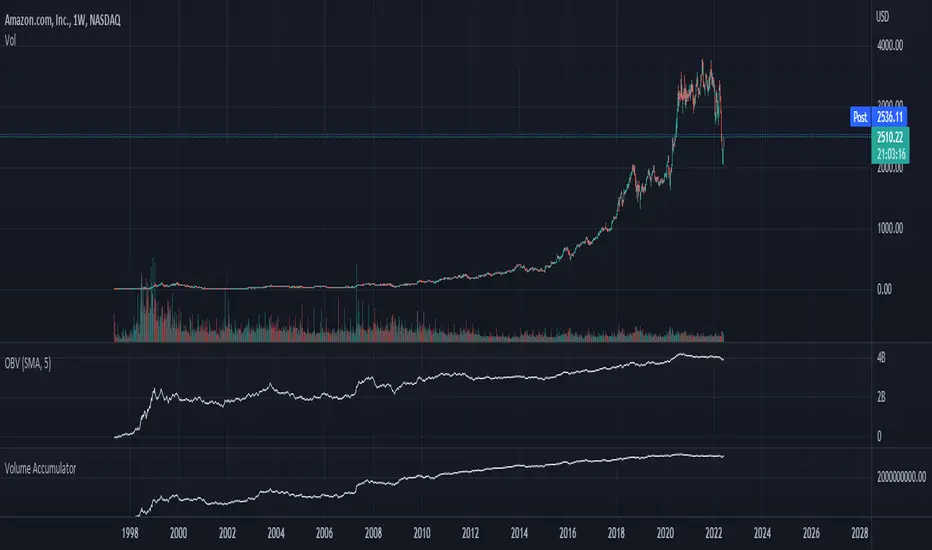
Chaikin Volume AccumulatorThe Volume Accumulator is used in technical analysis to identify strengths and weaknesses in a market. It is derived from the On Balance Volume indicator, except that instead of giving all the volume to bears on red days and bulls on green days it gives a proportional amount to both depending on the relative close price. As with many trading indicators, classic divergence between the VA and the close price may indicate an incoming reversal.
As a general rule of thumb:
Price Up:
VA up = clear uptrend
VA sideways = moderate uptrend
VA down = weak uptrend
Price Sideways:
VA up = accumulation
VA sideways = no bias
VA down = distribution
Price Down
VA up = weak downtrend
VA sideways = moderate downtrend
VA down = strong downtrend
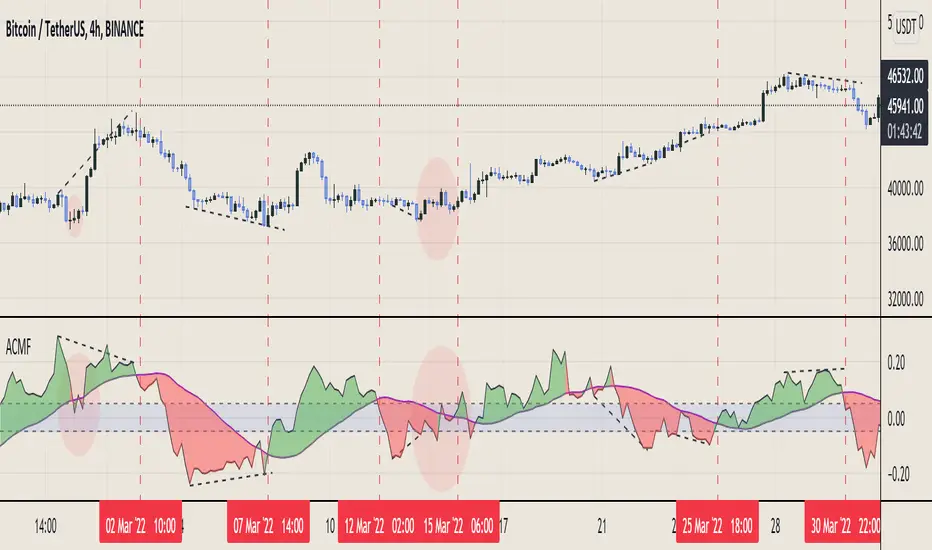
Aggregated Chaikin Money Flow - InFinitoModified Version of In-Built Chaikin Money Flow Indicator. Aggregated Volume is used for it's calculation + a couple of other features.
Aggregation code originally from Crypt0rus
***The indicator can be used for any coin/symbol to aggregate volume , but it has to be set up manually***
***The indicator can be used with specific symbol data only by disabling the aggregation option, which allows for it to be used on any symbol***
- Calculated based on Aggregated Volume instead of by symbol volume. Using aggregated data makes it more accurate and allows to compare volume flow between different kinds of markets (Spot, Futures , Perpetuals, Futures+Perpetuals and All Volume ).
- As well, in order to make the data as accurate as possible, the data from each exchange aggregated is normalized to report always in terms of 1 BTC. In case this indicator is used for another symbol, the calculations can be adjusted manually to make it always report data in terms of 1 contract/coin.
- Added Moving Average ( SMA , EMA , WMA , RMA, VWMA) that can be plotted to the CMF
- Changed 0 line to a small range which tends to be more relevant than the 0 line. This range can be manually modified
Things to look for:
- Divergences: Can be a very good reversal signal
- MA crossovers: Can be a very good confluent Buy/Sell signal
- Center range retests: CMF is normally defined as bullish above 0 and bearish below 0. In this case it is above or below the middle range. Even if the start of the move was missed. The retest of the middle range can give very good entries.
- Confluence of the latter
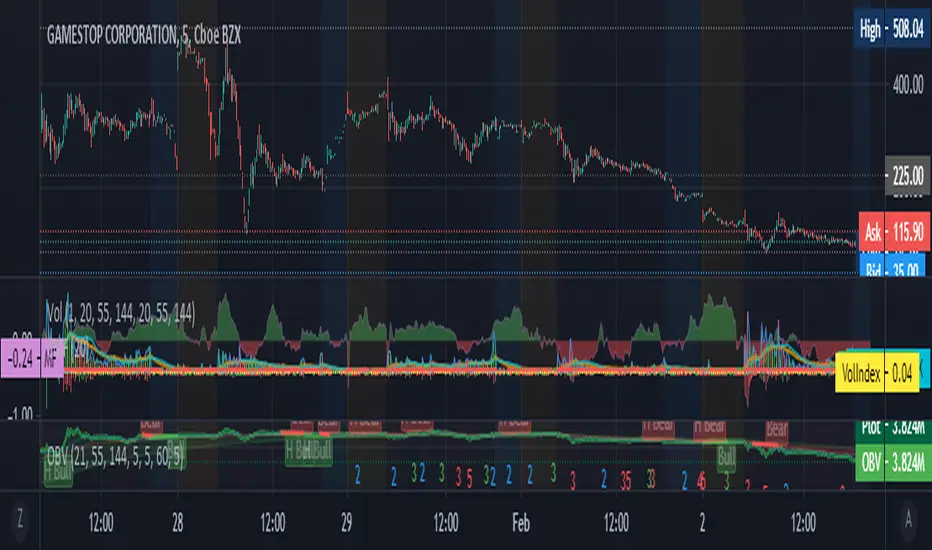
+ Breadth & Volumenote* If you've used my "+ Rate of Change Indicator", I am updating that without the OBV, which has been moved here. Just an FYI.
This "indicator" is basically a variety of indicators that measure volume, or accumulation/distribution. There's a bit of a story about how this came about but
it's not that interesting, so I'll spare you.
Indicators from which you may choose here are On Balance Volume (OBV), Money Flow Index (MFI), Chaikin Money Flow (CMF), Chaikin Oscillator, and Positive & Negative Net Volume.
I'll give a brief overview of these below, and if you want to educate yourself further on them you may. There are many web resources for that.
Most people are probably familiar with OBV. It's one of the more commonly used volume indicators, especially in the crypto crowd (at least amongst those traders I follow). It's basically a cumulative (doesn't oscillate around a midpoint) momentum indicator that measures volume of the current period versus volume of the previous period and adds it if price closed higher, but subtracts it if price closes lower. It's another way of using volume to confirm trend.
The MFI is a momentum indicator that measures the flow of money into and out of an asset over some period of time (user input). It's calculated using the RSI, so it can be used similarly to RSI (divergences, overbought, oversold, etc.), but of course unlike the RSI it's calculated primarily using volume and comparing the most recent candle close to the previous one (similar to OBV).
CMF is a volume-weighted average of accumulation and distribution over a some period of time (typically 21). It's a way of measuring accumulation versus
distribution in an asset, and oscillates around a zero line. You would use it similarly to any other oscillator, in that you can look for divergences, and general positive or negative momentum.
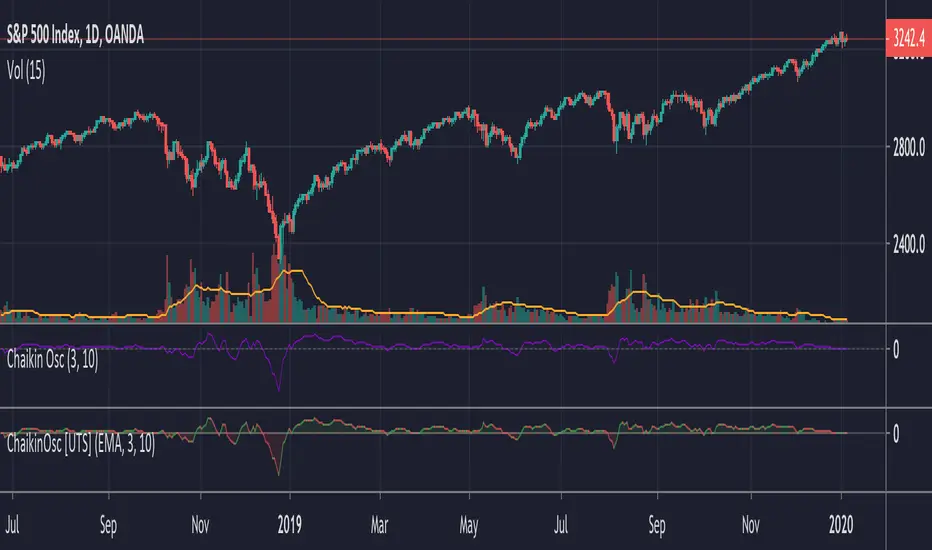
Chaikin Oscillator is basically a MACD (without signal line) of the accumulation and distribution index (or line--which is somehow different than simply accumulation and distribution). I haven't looked into these differences deeply, but if you look below at the calculations, and substituted 'ad' for 'accdist' you get very different readings. I actually did that, and what it looks like it would do is turn the actual Oscillator into a MACD signal line. So, by substituting 'ad' for 'accdist' (or the accumulation/distribution index) you produce a signal line of the Chaikin Oscillator.
Anyway, all that confusion out of the way, as I said, it's a MACD on the accumulation and distribution index, therefore it is another zero line oscillator, and similarly to CMF, it's a way of measuring price movements in the chart versus a/d. The zero line isn't just any old zero line, however, it is actually the accumulation distribution line. I've made an OBV version of this by substituting the OBV for AD, so if you prefer OBV maybe you will like that.
Pos. & Neg Net Volume is actually an indicator I had seen made by RafaelZioni. It basically takes net volume, calculates a cumulative of that, then subtracts a moving average of some period from the cumulative net volume in order to create a volume oscillator. Use it like the other oscillators!
Added Donchian Channels, moving averages, Bollinger Bands, colored everything, and alerts.
Enjoy!
Below I will post images with the different indicators, everything on default settings (except for lookback period, which I have adjusted to my personal preferences).
Above is an image with the MFI being compared to the RSI since they are very similar (MFI being basically a volume derivative of the RSI).
Chaikin Money Flow set to lookback of 13. You could probably extend that a bit if you wanted to smooth the line more.
Chaikin Oscillator and Chaikin Oscillator of OBV, with a zoomed in look below, to see the differences more clearly.
CO and COBV closer look.
Positive & Negative Net Volume.

Chaikin Money Flow + MACD + ATRHere I present you on of Trade Pro's Trading Idea: Chaikin Money Flow + MACD + ATR.
This strategy is not as profitable as it can be seen in one of his videos. In the forex market, the strategy could reach a maximum of 35% profitability.
I have, as some of my followers have requested, created an overview of the current position, risk and leverage settings in the form of a table.
Furthermore, one can again swap between short and long positions.
It is now possible to select or deselect individual indicators.
I have chosen the ATR alone as a take profit stop loss, as in his strategy.
A position is only triggered as soon as all prerequisites have been fulfilled and a command is executed. This prevents false triggering by bots and repainting.
-----------------------------------------------------------------------------------
How does the strategy work?
ENTRY
Long
The MACD indicator must be above the zero line.
Then the K line must cross the D line.
Finally, when this happens, the Money Flow Index must be above the zero line.
Short
Contrary to the premise of long positions.
EXIT
ATR Exit
The value of ATR at the time of buying is multiplied by the value entered in "Profit factor ATR" and "Stop factor ATR". As soon as the price reaches this value, it is closed.
Important
The script must be optimized for each coin or currency pair.
I will publish a guide to the strategy shortly. There I will explain how the table works and how to set the strategy correctly.
The results of the strategy are without commissions and leverage.
If you have any questions or feedback, please let me know in the comments.

CMF Velocity with 200EMA StrategyThis is a demonstration of my new Indicator - CMF Velocity - in a profitable trading strategy. It is able to take shorts when the close is less than the 200 EMA, and longs when the close is greater than the 200 EMA.
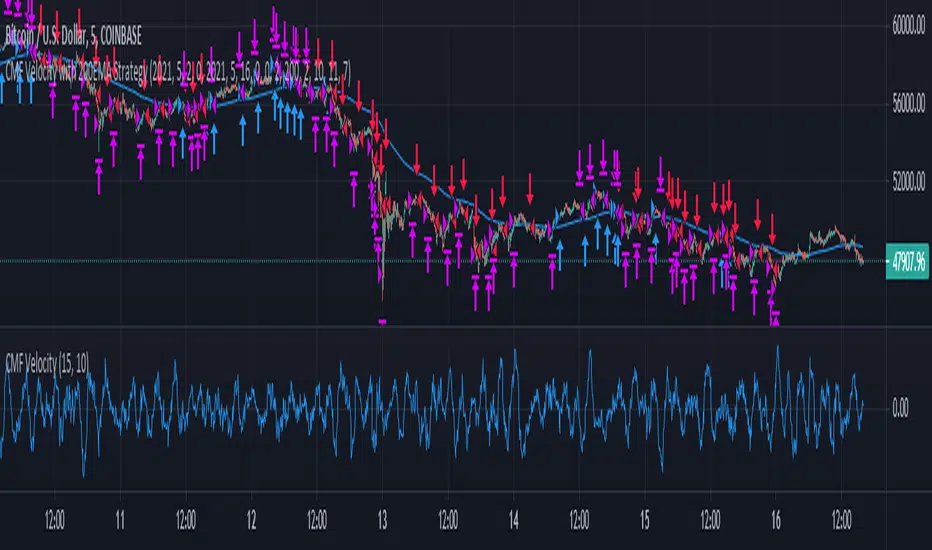
CMF VelocityCMF Velocity informs the trader of the speed at which the CMF Indicator is changing. This allows the trader to anticipate reversals in price action. Buy and Sell signals are generated when the value crosses the zero-line. This indicator is best used in combination with another indicator (Stochastic, MACD), although it does work quite nicely by itself. The default values work adequately, but some tuning may be needed for best results.

Multi Timeframe Chaikin Money Flow [Takazudo]This study is intented to be used as a part of buy/sell strategy.
Smooth feature: enable this to make CMF line smooth using MA
Bg Highlight: highlights the background depending on the bull/bear condition

Vol Buy/Sell %s, CMF, and Stocahstic Osc & UOPlots % Buy / Sell Volume , Chaikin Money Flow , Stochastic Oscillator, and Ultimate Oscillator on same axis, bound -1 to 1.
Show Volume Percentage, displaying buying as green and positive, selling as red and negative.
Showing the CMF, with green / red fill for positive / negative values.
Modified Stochastic Oscillator, converting bounds to -1 and 1, moving overbought/sold to -0.6 and 0.6, accordingly. Green fill (buy signal) with %D below -0.6 and %K lower than %D. Red fill (sell signal) with %D above 0.6 and %K higher than %D. Fill is between %D and bound, to be more visible.
Modified Ultimate Oscillator, converting bounds to -1 and 1, moving overbought/sold to -0.6 and 0.6, accordingly.

Chaikin Money Flow with Volume PercentsShowing the CMF, with green / red fill for positive / negative values, overlaid with Volume Percentage, displaying buying as green and positive, selling as red and negative.

Chaikin Money Flow IndicatorChaikin Money Flow (CMF) measures the amount of Money Flow Volume over a specific period, typically 20 or 21 days. The resulting indicator fluctuates above/below the zero line just like an oscillator.
Chaikin Money Flow sometimes only briefly crosses the zero line with a move that turns the indicator barely positive or negative. There is no follow-through and this zero line cross ends up becoming a whipsaw (bad signal).
To avoid the false positives, this implementation of the CMF two thresholds: the bullish threshold a little above zero (+0.05) and the bearish threshold a little below zero (-0.05).
Note: the two thresholds can be customized.
A like is always appreciated. :-)

Griffin-Chaikin Money FlowThis is an adaptation of the popular Chaikin Money Flow. The original calculation looks at closing price in relation to high and low. I developed a new calculation that includes the relationship
of close and open. One issue with the original calculation is that if the open = close then the calculation omits that bar. My calculation would include that bar and still calculate a positive or
negative money flow for that period based on the relationship of close to high and low for the period.
One major difference is that the CMF will return values between -1 and 1, my calculation is not range bound therefore absolute values for money flow will be much higher depending on the equity being charted.
In general the overall trend will be the same however there may be minor differences if there are many periods on the chart where there is a doji rather than a normal candlestick.
MACD TRADING SYSTEMThis is a conservative Trend Continuation Trading System.
Uses a Hull Moving Average to determine general trend direction
Uses MACD to initiate Trade entries
Uses a variant of Chaikin Money Flow for volume confirmation
Also uses the Average True Range (ATR) to determine take profit and stoploss.
Stoploss becomes trailing when take profit target has been hit.
I built it mainly for myself to use.
Wanted an objective trading system to take all the emotions out of my trading.

Ichimoku with MACD/ CMF/ TSI This is a strategy made from ichimoku cloud , together with MACD, Chaiking Money FLOW and True Strenght Index.
It can be adapted to any timeframe and any type of financial markets.
The idea behind its very simple,
We combine the long / short strategy from ichimoku, like cross between lines and below/above cloud together with histogram from MACD for positive/negative level. We use the same criteria for TSI and CMF, to check if its above or below 0 level.
Based on that we have a long or a short entry. The exit happens when the next options triggers, like for example we had long signal, we exit when we receive the short signal and viceversa.
It can be adapted with a risk management to apply a tp/sl level.
For any suggestion or details , let me know.

Bollinger Bands Strategy with Intraday Intensity IndexFor Educational Purposes. Results can differ on different markets and can fail at any time. Profit is not guaranteed.
This only works in a few markets and in certain situations. Changing the settings can give better or worse results for other markets.
This is a mean reversion strategy based on Bollinger Bands and the Intraday Intensity Index (a volume indicator). John Bollinger mentions that the Intraday Intensity Index can be used with Bollinger Bands and is one of the top indicators he recommends in his book. It seems he prefers it over the other volume indicators that he compares to for some reason. III looks a lot like Chaikin Money Flow but without the denominator in that calculation. On the default settings of the BBs, the III helps give off better entry signals. John Bollinger however is vague on how to use the BBs and it's hard to say if one should enter when it is below/above the bands or when the price crosses them. I find that with many indicators and strategies it's best to wait for a confirmation of some sort, in this case by waiting for some crossover of a band. Like most mean reversion strategies, the exit is very loose if using BBs alone. Usually the plan to exit is when the price finally reverts back to the mean or in this case the middle band. This can potentially lead to huge drawdowns and/or losses. Mean reversion strategies can have high win/loss ratios but can still end up unprofitable because of the huge losses that can occur. These drawdowns/losses that mean reversion strategies suffer from can potentially eat away at a large chunk of all that was previously made or perhaps up to all of it in the worst cases, can occur weeks or perhaps up to months after being profitable trading such a strategy, and will take a while and several trades to make it all back or keep a profitable track record. It is important to have a stop loss, trailing stop, or some sort of stop plan with these types of strategies. For this one, in addition to exiting the trade when price reverts to the middle band, I included a time-based stop plan that exits with a gain or with a loss to avoid potentially large losses, and to exit after only a few periods after taking the trade if in profit instead of waiting for the price to revert back to the mean.

Borsa Akademi Daytrade Hardcore by HassonyaThe Daytrade Hardcore Indicator is a strategy indicator for scalping in a 5-minute time period. Indicator was produced by me by following my way through the daytrade scanning options of my respected teacher ÖZKANFİLİZ(Best Scalper in Turkey). This scan consists of 14 conditions.
We use this scan in a 5-minute time frame. Daytrade Hardcore indicator can show us how many of these conditions in bars are listed and sequentially. You can open which one you want to use.
The Daytrade Hardcore indicator has a 3-day central pivot range. If you want, you can use it to strengthen your buying and selling decision. If the bars can hold on the 3x pivot line, you're safe.
Unless the 3-day central pivot line is shattered, you can move your stocks if you wish.
The strategy also includes DHardcore Trend, Stoploss, First Support, Indicator List, Support/Resistence and S/R Zones, 3dhx central pivot, pivot points, bollinger middle bands,
You should be careful if the 3dhx central pivot breaks down. If you want, you can stop here, you can follow it for new purchase. If you want, you can watch the support point for the new purchase or follow the list and wait for the 3-day pivot to go back when the list supports the 12-13-14 condition.
Sometimes the first support point and stoploss point may change, you can follow it yourself. In this case, you will use the bottom red first support point as a stoploss.
Thanks for your support
Türkçe Açıklama
-------------------
Daytrade Hardcore indikatörü 5 dakikalık periyotta scalping içindir. İndikatör saygıdeğer hocam Türkiye'deki en iyi scalper ÖZKANFİLİZ'in daytrade taraması baz alınarak tarafımdan yaratılmıştır. Bu taramada bildiğiniz üzere 14 tane şart bulunmaktadır. Tarama 17:30 dan kapanışa kadar 5 dakikalık zaman diliminde hisse takipçisinde izlenmektedir.
Taramayı 5 dakikalık zaman diliminde kullanıyoruz. Daytrade Hardcore indikaötür bize barlarda kaç tane şart olduğunu anlık tarayarak ister liste halinde istersek sequential şeklinde gösterebilir. İsterseniz tek tek isterseniz iki seçeneği de kullanabilirsiniz.
Daytrade Hardcore indikatöründe 3 günlük merkezi pivot aralığı bulunmaktadır. Eğer isterseniz, bunu alım satım olarak kullanabilirsiniz. Eğer barlar 3 günlük merkezi pivot çizgisi üzerinde tutunabiliyorsa bu size güvenli olduğunu gösterebilir. Alım için hacim, liste ve RMI'yi kollayabilirsiniz.
3 günlük merkezi pivot noktası kırılmadığı sürece isterseniz hissenizi taşıyabilirsiniz ve mavi çizgi aşağı kırıldığı zaman çıkış yapabilirsiniz.
Bu strateji indikatöründe DHardcore Trend, Stop Noktası, İlk Destek, İndikatör İsim Listesi, Destek/Direnç(Bölgeleri), 3dhx merkezi pivot, pivot noktaları, bollinder orta band içerir.
3 günlük merkezi pivot kırılımına dikkat etmelisiniz. Eğer isterseniz, bunu izleyerek stop olabilirsiniz ve takip ederek yeni alım noktası için izlersiniz. Bunun için isterseniz destek noktası izlersiniz isterseniz mavi çizgi üstünde tutunmasını beklersiniz.Bazı belirtiler nedir? Hacmin ortalama üzerine atması, Liste 12-13-14 olması, fiyatın bollinger orta band üstüne çıkması, fiyatın pivot üzerinde olması.
Bazı zamanlarda ilk destek noktasıyla stoploss noktası değişir. Bunu izleyip kararı kendiniz verebilirsiniz. Kırmızı noktalar mavi çizginin altına indiği zaman orası stoploss noktamız olacaktır.
Destek veren bütün dostlara teşekkür ederim.
Hayrını görün.

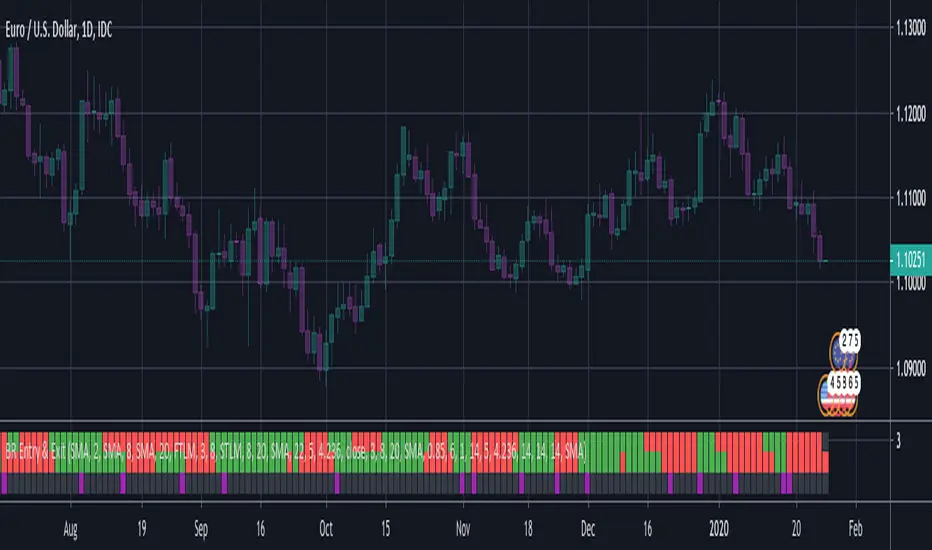
BERLIN Renegade - Entry and ExitThis is the entry and exit part of a larger algorithm called the "BERLIN Renegade". It is based on the NNFX way of trading, with some modifications.
For entry, it consists of Modified Chaikin Oscillator and Advanced MACD. The Advanced MACD is not available on its own, but all others are publically
available.
For exit it consists of the DIDI Index and the QQE line (original idea by Jie). Special thanks to Michael Kuczynski for the idea to include the FTLM digital filter.
Long signal: Green bars (upper and lower are both green)
Short signal: Red bars (upper and lower are both red)
Exit signal: Purple bars (bottom) - DIDI Index with QQE line
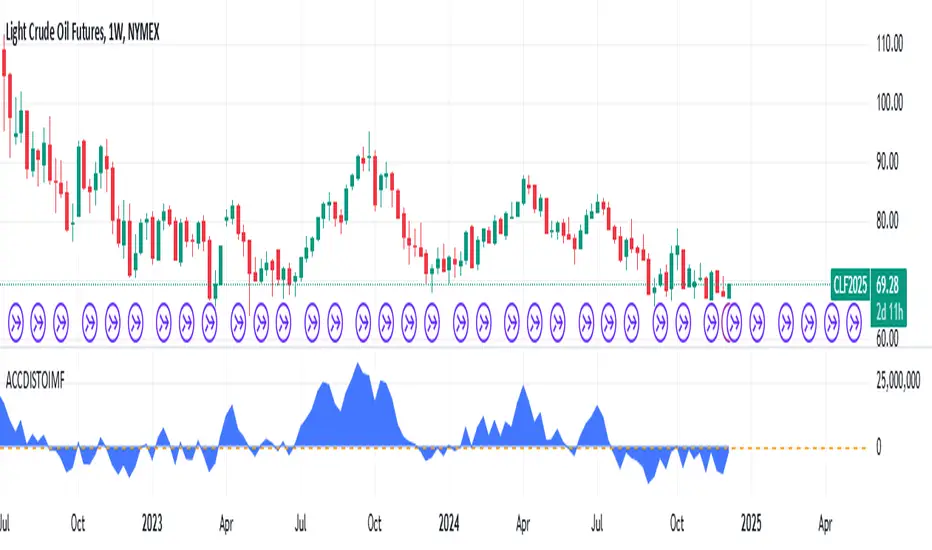
Accumulation/Distribution Open Interest Money Flow Hi, this script is the version of Accumulation / Distribution Money Flow (ADMF) that uses Open Interes ts in the required markets instead of Volume.
Can be set from the menu. (Futures/Others)
NOTE: I only modified this script.
The original script belongs to cl8DH.
Original of the script:
I think it will make a difference in the future and commodity markets.
Since the system uses CFTC data, use only for 1W timeframe.
With my best regards..
CMF Osc - Chaikin Money Flow Oscillator [UTS]The well known Chaikin Money Flow Indicator as oscillator version.
General Usage
The indicator runs both above and below zero, made to denote whether an asset is in a bullish (above zero) or bearish (below zero) trend.
It can be used to confirm trends, as well as spot possible trading signals due to divergences.
A benefit of the oscillator version is that it can produce LONG or SHORT signals on zero line cross.
Moving Averages
4 different Moving Averages are available:
EMA (Exponential Moving Average)
SMA (Simple Moving Average)
VWMA (Volume Weighted Moving Average)
WMA (Weighted Moving Average)

Chaikin Oscillator (ADL Oscillator) [UTS]The Chaikin Oscillator is basically an oscillator version of the Accumulation / Distribution Index, also known as ADL Indicator.
General Usage
The indicator runs both above and below zero, made to denote whether an asset is in a bullish (above zero) or bearish (below zero) trend.
It can be used to confirm trends, as well as spot possible trading signals due to divergences.
A benefit of the oscillator version is that it can produce LONG or SHORT signals on zero line cross.
Moving Averages
4 different Moving Averages are available:
EMA (Exponential Moving Average)
SMA (Simple Moving Average)
VWMA (Volume Weighted Moving Average)
WMA (Weighted Moving Average)
ADL - Accumulation Distribution Line [UTS]an underlying asset.
It is determined by the changes in price and volume. The volume acts as a weighting coefficient at the change of price — the higher the coefficient (the volume) is the greater the contribution of the price change (for this period of time) will be in the value of the indicator. The indicator is also known as Accumulation / Distribution Index.
Common known variants of this type of indicator are the On Balance Volume, Chaikin Oscillator or Chaikin Money Flow.
Based on www.metatrader5.com
SSL Chaikin BF 🚀Combined my earlier SSL Channel script with the Chaikin Money Flow indicator.
Link to the SSL Channel script here:
INSTRUCTIONS
Look at the background, the signals are represented by the colors.
Bright green = long signal from SSL Channel
Bright blue = long signal from Chaikin Money Flow
Bright red = short signal from SSL Channel
Bright orange = short signal from Chaikin Money Flow
Green = we should be in a long from one of the signals - ok to enter back in if we get stopped out and still green
Red = we should be in a short from one of the signals - ok to enter back in if we get stopped out and still red
White = no trade
SIGNAL GENERATION
The SSL calculation prints a channel on the chart consisting of 2 lines.
This strategy gives a Long signal when price closes above the top of these 2 lines and a Short signal when it closes below the bottom.
A long signal occurs when EITHER we get an SSL long cross OR the Chaikin MF crosses above the upper threshold.
A short signal occurs when EITHER we get an SSL short cross OR the Chaikin MF crosses below the lower threshold (see settings to adjust upper and lower threshold).
STOP LOSS AND RE-ENTRY
We use a fixed stop loss of 2%
If we get stopped out but we still have the conditions for our trade (i.e. we get stopped out of a long but the next candle still shows a long condition after closing) then we re-enter.
Note: The SSL signals are generated on a cross of the price and the channels but there is still an active long signal as long as price stays above the upper band, same for below the lower band for short. Similarly, the Chaikin signal occurs as long as the Chaikin line is above the upper threshold (or below the lower threshold if short).
Tested and optimised for XBT/USD on Bitmex.
