3B-Play Finder1 - Objective
2 - How to use (Theory)
3 - How to use (Grade System)
4 - Inputs
5 - Extras and Alerts
6 - Notes
Objective
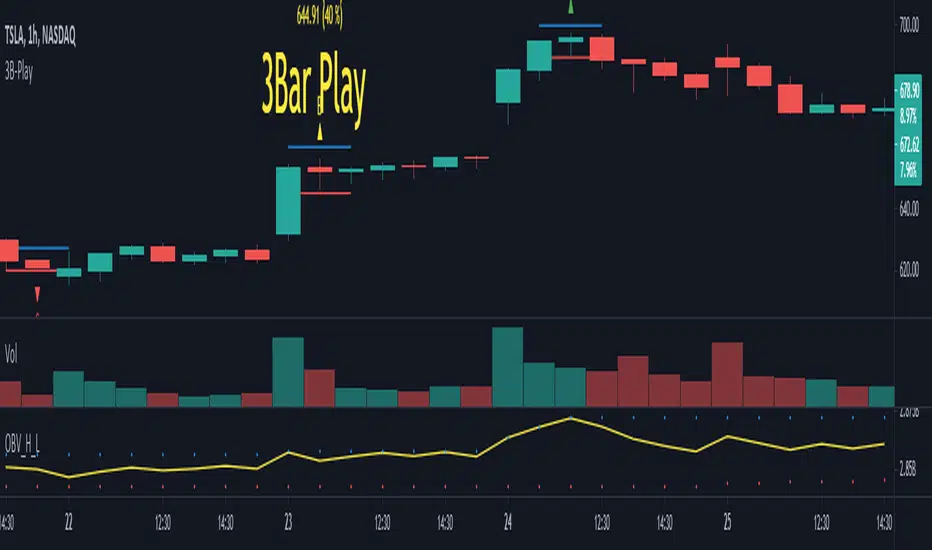
This script aims to mark 3 Bar play patterns (both short and long) by identifying them on the chart, with an arrow pointing up from long and down for short. Aswell, setting alerts based on grade.
Following the base concept, this script comes with a "grade" system (A, B, C), which aims to classify 3B-Play according to input parameters.
2 - How to use (Theory)
The pattern is described by a wide range Ignite bar followed by a narrow resting bar.
Long
Given a 3 Bar play pattern, with a wide range green bar, the entry point should be above the ignite and narrow bar wicks (high) with stop loss set below the resting bar wick low but within ignite wide range bar.
The exit depends on the chart analysis, and there is no set rule for it.
Short
Similar to long but is with a wide range red bar and entry is defined on wick low and stop-loss at wick high.
3 - How to use (Grade System)
Since 3B-play come in all sort of shapes, some are "textbook" perfect, others a bit more "loose". I set a grading system, to differentiate each one.
The way the 3 Bar play quality is determined is based on the percentage size of the resting bar in relation to igniting bar size, starting from de close. An example of how this works is the following. Note: enabling the extra draws lines helps visually to adjust the grades to your preference.
4 - Inputs
3B Quality section
Enable/disable each grade.
CONTROL LONG / SHORT
Set the percentage values for each grade.
Extras
Enable/Disable extra plots.
5 - Extras and Alerts
This script comes with an extra section, enabling it, draws lines on the max and min values, as well, showing the values in text and the set percentage.
Also, you can set alerts based on the grade and short/long, note you should set the alert to bar close to avoid pre-trigger warnings.
6 - Notes
The script can be shorted a lot, by only looking for a single 3 bar play, to less than 30 lines.
Candlestickpattern
Common Candlestick PatternsCommon Candlestick Patters Highlighter.
- TLS: Three Line Strike (Bearish and Bullish)
- AB: Advance Block
- IB: Inside Bar

SeaSide420 StrategyThis Strategy by SeaSide420 uses IchiMoku, Engulfing candles and 3 moving averages to find entry to buy and sell orders. It will hold buys and sells at the same time, it will close orders by StopLoss, or Trailing StopLoss or Target Profit. In the example chart here, only the trailing stop is active. It does have commission already included in this result. The initial test equity is set to 1 (1 BTC) so if you use this on say, a FOREX pair, you might want to check your settings, for example, set the initial equity to 100,000 USD as it normally is. I set this to 1 BTC to show that Holding 1 BTC for 2 years would not be as profitable as trading 1 BTC with this strategy for 2 years. The commission level is the same as Binance (0.1%), and the example pair is a Binance instrument, where Bitcoin trades can be in and out this way (CFD). Here it is shown on Daily chart, and with other timeframes/pairs, you may need to adjust the settings (MA period etc). New settings are achieved by you testing them yourself. This is published as an experimental script for use through API to do Automated trading on crypto exchanges. Questions welcome. Strategy free to use, Script private (PM me about it) I have not tested the alerts, but i did include alerts when open and close orders. Let me know if it works or not.

RSI StrictThis RSI stragety combine RSI with candle stick patterns to give entry signal.
When RSI is over bought or over sold. A long price tail signals a trend reversal in short term period.

HTF Candles by DGThigher timeframe (multi timeframe) candles
a simple study introducing new pine function box.new

[LixxChartz] Engulfing Candle Auto FinderProbably the most complicated script you have seen...
The Engulfing Candle Script that ACCTUALLY finds the engulfing candles.
This indicator is a part of my new script I am creating and I will be realising soon. Hope it helps.
I really don't understand why other people were making it so complicate LOL

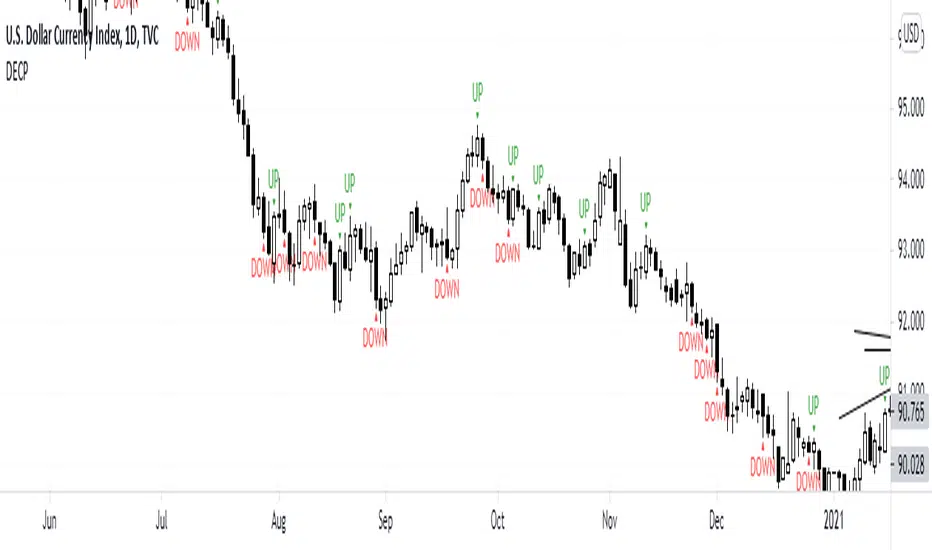
DECPDECP is simple and easy to use!
It detects bullish and bearish engulfing candlestick patterns.
After detecting the patterns I've said, it mentions that the pattern is going to continue its direction to up or down.
But remember candlestick patterns don't determine targets and it's possible that predicted directions fail.
So use it carefully and enjoy it!
CandletypesBackground information:
In my price action trading principles, I normally classify the candles into four types and look for trade opportunities. The candles are classified based whether buyers or sellers is dominating, namely, Indecisive candles, Decisive candles, Counter decisive candles and Strong decisive candles. Each of these can either be buyers or sellers dominant. This Philosophy I have attempted to convert into pine script for all traders to analyze and trade.
Indecisive candles: When the strength of the candle cannot be decided and we cant take any decision. Best is stay away. Something similar to conventional doji. Even though the strength is undecided, still the advantage can be towards either buyers or sellers favor. so we have Indecisive buy and indecisive sell candle
Decisive candles: When the strength is tipped towards the buyers or sellers, then I call Decisive bull or Decisive sell. This candles can be used to pyramid the trade position and not for initiating the trade, as many times it could be climatic also.
Counter decisive candles: These are candles , when the initial decision was towards one side and before closing of the candle, the decision was countered by the other side. There are counter decisive buy and sell. Counter decisive buy is actually a sell signal, because first buyers showed the strength later sellers overcome the buyers and become strong. Similarly counter decisive sell is a buy signal. These can be coupled with decisive candles for initiating the trading position
Strong decisive candles: These candles are good for initiating trade as a standalone alert system. It is something similar to pin bar, but more precise. we have both buy and sell and they have strong tendency to move in the direction of alert. These candles at right levels form a profitable trading system.
How the inputs are arranged:
There are total 8 candle types and whichever trader want can be selected for display.
By default,
The indecisive and decisive bull signals are placed on top of the charts as square and round green signal with title "IDB" and "DB"
The indecisive and decisive bear signals are placed on bottom of the charts as square and round red signal with title "IDS" and "DS"
The counter decisive and strong decisive signals are placed on the top and bottom of the candles.
In addition, the first candle of the day in any intraday time frame carries the label to display what type of candle is formed. This is very useful for making intraday trading.
This can be used freely by clicking to favorites. Source code is however not shared. please do contact for any additional info or modification.
happy trading

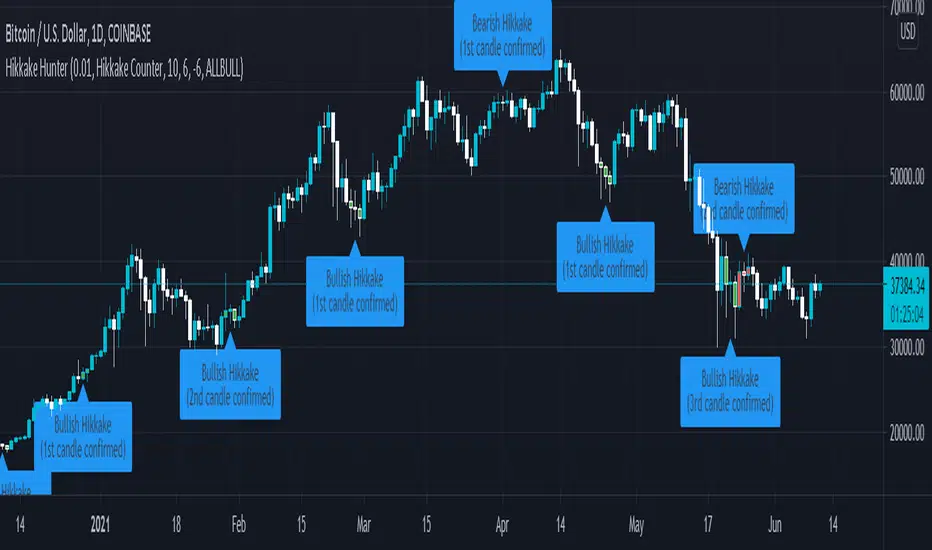
Hikkake HunterSimple script for finding Hikkake patterns in charts.
This script will:
- Identify bullish / bearish variants of the Hikkake pattern.
- Allow the user to change the color scheme for the bullish / bearish variants.
- Allow the user to specify which Hikkake patterns will be recognized by this hunter (specifically, allowing which of the three candles after the pattern appears will confirm the pattern).
Hammers & Stars StrategyOverview
This script trades basic hammer and shooting star candlestick patterns.
It's an extremely simple strategy with minimal filters, and according to my personal manual backtesting and automated trading results, performs best on the Daily chart on certain forex pairs.
It is intended to be traded on the forex markets but theoretically should work on all markets (especially if you optimize the settings).
The script also comes with complete AutoView automation for Oanda.
Make sure you've connected AutoView to TradingView and Oanda, then simply set an alert using the "alert() function calls only" condition and it will automatically execute trades based on whatever settings you've selected (only recommended for experienced traders - use at your own risk!)
If you're not sure how to set up AutoView, search "The Art of Trading AutoView Guide" on YouTube to find my detailed video guide.
Check out my website and YouTube channel for more information, scripts, resources and free Pine Script & trading lessons (link in my profile).
Best of luck with your trading!
- Matt / The Art of Trading
Settings Menu
Tooltips are included explaining what the various settings do, but here's a quick summary:
Strategy Settings
>= ATR Filter: Minimum size of entry candle compared to ATR
<= ATR Filter: Maximum size of entry candle compared to ATR
Stop Loss ATR: Stop loss multiplier (x ATR)
R:R: Risk:Reward profile
Fib Level: Used to calculate upper/lower third of candle. (For example, setting it to 0.5 will mean hammers must close >= 50% mark of the total candle size)
Start Date Filter: Date & time to begin trading from
End Date Filter: Date & time to stop trading
AutoView Oanda Settings
Use Oanda Demo: If turned on then oandapractice broker prefix will be used for AutoView alerts (demo account). If turned off then live account will be used
Use Limit Order: If turned on then AutoView will use limit orders. If turned off then market orders will be used (recommended to use limit order to mitigate spread issues)
Days To Leave Limit Order: This is your GTD setting (good til day)
Account Balance: Your account balance (used for calculating position size)
Account Currency: Your account balance currency (used for calculating position size)
Risk Per Trade %: Your risk per trade as a % of your account balance

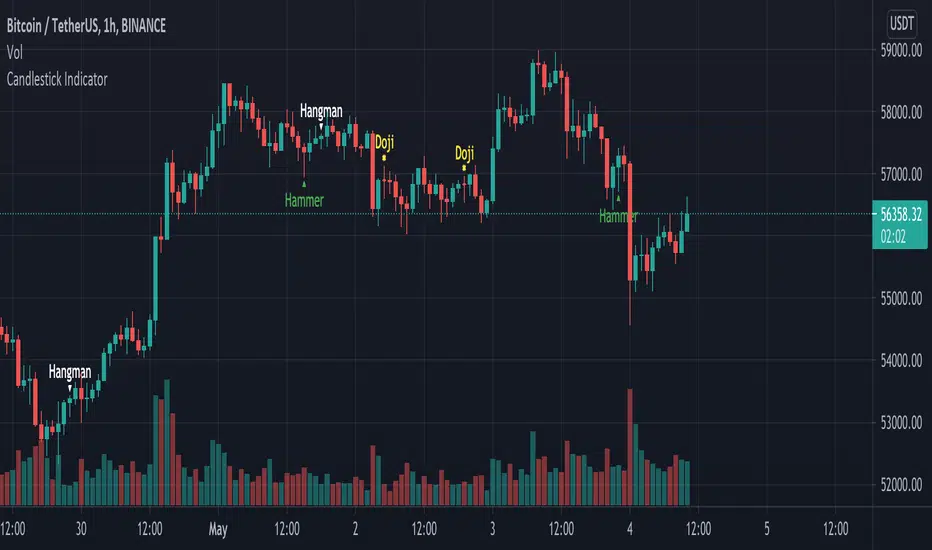
Candlestick Indicator by Crypto_AdhyetaA script to identify possible trend reversal based on Candlesticks. The correct candlestick type is identified by the relative position to Exponential Moving Average.
It detects:
- Hammer - if emerges during a downtrend (close below EMA(5)), the downtrend should end.
- Hanging Man - if comes after a advance (close above EMA(5)), the uptrend should end.
Confirmation:
- for aHammer not required
- a Hanging Man should be confirmed by lower close by the next candle
Japanese Candle Patterns Detector in Potential price zoneThis script would find the 8 famous "Japanese Candle Stick Patterns" in your chart.
Please be aware it find patterns in "Potential price zones" only, which help you to avoid none-important patterns during a price trend.
I used RSI and ATR in my codes to find best candle forms and price conditions.
Bellow patterns are detecting:
Hammer | ShootingStar | Engulfing Candle | Doji | Tweezers Top/Buttom | Three White Soldiers/Three Black Crows | Marubozu | Harami
* You can select your preferred patterns from indicator setting.
* Pattern names are abbreviated for better view on chart.
I hope it helps you to improve your trading.

Hammer & Shooting Star Candle DetectorHi guys
This script will help you to find Hammer candles and also Shooting star candles.
These candle patterns indicate price reversal probability and should evaluate in bigger price context before using as a signal.
I hope you find it helpful and enjoy it.
Please leave your comments for improving this script.

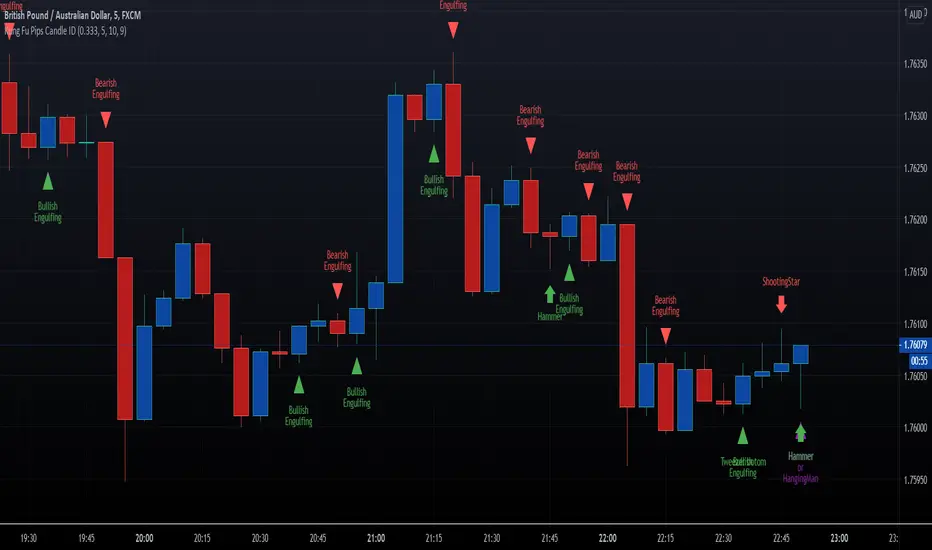
HFX Kung Fu Pips Candlestick Identifier by Trader ZThis indicator identifies the following candle stick patterns:
Bullish and Bearish Engulfing
Hammer/Hanging Man, Shooting Star
Tweezer Tops and Bottoms
Doji Star
Doji Gravestone
Made for trading Forex Binary Options but can be used in any market. When the candlestick pattern emerges the script will label the pattern. A helpful visual tool for your analysis.
Enjoy!!!!
Inside Bar FailureThis indicator provides a statistical report on the Inside Bar Failure candlestick pattern popularized by Trader Dante. Based on the chart's bars, it can improve your edge on any markets and timeframes.
The Inside Bar Failure pattern refers to an Inside Bar breakout that failed to sustain momemtum and closed back within it.
The report is broken down into the different following sections: retracement , invalidation , continuation and breakout .
Each of them provides hindsights about the pattern price behavior and brings answers to questions such as: How often does price retrace? Does the pattern often invalidate? If it doesn't then does it break in the pattern's direction? How far does price go? What are the odds of a false breakout?
While there are many ways to make use of the metrics, my favorite use case is for developing directional and daily/weekly biases while refining my stop/entry/target positioning.
Miscellaneous
Highlights patterns on the chart;
Supports bar to bar analysis and replay functionalities;
Provides counts on the `Data Window` panel for debugging or computing your own metrics;
Settings
Show/hide for toggling different sections;
Report coloring and offset on the x axis;
Gaining Access
This is a private indicator and is available only for my Patrons. You can reach my Patreon page below from the link in my signature.

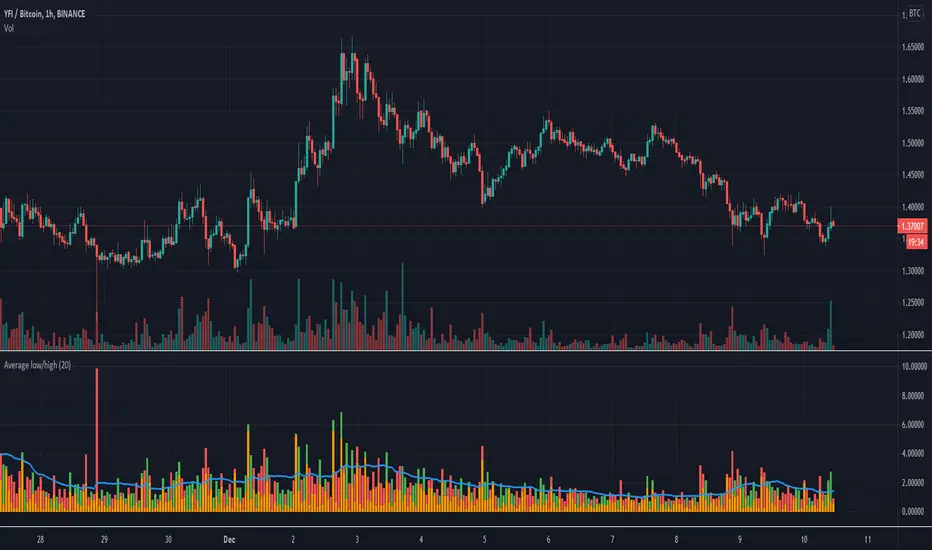
Candle Height in Percentage - ColumnsThis indicator calculates the difference in percentage between lows and highs of a candle. The orange bars show the height of the candle body (open/close) and the red/green on top show the percentage of the wicks (high/low). This assists in understanding the volatility of an asset. Showing this in percentages is more helpful in crypto. It also shows the Simple Moving Average of this data with the blue line.
Double Inside BarThis indicator provides a statistical report on the Double Inside Bar pattern. Based on the chart's bars, it can improve your edge on any markets and timeframes.
A Double Inside Bar refers to a contraction where price is consolidating while making consecutive lower highs and a higher lows.
The report is broken down into the different following sections: retracement , invalidation , continuation and breakout .
Each of them provides hindsights about the pattern price behavior and brings answers to questions such as: How often does price retrace? Does the pattern often invalidate? If it doesn't then does it break in the pattern's direction? How far does price go? What are the odds of a false breakout?
While there are many ways to make use of the metrics, my favorite use case is for developing directional and daily/weekly biases while refining my stop/entry/target positioning.
Miscellaneous
Highlights patterns on the chart;
Supports bar to bar analysis and replay functionalities;
Provides counts on the `Data Window` panel for debugging or computing your own metrics;
Settings
Show/hide for toggling different sections;
Report coloring and offset on the x axis;
Gaining Access
This is a private indicator and is available only for my Patrons. You can reach my Patreon page below from the link in my signature.

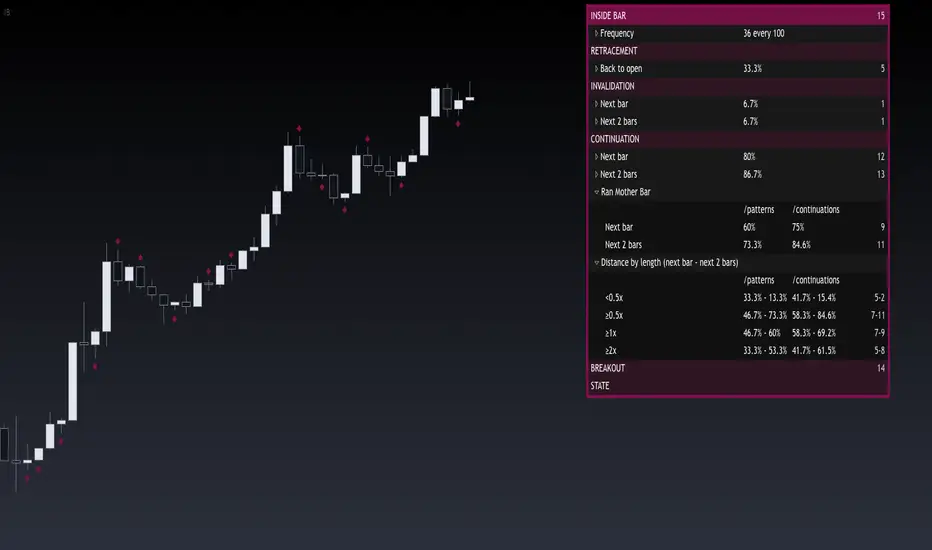
Inside BarThis indicator provides a statistical report on the Inside Bar candlestick pattern. Based on the chart's bars, it can improve your edge on any markets and timeframes.
The Inside Bar pattern refers to a candle that makes a lower high and a higher low.
The report is broken down into the different following sections: retracement , invalidation , continuation and breakout .
Each of them provides hindsights about the pattern price behavior and brings answers to questions such as: How often does price retrace? Does the pattern often invalidate? If it doesn't then does it break in the pattern's direction? How far does price go? What are the odds of a false breakout?
While there are many ways to make use of the metrics, my favorite use case is for developing directional and daily/weekly biases while refining my stop/entry/target positioning.
Miscellaneous
Highlights patterns on the chart;
Supports bar to bar analysis and replay functionalities;
Provides counts on the `Data Window` panel for debugging or computing your own metrics;
Settings
Show/hide for toggling different sections;
Report coloring and offset on the x axis;
Gaining Access
This is a private indicator and is available only for my Patrons. You can reach my Patreon page below from the link in my signature.
CSPDMost Advanced & Accurate CandleStick Pattern Detector
Looking All Over of All Markets for All Important Powerful Reversal | Corrective Patterns (25 type)
Filtering the Results with Optional Features like Oscillator, Bollinger Bands, Volume Confirmation, Prior and Following Candles Confirmation which are Fully Customizable.
With this you can detect:
Hammer | Shooting star
Inverted Hammer | Hanging
Long legged Doji | Dragonfly Doji | Gravestone Doji
Bullish tweezers | Bearish tweezers
Bullish inside bar | Bearish inside bar
Bullish three line strike | Bearish three line strike
Bullish engulfing | Bearish engulfing
Piercing line | Dark cloud cover
Bullish abandoned baby | Bearish abandoned baby
Morning star | Evening star
Three white soldiers | Three black crows
*Bullish kayo | *Bearish kayo
Features:
Prior and Following candles Confirmation
You can set prior and following candle as basic prerequisites for marking candles as pattern to make sure you are at the top or bottom of the trend.
Volume confirmation
You can active volume increasing confirmation for some of pattern with adjustable increase % relative to prior candle | candles.
Oscillator Confirmation
Active oscillator confirmation. Select your approved oscillator from list (Stochastic, RSI, StochRSI, MFI, StochMFI) then enter desired value for marking candles as bullish | bearish pattern.
Bollinger Bands Confirmation
Active BB confirmation. Configure your Bollinger Bands. Now only see the patterns which reached or crossed from Bands. Also you can enable BB clod to have your BB indicator at the same time.
Adjustable Flexibility and Precision
You can set tolerance% for Osc and BB Confirmation - each one separately - for more control.
Self-adaptability
The properties of markets change over time, for example the amplitude of fluctuations and the intensity of movements. The script is designed in such a way that you can examine the price history as a benchmark for changes in market properties to adopt determinants. Also you can control those manually.
Self-regulatory
The user has the ability to change input factors depending on their point of view.
Behind the pattern recognition algorithms, there are relationships and similarities in their appearance that cause them to be influenced by each other. Simultaneously with changing the determining factors of each pattern by you, script automatically adjusts other details in accordance with your changes.
Alerts
You can set for type of pattern or each one of pattern have been detected.
Fully Costumizable
All of these options can be change and adjust.
Note 1.
The patterns are based on extensive study of reference and famous sources and the experience of me and my friends in trading and analysis with price action methods.
Note 2.
Due to the Pine limitations in the number of outputs | plots for each script, our attempt has been made to select the best and most important patterns.
Note 3.
So far, many scripts have been written in this field, but our experience with all of them and even the build in version was not satisfactory, and this was the initial motivation for making the script.
We strive to improve progress and elimination of shortcomings and we will continue to make this better.
Note 4.
Through personal experience and based on the principles of market and candlestick psychology, we discovered a new type of pattern and named it as Kayo.
kayo is a two candle pattern which formed when:
1.We have a pivot point with prior candles as left bars and following candles as right bar. Pivot candle called as second candle.
2.In a bullish kayo, first candle must closed descending and second candle must closed as ascending. For bearish kayo vise versa.
3.In a bullish kayo, second candle's lower wick must be longer then upper wick.
4. A pattern marked as kayo when its conditions do not correspond to any of the other patterns(include the confirmation that user added), ie it has the last naming priority over the other patterns.
Note 5.
When you active confirmation options for patterns like hammer, engulf and etc which they conditions are like kayo in some extent, if they can't pass the confirmation steps, they can be marked as kayo pattern.
Note 6.
If you active volume confirmation for Three white soldiers | Three black crows, the confirmation get passed if the volume of forth or third candle increased as value as entered relative to volume EMA3 of 3 candles.
Note 7.
In a bullish pattern all highs of following candles MUST be higher than prior highs and all lows of following candles MUST be higher than prior lows. For bearish patterns vise versa.
This type of confirmation depends on High and Low NOT close!
Gift to price action lovers!
Support us with your like and comments. let us know your experience, points and idea to make this better together.

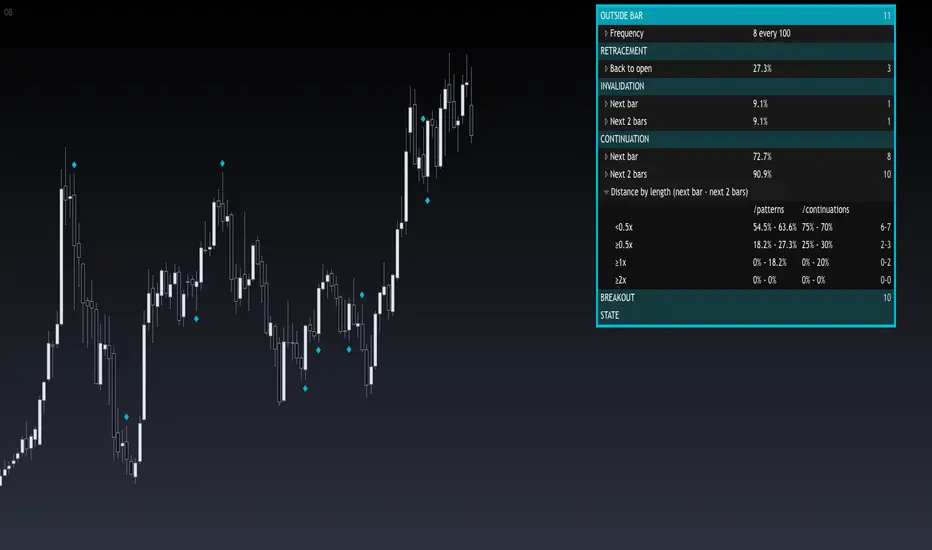
Outside BarThis indicator provides a statistical report on the Outside Bar candlestick pattern. Based on the chart's bars, it can improve your edge on any markets and timeframes.
Knowing there are many definitions about the Outside Bar pattern, here we're strictly referring to one bar's extremes beyond one other.
The report is broken down into the different following sections: retracement , invalidation , continuation and breakout .
Each of them provides hindsights about the pattern price behavior and brings answers to questions such as: How often does price retrace? Does the pattern often invalidate? If it doesn't then does it break in the pattern's direction? How far does price go? What are the odds of a false breakout?
While there are many ways to make use of the metrics, my favorite use case is for developing directional and daily/weekly biases while refining my stop/entry/target positioning.
Miscellaneous
Highlights patterns on the chart;
Supports bar to bar analysis and replay functionalities;
Provides counts on the `Data Window` panel for debugging or computing your own metrics;
Settings
Option for filtering patterns that close outside previous bar;
Show/hide for toggling different sections;
Report coloring and offset on the x axis;
Gaining Access
This is a private indicator and is available only for my Patrons. You can reach my Patreon page below from the link in my signature.
Engulfing BarThis indicator provides a statistical report on the Engulfing candlestick pattern. Based on the chart's bars, it can improve your edge on any markets and timeframes.
Knowing there are many definitions about the Engulfing pattern, here we're strictly referring to one bar's body that get engulfed by one other.
The report is broken down into the different following sections: retracement , invalidation , continuation and breakout .
Each of them provides hindsights about the pattern price behavior and brings answers to questions such as: How often does price retrace? Does the pattern often invalidate? If it doesn't then does it break in the pattern's direction? How far does price go? What are the odds of a false breakout?
While there are many ways to make use of the metrics, my favorite use case is for developing directional and daily/weekly biases while refining my stop/entry/target positioning.
Miscellaneous
Highlights patterns on the chart;
Supports bar to bar analysis and replay functionalities;
Provides counts on the `Data Window` panel for debugging or computing your own metrics;
Settings
Option for filtering patterns that close outside previous bar;
Show/hide for toggling different sections;
Report coloring and offset on the x axis;
Gaining Access
This is a private indicator and is available only for my Patrons. You can reach my Patreon page below from the link in my signature.

Trendy Bar Trend Color LiteLite version of the original Trendy Bar Trend Color
This will only color the candlestick body of your chart
Can be used with solid, hollow, renko, or any other chart type
Custom coloring for Highs, Lows, and consolidation is removed

Bullflag Candlestick pattern
A bull flag is essentially a small consolidation near the top of an upthrust. If we picture it as a candlestick pattern, it should have a big green candlestick + a small body red/green candle near the top of the top big green candle.
This script essentially help you identify these.
