SMC INDICATORMoney Concepts (SMC) toolkit and issues buy / sell signals. It includes:
Structure (market structure shifts via pivots)
Order Blocks (last bearish/bullish candle before a structure shift)
Fair Value Gaps (3-bar gap detection)
Simple liquidity sweep detection
Buy / Sell signal generation & alert conditions
Rectangle drawings and on-chart arrows
This is a practical, best-effort SMC indicator suitable for 15m/30m/1H/etc. — feel free to tweak lookbacks and filters in inputs.
Candlestick analysis
Fibonacci Auto Retracement & HTF candles ReferenceAdvanced Higher Timeframe (HTF) Candle & Fibonacci Viewer
Overview:
The Advanced HTF Candle & Fibonacci Viewer is a professional Trading View indicator designed to help traders overlay higher timeframe price structures onto lower timeframe charts. By combining daily candle analysis with precise Fibonacci retracement levels, this tool allows traders to identify critical support and resistance zones, potential breakouts, and retracement opportunities without switching charts.
Special Thanks:
This script includes a small part of coding inspired by Zeiierman, whose work on HTF analysis provided the foundation for visualizing higher timeframe structures. Full credit to Zeiierman for their invaluable contribution to the Trading View community.
Key Features:
1. Multi-Day HTF Range Display
Automatically displays high and low of 1–7 previous days.
Highlights candle bodies and wicks for clear structure visualization.
Ideal for spotting daily ranges and breakout levels.
2. Dynamic Fibonacci Levels
Standard levels: 0%, 11.8%, 23.6%, 38.2%, 50%, 61.8%, 76.4%, 88.2%, 100%.
Optional mid-level lines for intraday support/resistance identification.
Levels adjust automatically to reflect price action direction.
3. Customizable Labels & Colors
Adjustable text size, color, transparency, and offset.
Fully customizable candle and Fibonacci colors.
Mid-level lines can be shown or hidden for a cleaner look.
4. Persistent Levels
Levels remain until the next trading session or breakout, helping track trends and retracements consistently.
5. Multi-Timeframe Optimization
Works on any chart timeframe, from 1-minute to weekly charts.
Provides higher timeframe insight while trading on lower timeframes.
Why Traders Love This Indicator:
View higher timeframe action without switching charts.
Identify high-probability entry and exit zones.
Combine with other indicators for complete market analysis.
Useful for swing traders, day traders, and scalpers alike.
Customization Options:
Number of previous days (1–7)
Show/hide mid-level lines
Show/hide labels
Customize label size, color, and offset
Customize Fibonacci and candle colors
Ideal Use Cases:
Swing Trading: Identify daily key levels for entry, exit, and stop-loss.
Day Trading: Use HTF ranges on intraday charts to spot breakouts and reversals.
Fibonacci Analysis: Locate retracement zones efficiently.
Trend Confirmation: Validate trades with higher timeframe structure.
Summary:
The Advanced HTF Candle & Fibonacci Viewer is a powerful tool for traders seeking clarity, structure, and precision. With higher timeframe insight overlaid on active charts and proper credit to Zeiierman for their HTF coding contribution, this indicator helps traders make informed, confident decisions in any market.

Order Flow Proxy (Delta & Cumulative)This is an indicator I build with ChatGPT, it helps to analize the momentum of the market to correlate price and volume movement.

Money Volume • Buyers vs Sellers — @tgambinoxThis indicator estimates the total amount of money traded (Volume × Price)
and splits it between buyers and sellers based on each candle’s behavior.
It displays green bars for buyers and orange bars for sellers, allowing you to see
which side of the market is concentrating the capital.
Useful for detecting flow imbalances, buying/selling pressure,
and confirming price moves alongside total monetary volume (blue line).

Multi-Day SMAmade this script due to the frustration of not having the 5 day SMA added with the 10 20 and 50. I need the 5 SMA for my type of trading to determine when to sell with stocks showing exponential growth.
so heres this: Multi SMA
5 day SMA pink
10 day SMA white
20 day SMA blue
50 day SMA red
200 day SMA green

5 SMA/EMA_ZigzagThis indicator combines five SMA/EMA/WMA lines with the “ZigZag with Fibonacci Levels” indicator by LonesomeTheBlue, designed to trade according to Thắng Đoàn SMT’s method.
EMA 21 34
Zigzag 3/5


[Parth🇮🇳] Wall Street US30 Pro - Prop Firm Edition....Yo perfect! Here's the COMPLETE strategy in simple words:
***
## WALL STREET US30 TRADING STRATEGY - SIMPLE VERSION
### WHAT YOU'RE TRADING:
US30 (Dow Jones Index) on 1-hour chart using a professional indicator with smart money concepts.
---
### WHEN TO TRADE:
**6:30 PM - 10:00 PM IST every day** (London-NY overlap = highest volume)
***
### THE INDICATOR SHOWS YOU:
A table in top-right corner with 5 things:
1. **Signal Strength** - How confident (need 70%+)
2. **RSI** - Momentum (need OK status)
3. **MACD** - Trend direction (need UP for buys, DOWN for sells)
4. **Volume** - Real or fake move (need HIGH)
5. **Trend** - Overall direction (need UP for buys, DOWN for sells)
Plus **green arrows** (buy signals) and **red arrows** (sell signals).
---
### THE RULES:
**When GREEN ▲ arrow appears:**
- Wait for 1-hour candle to close (don't rush in)
- Check the table:
- Signal Strength 70%+ ? ✅
- Volume HIGH? ✅
- RSI okay? ✅
- MACD up? ✅
- Trend up? ✅
- If all yes = ENTER LONG (BUY)
- Set stop loss 40-50 pips below entry
- Set take profit 2x the risk (2:1 ratio)
**When RED ▼ arrow appears:**
- Wait for 1-hour candle to close (don't rush in)
- Check the table:
- Signal Strength 70%+ ? ✅
- Volume HIGH? ✅
- RSI okay? ✅
- MACD down? ✅
- Trend down? ✅
- If all yes = ENTER SHORT (SELL)
- Set stop loss 40-50 pips above entry
- Set take profit 2x the risk (2:1 ratio)
***
### REAL EXAMPLE:
**7:45 PM IST - Green arrow appears**
Table shows:
- Signal Strength: 88% 🔥
- RSI: 55 OK
- MACD: ▲ UP
- Volume: 1.8x HIGH
- Trend: 🟢 UP
All checks pass ✅
**8:00 PM - Candle closes, signal confirmed**
I check table again - still strong ✓
**I enter on prop firm:**
- BUY 0.1 lot
- Entry: 38,450
- Stop Loss: 38,400 (50 pips below)
- Take Profit: 38,550 (100 pips above)
- Risk: $50
- Reward: $100
- Ratio: 1:2 ✅
**9:30 PM - Price hits 38,550**
- Take profit triggered ✓
- +$100 profit
- Trade closes
**Done for that signal!**
***
### YOUR DAILY ROUTINE:
**6:30 PM IST** - Open TradingView + prop firm
**6:30 PM - 10 PM IST** - Watch for signals
**When signal fires** - Check table, enter if strong
**10:00 PM IST** - Close all trades, done
**Expected daily** - 1-3 signals, +$100-300 profit
***
### EXPECTED RESULTS:
**Win Rate:** 65-75% (most trades win)
**Signals per day:** 1-3
**Profit per trade:** $50-200
**Daily profit:** $100-300
**Monthly profit:** $2,000-6,000
**Monthly return:** 20-30% (on $10K account)
---
### WHAT MAKES THIS WORK:
✅ Uses 7+ professional filters (not just 1 indicator)
✅ Checks volume (real moves only)
✅ Filters overbought/oversold (avoids tops/bottoms)
✅ Aligns with 4-hour trend (higher timeframe)
✅ Only trades peak volume hours (6:30-10 PM IST)
✅ Uses support/resistance (institutional levels)
✅ Risk/reward 2:1 minimum (math works out)
***
### KEY DISCIPLINE RULES:
**DO:**
- ✅ Only trade 6:30-10 PM IST
- ✅ Wait for candle to close
- ✅ Check ALL 5 table items
- ✅ Only take 70%+ strength signals
- ✅ Always use stop loss
- ✅ Always 2:1 reward ratio
- ✅ Risk 1-2% per trade
- ✅ Close all trades by 10 PM
- ✅ Journal every trade
- ✅ Follow the plan
**DON'T:**
- ❌ Trade outside 6:30-10 PM IST
- ❌ Enter before candle closes
- ❌ Take weak signals (below 70%)
- ❌ Trade without stop loss
- ❌ Move stop loss (lock in loss)
- ❌ Hold overnight
- ❌ Revenge trade after losses
- ❌ Overleverge (more than 0.1 lot start)
- ❌ Skip journaling
- ❌ Deviate from plan
***
### THE 5-STEP ENTRY PROCESS:
**Step 1:** Arrow appears on chart ➜
**Step 2:** Wait for candle to close ➜
**Step 3:** Check table (all 5 items) ➜
**Step 4:** If all good = go to prop firm ➜
**Step 5:** Enter trade with SL & TP
Takes 30 seconds once you practice!
***
### MONEY MATH (Starting with $5,000):
**If you take 20 signals per month:**
- Win 15, Lose 5 (75% rate)
- Wins: 15 × $100 = $1,500
- Losses: 5 × $50 = -$250
- Net: +$1,250/month = 25% return
**Month 2:** $5,000 + $1,250 = $6,250 account
**Month 3:** $6,250 + $1,562 = $7,812 account
**Month 4:** $7,812 + $1,953 = $9,765 account
**Month 5:** $9,765 + $2,441 = $12,206 account
**Month 6:** $12,206 + $3,051 = $15,257 account
**In 6 months = $10,000 account → $15,000+ (50% growth)**
That's COMPOUNDING, baby! 💰
***
### START TODAY:
1. Copy indicator code
2. Add to 1-hour US30 chart on TradingView
3. Wait until 6:30 PM IST tonight (or tomorrow if late)
4. Watch for signals
5. Follow the rules
6. Trade your prop firm
**That's it! Simple as that!**
***
### FINAL WORDS:
This isn't get-rich-quick. This is build-wealth-steadily.
You follow the plan, take quality signals only, manage risk properly, you WILL make money. Not every trade wins, but the winners are bigger than losers (2:1 ratio).
Most traders fail because they:
- Trade too much (overtrading)
- Don't follow their plan (emotions)
- Risk too much per trade (blown account)
- Chase signals (FOMO)
- Don't journal (repeat mistakes)
You avoid those 5 things = you'll be ahead of 95% of traders.
**Start trading 6:30 PM IST. Let's go! 🚀**

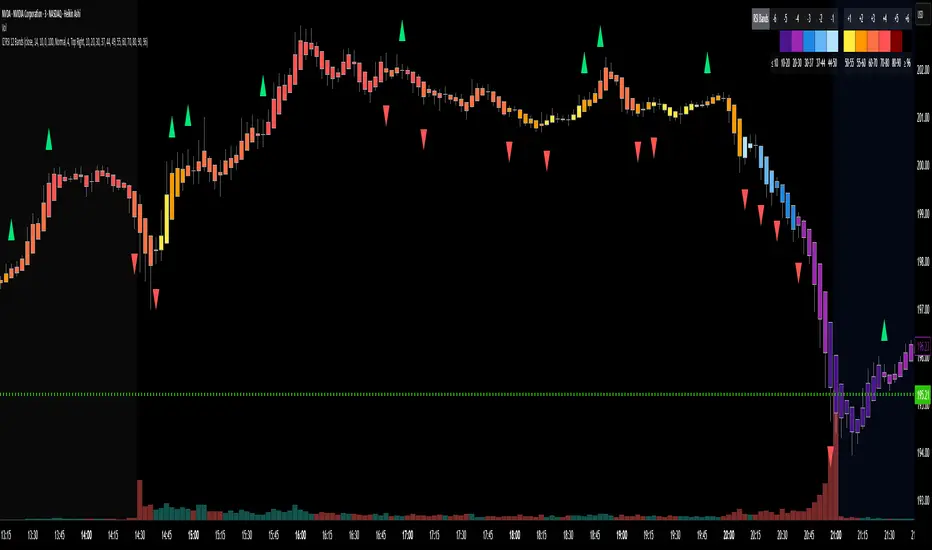
RSI Candle 12-Band SpectrumExperience RSI like never before. This multi-band visualizer transforms relative strength into a living color map — directly over price action — revealing momentum shifts long before traditional RSI signals.
🔹 12 Dynamic RSI Bands – A full emotional spectrum from oversold to overbought, colored from deep blue to burning red.
🔹 Adaptive Pulse System – Highlights every shift in RSI state with an intelligent fade-out pulse that measures the strength of each rotation.
🔹 Precision Legend Display – Clear RSI cutoff zones with user-defined thresholds and color ranges.
🔹 Multi-Timeframe Engine – Optionally view higher-timeframe RSI context while scalping lower frames.
🔹 Stealth Mode – Borders-only visualization for minimal chart impact on dark themes.
🔹 Complete Customization – Adjustable band levels, color palettes, and fade behavior.
🧠 Designed for professional traders who move with rhythm, not randomness.
Distance from Anchored VWAPjust a simple script allowing you to drop anchored vwap from a daily event ie earnings release, breaking news etc. Calculates distance from anchored vwap to also give you an idea on extension away from move for pull ins or pull backs

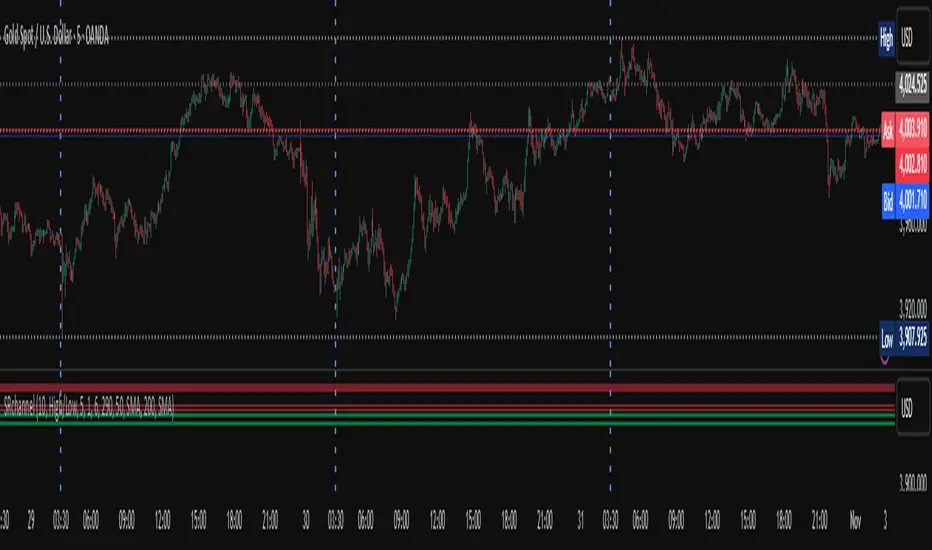
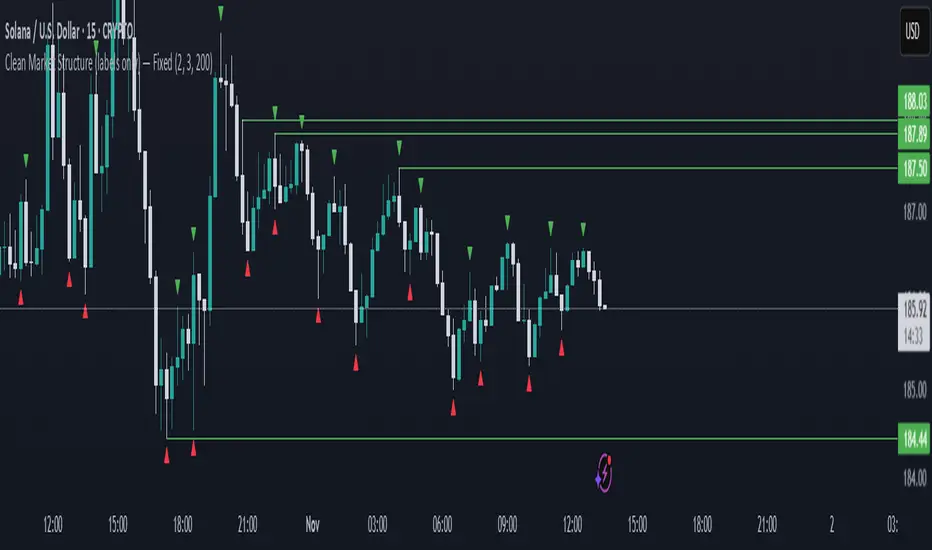
Clean Market Structures This indicator marks out the highs and lows on the chart, allowing traders to easily follow the market structure and identify potential liquidity zones.
Highs are plotted when an up candle is followed by a down candle, marking the highest wick of that two-candle formation.
Lows are plotted when a down candle is followed by an up candle, marking the lowest wick of that two-candle formation.
These levels often act as liquidity pools, since liquidity typically rests above previous highs and below previous lows .
By highlighting these areas, the indicator helps traders visualize where price may seek liquidity and react, making it useful for structure-based and liquidity-driven trading strategies.

Highs and Lows MarkerIndicator Description – Highs and Lows Marker
This indicator identifies swing highs and swing lows based on a simple two-candle pattern structure:
High Formation (Swing High):
A High is marked when a bullish candle (Candle Up) is immediately followed by a bearish candle (Candle Down).
The High value is taken as the highest wick price between the two candles in this formation.
This represents a potential short-term resistance or turning point in the market.
Low Formation (Swing Low):
A Low is marked when a bearish candle (Candle Down) is immediately followed by a bullish candle (Candle Up).
The Low value is taken as the lowest wick price between the two candles in this formation.
This represents a potential short-term support or reversal area.
Trend Break + MSB + Fibo Zone [v1.0] dnmSure! Here’s the English translation of your text:
---
Swings are determined based on the HH/LL structure.
If the candle close breaks the swing level, the MSB (Market Structure Break) is confirmed.
After the MSB, the last swing high/low is used to calculate the Fibonacci 0.5 and 0.618 levels.
On the chart, the 0.5–0.618 range is displayed as a colored box.
A green box appears for a bullish break, and a red box appears for a bearish break.

Weekend GapsIdentify unfilled gaps between the close of one candle and the opening of the next. Optimised for weekends by highlighting friday gaps with a triangle and bold horizontal ray. Depending on the price action required to fill it, they are marked in red or green.

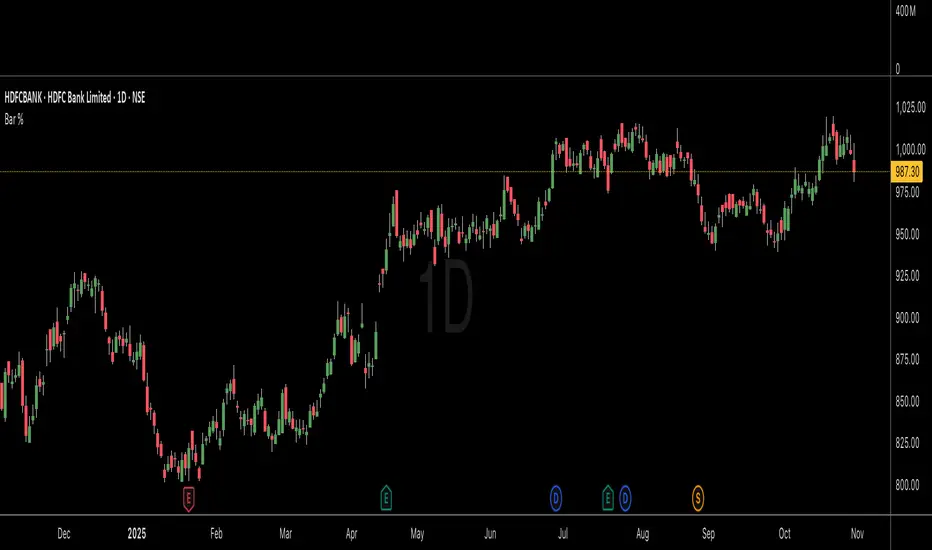
EMA100 Breakout by shubhThis indicator is a clean, price-action-based breakout system designed for disciplined trend trading on any timeframe — especially for Nifty and Bank Nifty spot, futures, and options charts.
It uses a single 100-period EMA to define trend direction and waits for decisive candle closes across the EMA to trigger potential entries.
The logic ensures only one active trade at a time, enforcing patience and clarity in decision-making.
⚙️ Core Logic
Buy Setup
A bullish candle closes above the 100 EMA while its open was below the EMA.
Entry occurs at candle close.
Stop-Loss (SL): Low of the signal candle.
Target (TP): 4 × the SL distance (Risk : Reward = 1 : 4).
Sell Setup
A bearish candle closes below the 100 EMA while its open was above the EMA.
Entry occurs at candle close.
Stop-Loss (SL): High of the signal candle.
Target (TP): 4 × the SL distance.
Trade Management
Only one trade may run at a time (either long or short).
New signals are ignored until the current position hits SL or TP.
Transparent labels show Entry, SL, and TP levels on chart.
Dotted lines visualize active Stop-Loss (red) and Target (green).
Exit markers:
✅ Target Hit
❌ Stop Loss Hit
🧠 Key Advantages
Simple and transparent trend-following logic.
Enforces disciplined “one-trade-at-a-time” behavior.
High risk-to-reward (1 : 4).
Works across timeframes — 5 min to Daily.
Ideal for intraday and positional setups.
📊 Suggested Use
Apply on Nifty / Bank Nifty spot or futures charts.
Works on any instrument with clear momentum swings.
Best confirmation when EMA 100 acts as dynamic support/resistance.
⚠️ Disclaimer
This script is for educational and research purposes only.
It is not financial advice or an invitation to trade.
Always backtest thoroughly and manage risk responsibly before applying in live markets.

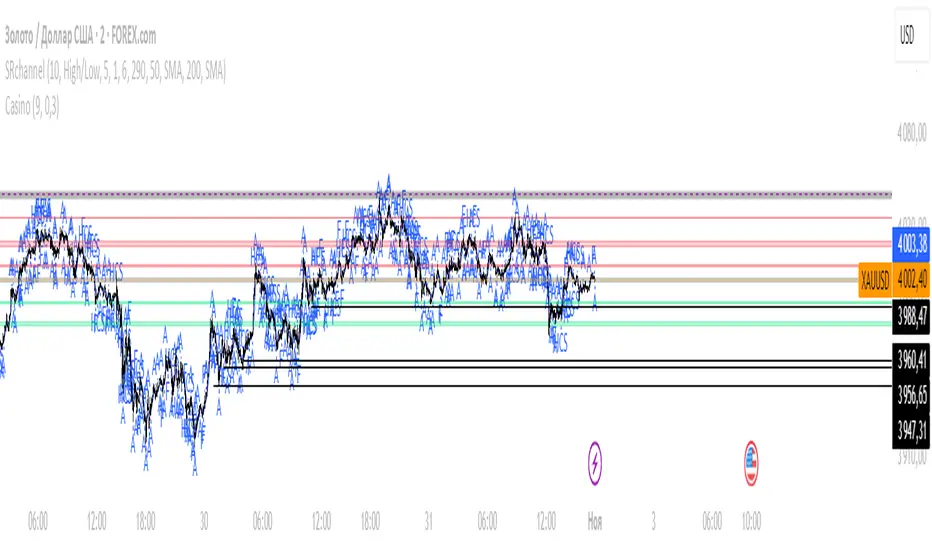
Mean Reversion Scalping by XtramaskAvoid using this indicator in aggressively trending markets . Best in Non Treanding Markets

Simple Market Structure Highs & Lows🟩 Simple Market Structure Highs & Lows
This indicator identifies basic swing highs and lows based on simple two-candle patterns, giving traders a clean visual view of short-term market structure shifts.
🔹 Logic
A Swing High (H) is marked when an up candle is followed by a down candle.
→ The high of the up candle (the first one) is plotted as a green triangle above the bar.
A Swing Low (L) is marked when a down candle is followed by an up candle.
→ The low of the down candle (the first one) is plotted as a red triangle below the bar.
🔹 Purpose
This tool helps visualize basic market turning points — useful for:
Spotting local tops and bottoms
Analyzing market structure changes
Identifying potential entry/exit zones
Building the foundation for BOS/CHoCH strategies
🔹 Notes
Works on any timeframe or asset.
No repainting — signals appear after the confirming candle closes.
Simple and lightweight — ideal for traders who prefer clean structure visualization.

Volatility Trend Indicator+Overview:
This indicator measures short-term volatility relative to its smoothed average. It helps visualize whether volatility is increasing or decreasing over time. The indicator is displayed in a separate pane below the main price chart for clarity
Visualization:
Line plot of V
Zero line for reference
Background color highlights trend:
Green → rising volatility
Red → falling volatility
Yellow → neutral

Price Movement Alert with Previous Close as ReferenceFunctionality of the Indicator
The "Price Movement Alarm with Previous Day Close as Reference" indicator is a tool that helps you monitor significant price levels based on the previous day's closing price. The indicator calculates both decline and rise thresholds in specified percentages to generate potential trade alerts. The lines on the chart represent these thresholds, and the corresponding labels show the exact percentage.
Usage Instructions:
Previous Day's Close: The indicator uses the previous trading day's close as the reference point.
Setting Decline and Rise Percentages: You can adjust the alarm levels for declines (e.g., 0.5%, 1.0%, 1.5%, 2.0%, 2.5%, 3.0%) and rises (e.g., 0.5%, 1.0%, 1.5%, 2.0%, 2.5%, 3.0%).
Lines and Labels: The indicator draws lines on the chart and displays labels that indicate the percentage of price movement.
Market Analysis: Analyze the price movements to make potential trading decisions.
Market in Equilibrium:
A market is in equilibrium when price movements remain within a narrow range (e.g., 0.5% to 1%). During this phase, volatility is low, and there are no significant price changes.
Market not in Equilibrium:
A market is not in equilibrium when price movements fall outside the narrow range (e.g., above 1%). During this phase, larger price movements can occur, often triggered by news or economic events.

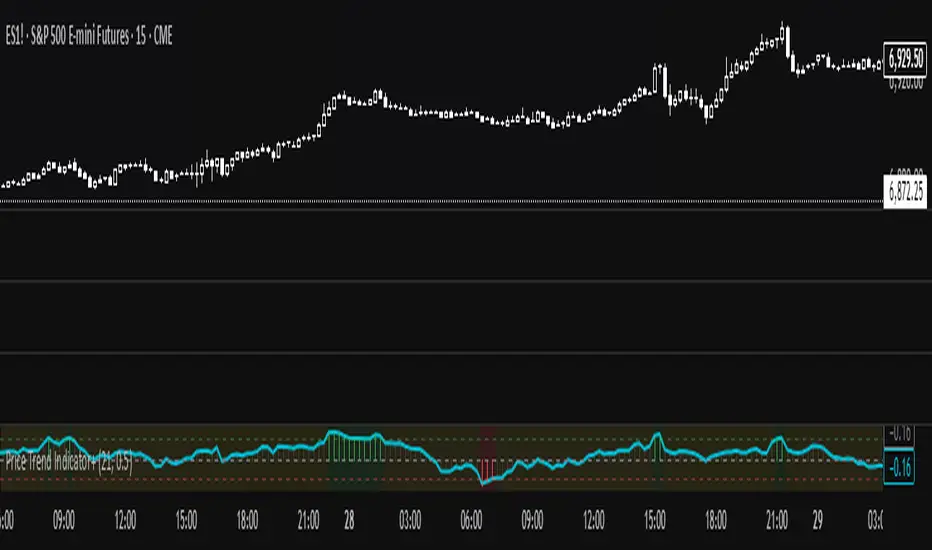
Price Trend Indicator+🧠 What it does
It measures the ratio between average price change and average volatility, showing how strong and directional the trend is.
Higher positive values = steady uptrend, negative = downtrend
📊 How to interpret
P value Signal Meaning
P > +0.5 🟢 Strong Uptrend Steady upward movement
0 < P < +0.5 🟡 Mild Uptrend Weak upward bias
P ≈ 0 ⚪ Sideways No clear direction
-0.5 < P < 0 🟠 Mild Downtrend Slight downward bias
P < -0.5 🔴 Strong Downtrend Consistent decline