Heikin-Ashi Candle ColoringThis script will change the color of normal candlesticks to the color that the corresponding Heikin-Ashi candles would have.
This allows to spot a trend or a trend reversal just by looking at candles, without using Heikin-Ashi candles, which distort the appearance of a typical chart.
Candles

AnyChartI changed few lines of code from TradingView's original Open Interest indicator to make this one. I wanted to compare other charts to while entering my trade like looking at BTC when trading in alts. It has option to view any chart. Add other things to improve your analysis.

Candles HTF on Heikin Ashi ChartThis script enables calling and/or plotting of traditional Candles sources while loaded on Heikin Ashi charts.
Thanks to @PineCoders for rounding method: www.pinecoders.com
Thanks to @BeeHolder for method to regex normalize syminfo.tickerid.
NOTICE: While this script is meant to be utilized on Heikin Ashi charts it does NOT enable ability to backtest!
NOTICE: For more info on why non standard charts cannot be reliably backtested please see:
NOTICE: This is an example script and not meant to be used as an actual strategy. By using this script or any portion thereof, you acknowledge that you have read and understood that this is for research purposes only and I am not responsible for any financial losses you may incur by using this script!

Hollow, Filled Candle IndicatorColored, Filled and Hollow candles similar to Stock charts candles.
Hollow Black - close > prior close and close > open
Filled Black - close > prior close and close < open
Hollow Red - close < prior close and close > open
Filled Red - close < prior close and close < open

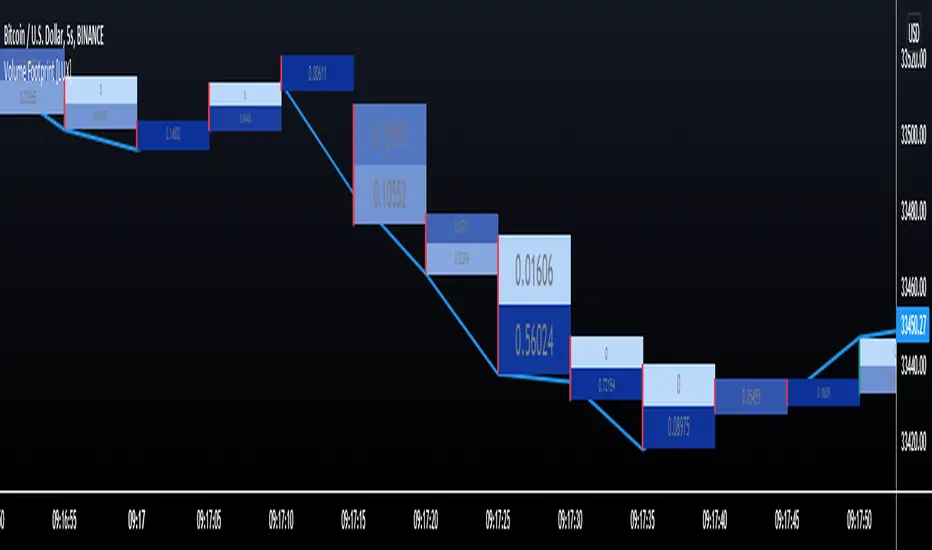
Volume Footprint [LuxAlgo]This indicator estimates a volume footprint using tick data. The script automatically separates a candle into equidistant intervals with a width obtained from the average true range or a user-given width.
Settings
Method: Interval width calculation method. This ultimately determines the number of intervals separating one candle.
Width (At the right of Method): Atr period or user given width depending on the selected method. A lower user-given width would divide a candle into a higher number of intervals.
As Percent: Returns the accumulated volume within each interval as a percentage of the total candle volume.
Style
Display Type: Determines the appearance of the returned volume footprint.
Trend Color: Color to use based on whether a candle is bullish or bearish.
Usage
When applied to a chart, the user will be asked to select the settings to use for the volume footprint. Note that changing the settings afterward will reset the volume footprint, removing previously generated footprints.
A new footprint will appear on the confirmation of a new bar, as such this version might only be useful in lower timeframes.
A volume footprint allows users to see the number of contracts exchanged within a candle interval. It can as such be seen as some kind of intrabar volume profile.
This can be useful to see areas of interest within a candle.
Different Appearance
By default, the volume footprint makes use of colored boxes with a color based on whether the candle was bullish or bearish.
Another appearance that gives additional information is the gradient type, which uses intervals color based on the number of contracts exchanged within an interval relative to the total volume of the candle. A higher number of contracts within an interval would return a darker color by default.
The regular display type makes use of boxes with a single color, with lines on the side indicating whether the candle was bullish or bearish.
Circular Candlestick ChartAn original (but impractical) way to represent a candlestick chart using circles arc.
The most recent candles are further away from the circle origin. Note that OHLC values follow a clockwise direction. A higher arc length would indicate candles with a higher body or wick range.
The Length settings determine the number of past candles to be included in the circular candlestick chart. The Width setting control the width of the circular chart. The Spacing setting controls the space between each arcs. Finally, the Precision settings allow obtaining a more precise representation of candles, with lower values returning more precise results, however, more precision requires a higher amount of lines. Settings are quite hard to adjust, using a higher length might require a lower spacing value.
Additionally, the script includes two pointers indicating the location of the 75 (in blue) and 25 (in orange) percentiles. This allows obtaining an estimate of the current market sentiment, with the most recent arcs laying closer to the 75 percentile pointer indicating an up-trend.
This new way to represent candlesticks might be useful to more easily identify candles clusters or to find new price patterns. Who knows, we know that new ways to see prices always stimulate traders imagination.
See you next year.

Box Trading (Malaysia Stock Market)1. This indicator is based on the Box Trading technique for Malaysia Stocks Market.
2. The idea of Box Trading is to use high / low of the last Marubozu Candle as a Resistance / Support for the next following candles.
3. If price of next following candle breaks Resistance of high in the last Marubozu Candle, then enter the trade.
4. If price of next following candle breaks Support of low in the last Marubozu Candle, then exit the trade.
5. Hence, this indicator will indicate:
- Last Marubozu Candle in a green bar (preset at 6 bids/pips for Malaysia Stocks Market)
- Resistance Line on the top of the high last Marubozu Candle
- Support Line at the bottom of the low last Marubozu Candle
- T calculation starting from T0 until T+3 (to indicate days before short selling occur at T+4 of Malaysia Stocks Market)
- Blue up triangle to indicate price breakout the Resistance Line
- Red down triangle to indicate price breakout the Support Line
6. However, this indicator is only designed for Malaysian Stocks Market as the script is based on the bids/pips calculation of the Malaysian Stocks Market. Nevertheless, I let the script open for everyone to modify it based on your own preference markets/instruments.
7. Hope you guys enjoy it. Thanks.

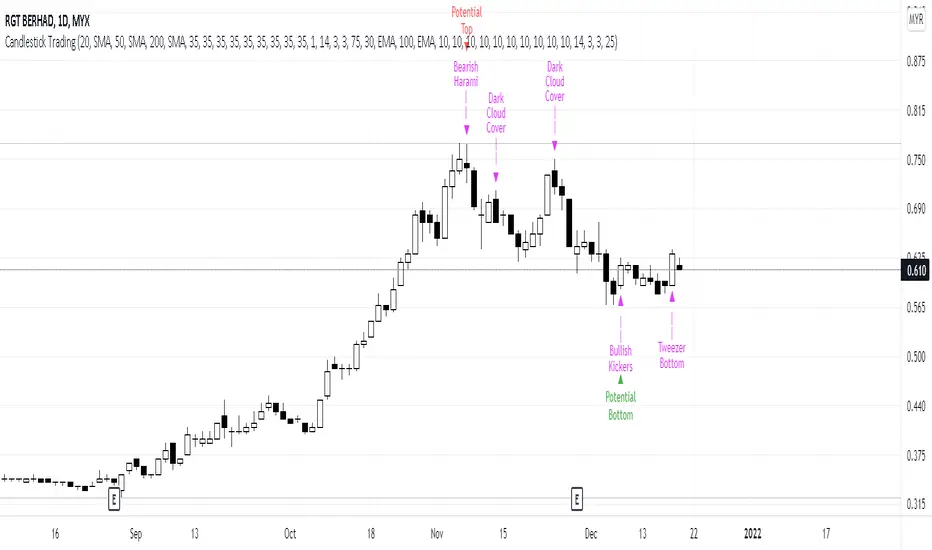
Candlestick Trading (Malaysia Stock Market)1. This indicator will indicate signals of bearish/bullish candlestick as below:
- 10 Bear Candles: Dark Cloud Cover, Bearish Kickers, Bearish Engulfing, Evening Star, Three Black Crows, Hanging Man, Shooting Star, Tweezer Top, Bearish Harami, Doji
- 10 Bull Candles: Piercing, Bullish Kickers, Bullish Engulfing, Morning Star, Three White Soldiers, Hammer, Inverted Hammer, Tweezer Bottom, Bearish Harami, Doji
2. In order for the Bear Candle signals to appear, these conditions should be met:
- Price must be above MA 1 (preset at SMA 20)
- Price must be above MA 2 (preset at SMA 50)
- Price must be above MA 3 (preset at SMA 200)
- In the range of specified trading days (preset at latest 10 days of trading)
3. For a strong bearish signal, a namely 'Potential Top' signal will appear on the top of the bearish candlestick signal. This 'Potential Top' signal will only appear under the condition of:
- Stochastic is at overbought area (preset at 75%)
4. In order for the Bull Candle signals to appear, these conditions should be met:
- Price must be in between MA 4 (preset at EMA 30) and MA 5 (preset at EMA 100)
- In the range of specified trading days (preset at latest 10 days of trading)
5. For a strong bullish signal, a namely 'Potential Bottom' signal will appear at the bottom of the bullish candlestick signal. This 'Potential Bottom' signal will only appear under the condition of:
- Stochastic is at oversold area (preset at 25%)
6. This indicator can help one to enter/exit a trade based on the bullish/bearish candlestick patterns that appear at the beginning/end of a trend, especially when the 'Potential Bottom/Top' appears with any of bullish/bearish candlestick signal.
7. However, this indicator is only designed for Malaysian Stocks Market as the script is based on the bids/pips calculation of the Malaysian Stocks Market. Nevertheless, I let the script open for everyone to modify it based on your own preference markets/instruments.
8. Hope you guys enjoy it. Thanks.
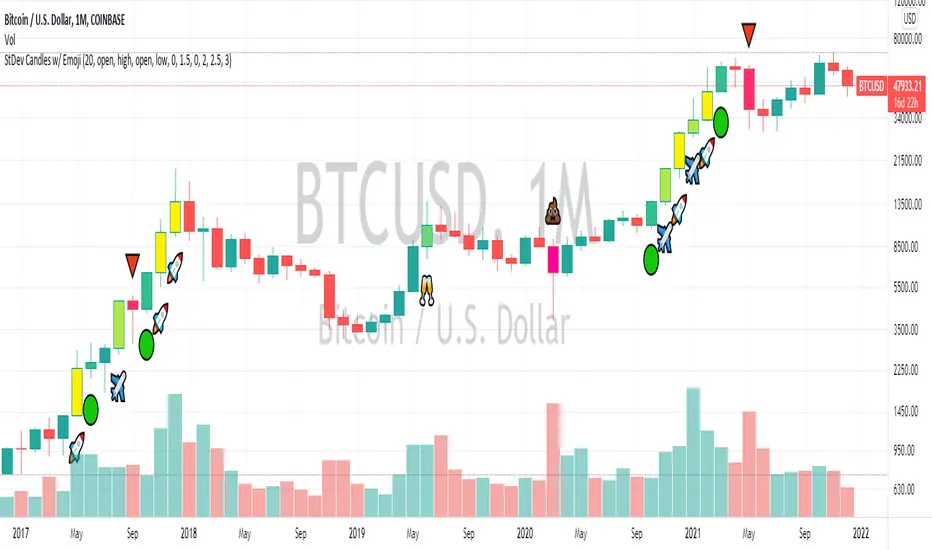
Standard Deviation Candles (With Emoji)In crypto, significant price moves can be a sign of continuation or reversal. This script measures if price move is greater than a certain number of standard deviations vs. previous periods, then alters bar colours and/or prints an emoji signal.
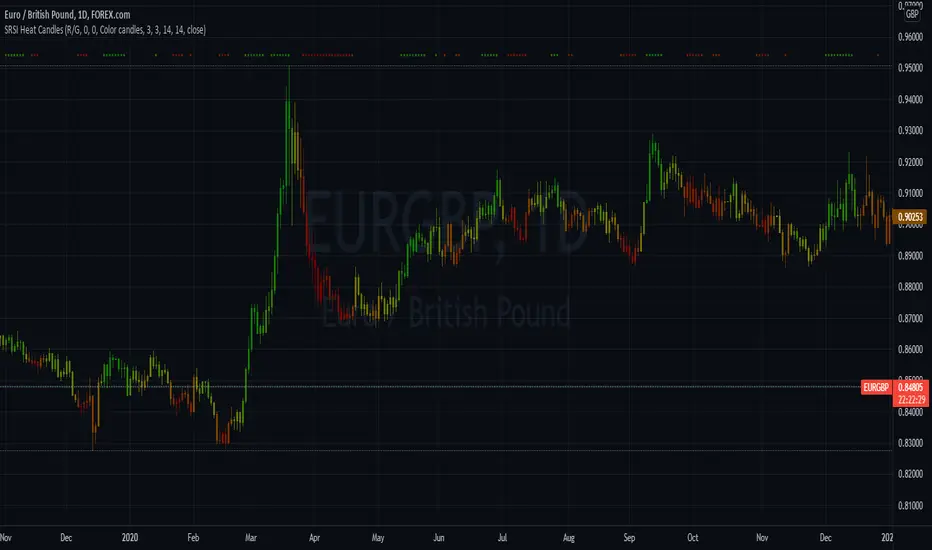
Stochastic RSI Heat Candles OverlayThis script is based on the Stochastic RSI indicator.
Candles are dynamically colored with a customizable RGB shading directly generated from the average Stochastic RSI current value.
By default, colors represent the following status -> green is overgought & red is oversold.
Options:
Shading colors: Choose between Red/Green, Green/Blue, and Blue/Red shadings to represent the SRSI heat.
Invert colors: Switch colors of the selected shading.
Third color: Select a value from 0 to 255 for the third color which does not vary.
Transparency: Select the transparency value.
Overlay style : Choose to color the whole candle, or only borders and wick.
Show candle side: If you choose to fully fill candles with the SRSI heat color , enable this option to plot shapes representing the candles directions.
Candle marks colors: Select bull and bear colors for direction shapes.
Overbought and Oversold situations are also represented by colored shapes at the top of the chart.
Standards Stochastic RSI parameters.
Examples:
Notes:
Do not forget to bring the script to the front of your chart to avoid being covered by default candles.
Next improvements would probably be a better coloring algorithm, however, do not hesitate to suggest any modifications in comments.
Initially, I shared a Stochastic RSI Heat Bollinger Bands indicator which gave me the idea to develop this one, you can find it on my profile.
RSI CrayonsThis simple script colors candles based on the Relative Strength Index. RSI Values > 50 are solid colors, RSI values < 50 are pastels, with additional colors/fills/alerts for overheated and oversold (both user adjustable thresholds) conditions.
As an added bonus, RSI can be calculated by non-traditional methods (not using the running/smoothed moving average) using a variety of different moving averages, but you may have to adjust the time-frame for 'faster' moving averages. An option for plotting the moving average basis is also available.
Value Added:
This indicator can be used to chart RSI without adding an "oscillator frame" to your chart, since we don't normally care too much about RSI values between 30 and 70 under normal conditions.

EM_RSI Gradient Candles
I've missed the beautiful trend visualization of Heiken Ashi candles ever since I first learned they don't play well with other indicators largely due to the method with which they're plotted.
I wanted to color code a gradient onto candles to help visualize trend strength, and the Relative Strength Index was the first thing to come to mind. For coloring, it's possible the new color.from_gradient function would have worked, but I couldn't guarantee a highly customizable indicator with a single gradient so I took a more classic approach.
First, RSI was calculated using Tradingview's built-in RSI code.
Then I broke down the RSI's range of 1-100 into 10 tiers and assigned each a color option with the ability to turn any particular tier off if desired.
I found it to be extremely modular and helpful in visualizing both trend strength and identifying potential trend reversals due to a reduction in strength.
You can use it on every candle to help inform decisions, or keep all but <10 and >90 turned off so that it only changes candle color during the most extreme trends.
Or anything in between!
This is my first self-coded indicator so I'm already proud.
Please let me know what you think, and feel free to suggest improvements for future versions in the comments!

Nunchucks✖ Nunchucks
A new way to display market data
Does not flip color during current candle
Displays Higher and Lower than the previous nunchuck's range
Use it with current price line

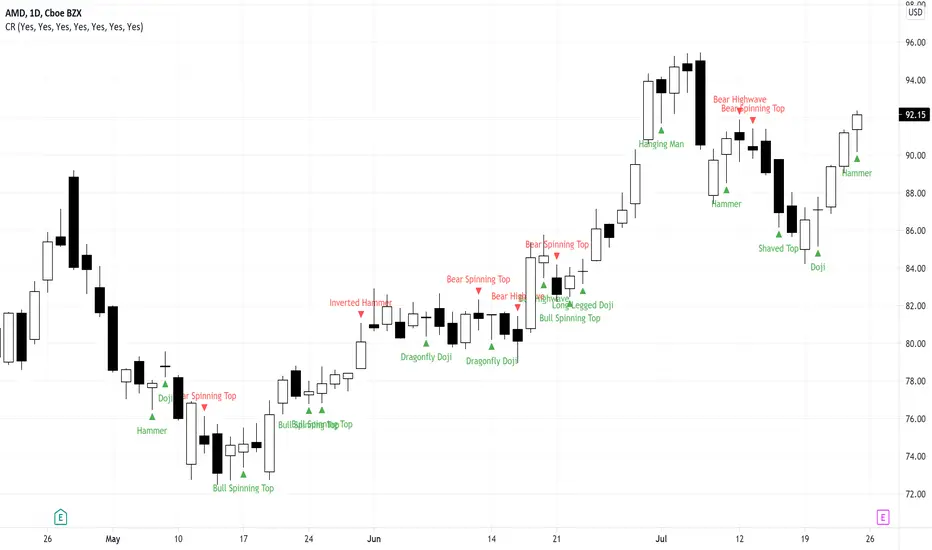
Candlestick RecognitionCandlestick Recognition
Version 1.0
Fun script to recognize and name candlesticks. Hamers and Highwaves and Marubozus oh my!
All candlestick names can be turned on or off in the settings since sometimes they stack close to each other and are hard to read. If you think I mislabeled any please provide me with an example of what you think it should be and I will review it to see if any changes need to be made. Please keep in mind that each stock will be a little different as the Candlestick Recognition uses ATR (Average True Range) for the calculations.
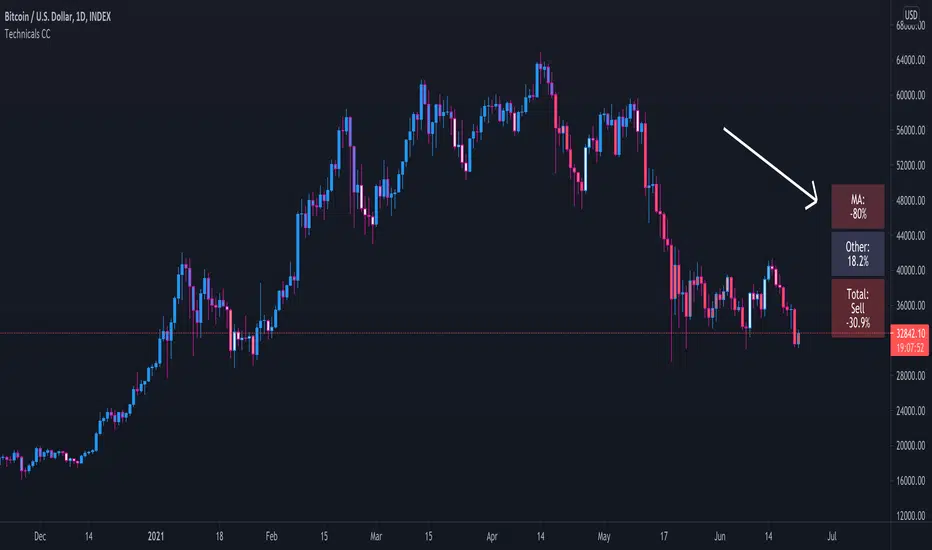
Technical Ratings Colored CandlesFor those that want technical ratings but don't want waste valuable screen real estate. Candles are colored to the rating strength. It also plots the results for "total", "MA" and "other" in a table on right of screen. Table and candle coloring can be turned off in style settings. This script uses the built in Technical Ratings indicator. For more informations on Technical Ratings please refer to official documentation.
Technical Ratings Pro - Pump WaveThis script uses the built in Technical Ratings indicator but interprets the data visually. It plots the results for "total", "MA" and "other" as pump waves. It uses MA to plot a trend line (can be turned off in settings) . Candles are colored to the rating strength and a percentage number was added to the results. For more informations on the Technical Ratings indicator please refer to official documentation.

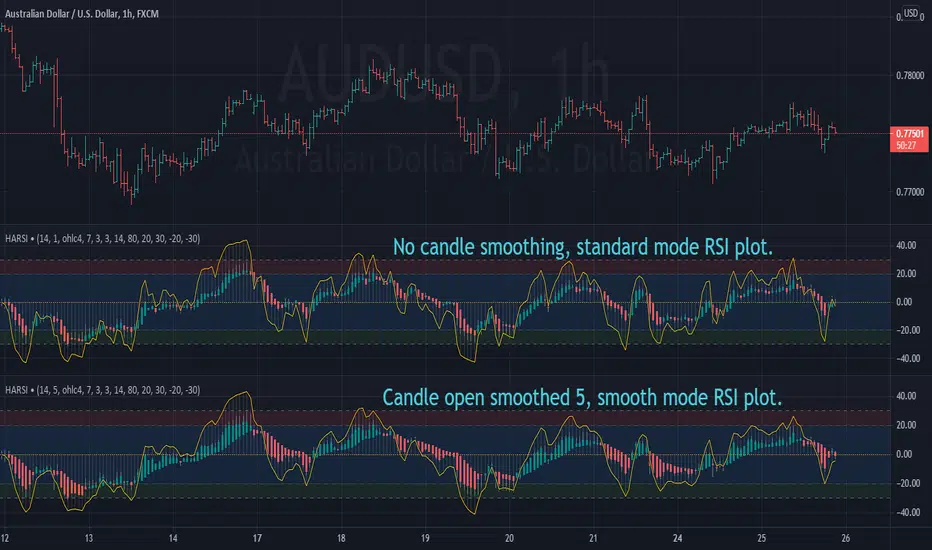
Heikin Ashi RSI OscillatorIntroducing HARSI - the RSI based Heikin Ashi candle oscillator.
...that's right, you read it correctly. This is Heikin Ashi candles in an oscillator
format derived from RSI calculations, aimed at smoothing out some of the
inherent noise seen with standard RSI indicators.
Science!
We likes it we does.
Included plot options for standard RSI plot overlay, and a smoothed variant with
it's own seperate length from the candles, oh and histogram option, for reasons.
Articles and further reading:
investopedia.com - RSI
investopedia.com - Heikin Ashi
This is a REALTIME indicator, so any values used for conditions should use
history 1, or alternatively, alerts should be called using once-per-bar-close.
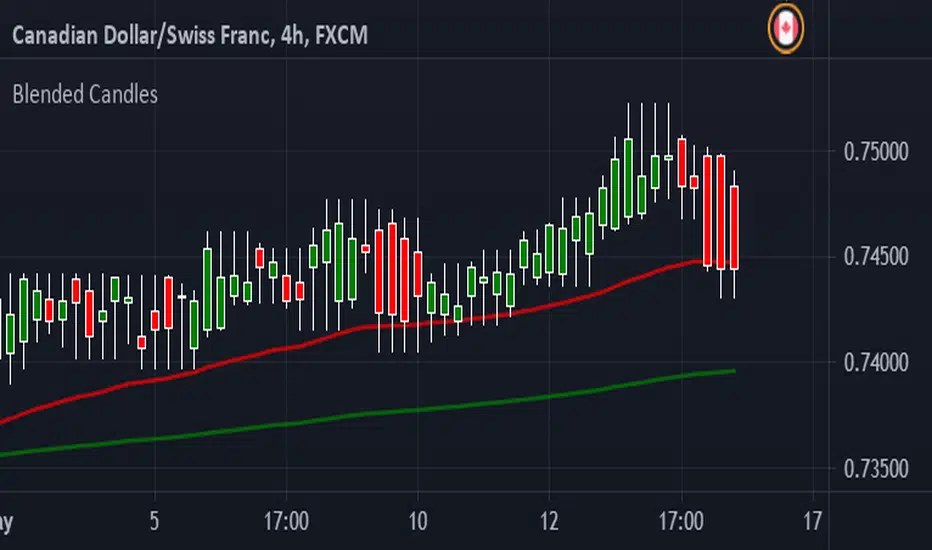
Blended CandlesHave been looking at YouTube and found a few videos about Blended Candles. Couldn't find a script here so I decided to script something myself.
I have also added a couple of EMA's, saves having to put them in individually.
You can Look Back as far back as you want but I find that each time frame looks better if you keep it to multiple of the next
IE : 1 min - look back 5 (5 min) up to 15 (15 min)
5 min - look back 3 (15 min) up to 12 (1 hour)
15 min - look back 4 (1 hour) up to 16 ( 4 hours)
1 hour - look back 4 (4 hours) up to 8 (8 hours - 1 trading session)
4 hour - look back 2 (8 hours - 1 trading session) up to 6 ( 1 Day)
1 day - look back 5 ( 1 week)
Shooting stars, Hammers and Doji's are very easy to recognize
Long wicks on top - Bearish
Long wick on bottom - Bullish
Support and Resistance is easier to spot as well :-)
Hope this helps someone - defiantly helps me time entries
Comments welcome and Happy Trading
ERSIInstead of the RSI which only uses the close of the market to calculate RSI, this indicator uses the Open, Close, High and Low individually to give four unique data points which are then drawn as candlesticks in place of the regular RSI.

PRIME - ShadoW ZoneZ with RSI LevelsIn This experimental study, we've taken RSI data, Volume Profile, and Trend analysis, combining them into one unique package that will allow a trader to analyze market trend lines and their proposed channels, trend momentum through candle color augmentation similar to "Pulse", and Visible Volume index price levels on chart for the current sequence. Below are explanations of each function within the system.
The Semafor is used to spot future multi-level Supports and Resistance zones.
It is also useful to spot HL or LL or HH or LH zones at different Depth settings.
The red zones are the extreme places where the market has a higher chance of reversing while the green zones have the lowest setting with lower chances of the market reversal
Automatic Trend Lines
The indicator takes in 2 timeframes to detect High and Low values from which to draw the trend lines of each timeframe.
As the values change with price movement, the lines are updated. They are color coded for uptrend and downtrend based on the direction of each individual line. Trend lines can be set up to color with only the default value on the configurations panel.
- Toggle on/off Color Coded
- Change Default, Uptrend, Downtrend color
- Change Line Width
- Change Line Style
- Toggle on/off Line Extensions
- Change Extended Line Width
- Change Extended Line Style
- Toggle On/Off labels for 7 data points of each timeframe
Automatic Trend Sights
This is a neat feature that may help you get a better feel for the direction the current movement is heading towards in correlation with the short or medium length timeframe trends. The sight draws a line from the middle vertical point of the trend coordinates towards the current price. They are toggled off by default but can be enabled in the configurations panel.
- Toggle on/off sight on each timeframe
- Change Width
- Change Line Style
Support & Resistance Levels, the main aim of the study. Level calculations are based on Relative Strength Index ( RSI ) threshold levels of oversold/overbought and bull/bear zones, where all threshold values are customizable through the user dialog box. Background of the levels can be colored optionally.
RSI Weighted Colored Bars and/or Mark Overbought/Oversold Bars , Bar colors can be painted to better emphasis RSI values. Darker colors when the oscillator is in oversold/overbought zones, light colors when oscillator readings are below/above the bull/bear zone respectively, and remain unchanged otherwise. Besides the colors, with “Display RSI Overbought/Oversold Price Bars” option little triangle shapes can be plotted on top or bottom of the bars when RSI is in oversold/overbought zones .
Disclaimer:
Trading success is all about following your trading strategy and the indicators should fit within your trading strategy, and not to be traded upon solely
The script is for informational and educational purposes only. Use of the script does not constitute professional and/or financial advice. You alone have the sole responsibility of evaluating the script output and risks associated with the use of the script. In exchange for using the script, you agree not to hold dgtrd TradingView user liable for any possible claim for damages arising from any decision you make based on use of the script

Renko + CandlesThis indicator has been designed to show you both candle chart and Renko chart in one place.
I think most of you are familiar with candle chart which is working with the time and price movements but Renko chart is based on price differences and is not related to the "time" parameter.
so if you see a Renko brick is appear up(or down) to the previous brick it means that a certain and fixed price movement has been occurred (which mostly calculate by ATR). and also this indicator works in any time frame.
Remember because we want both charts we have time parameter in this indicator, and if the price doesn't move up or down a certain percentage from previous bars, it will plot a renko bar beside the previous one.
you can use this indicator to see if the price moves up or down.
Or you can determine the important support and resistances with much less noises.
it can be used as a confirmation for you to keep your positions or exit.
go ahead and discover it...
If you have any questions, don't hesitate! ask in the comments section below.

Z CandlesScript to change candle color based on z-score.
Inputs:
'src': Price source that will be standardized.
'n': Number of periods used in calculation of z-score (mean and st. dev.).

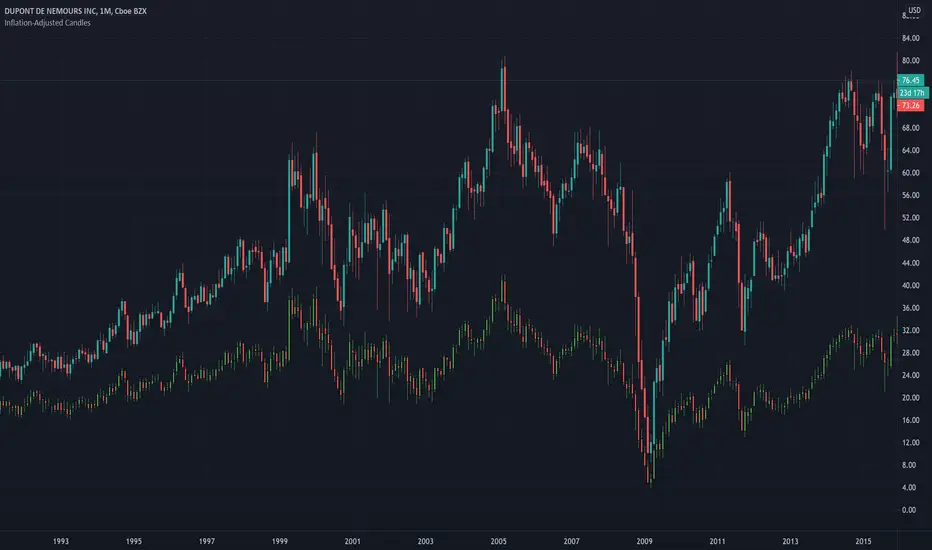
Inflation-Adjusted CandlesDeflates time series of historical open, close, high, low prices. This adjusts price data for inflation and removes the effect of price inflation.
inflation-adjusted price for period 't' = (price / cpi ) * 100
Historical CPI is pulled from Quandl.