DXY SIGNALWorks on pairs including USD ticker. Gives buy and sell signals according to the relationship with DXY.
Buysignal
Hyper TrendHyper Trend can help you with setting your stop loss and take profit levels and shows if exisiting price levels are in long zone or short zone. Tune the indicator first for the chart you intend to use Hyper Trend on with the given options. Enjoy !
PS: Multiplier 2 gives results similar to the famous Super Trend indicator developed by Olivier Seban.

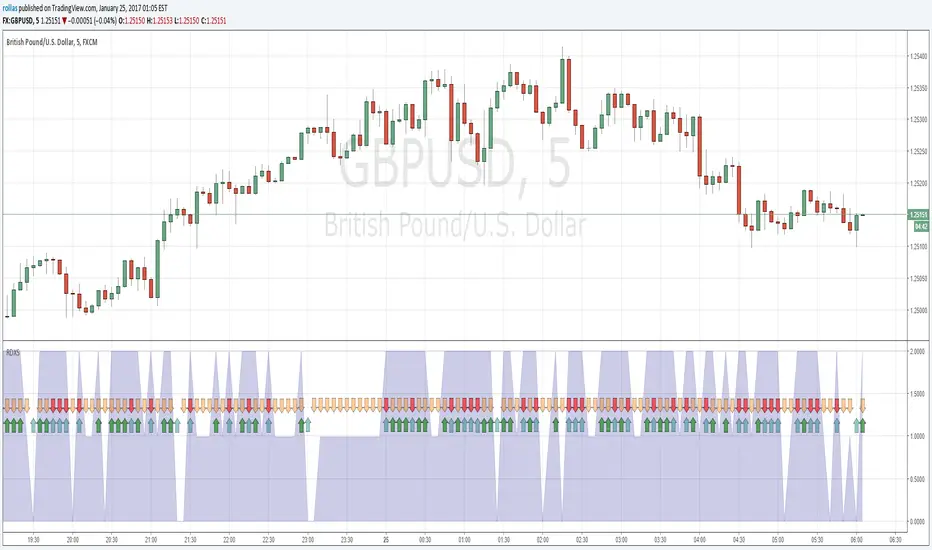
Magic Circles V3Magic Circles indicator uses an ATR based trend indicator in conjunction with a Parabolic SAR indicator for creating signals. Blue is neutral. Green is buy and red is sell. A hollow green circle followed by a regular green indicates a strong buy while a hollow red circle followed by a regular red one indicates a strong sell signal. This version gives you the option to choose your own magic number. Default is 1.618 also known as the golden ratio. The indicator works best at trending markets.
Version 3 comes with ADX filtering to avoid misleading signals and set on by default. Also you can now see the support / resistance levels. Another option added is showing the current trend direction.
ADX is Average Directional Index and founded by Welles Wilder. Wilder published his work in his book titled New Concepts in Technical Trading Systems (1978).

Magic Circles V2Thanks for your feedback in regard to the Magic Circles indicator. As a common question, Magic Circles indicator uses an ATR based trend indicator in conjunction with a Parabolic SAR indicator for creating signals. Blue is neutral. Green is buy and red is sell. A hollow green circle followed by a regular green indicates a strong buy while a hollow red circle followed by a regular red one indicates a strong sell signal. This version gives you the option to choose your own magic number. Default is 1.618 also known as the golden ratio. The indicator works best at trending markets.

Magic CirclesMagic Circles give buy and sell signals. Works best at trending markets. When using lower time frames, it is beneficial to confirm the signals with a 4H chart.

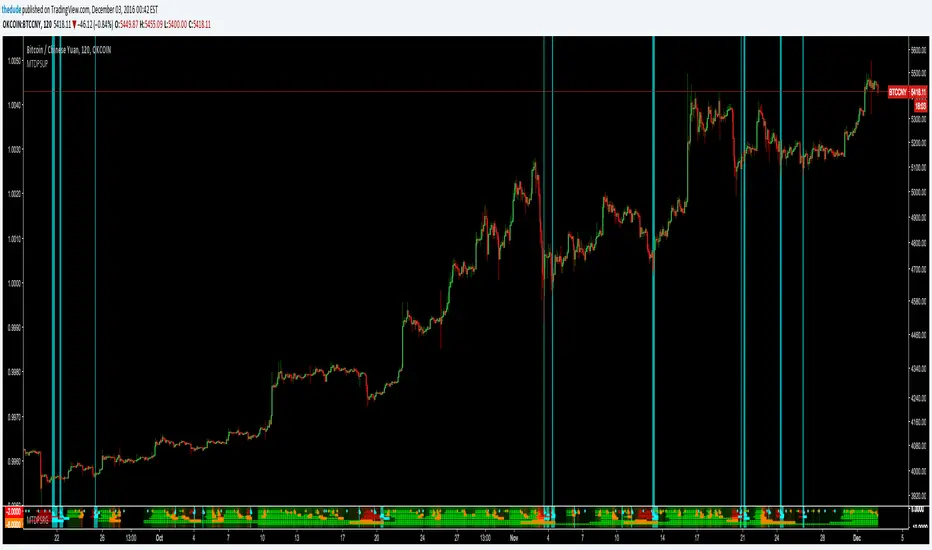
Dudes Multi Time-Frame Pivot System [[Up Only]]Dudes Multi Time-Frame Pivot System [ ]
This is the first public beta of a new "ribbon" type of indicator which shows trend information and pivot candle information for 8 different timeframes, all within a very compact and visually appealing space.
It is extremely useful for pinpointing trend changes or current trend by giving you information from 8 different timeframes on one chart. The idea is if multiple time-frames are in sync with each other, the stronger the signal will be. You can easily set alarms on pivot points to trigger Tradingview to send an email or SMS when an important signal appears on the chart. To trigger the alarm, set the indicator to "Cross Up" on the value 0.5. The value of the variable holding candle data is a binary 0 or 1.
The ribbon strategy is split into 3 different indicators because of the large amount of code required to calculate everything. Please contact me if you are interested in purchasing a subscription to the strategy or want more information. The current subscription price is starting at $50USD on a monthly basis. There will be 2 other shared scripts for the other 2 parts of this indicator; Down and Red/Green. Contact me here on tradingview via PM, or via email thedudeontv@gmail.com if you are interested
Range_Outlier_ActionThis identifies Buy and Sell Points once the period high breaches the SMA High and period low breaches the SMA Low. It produces profitable results greater than 87% of the time. You should still monitor and set up stop-losses as appropriate.

Romi Trend and Momentum Oscillator
Great oscillator which determines trend and momentum. So accurate it could be used as a stand alone indicator.

Stock Market Trend Analysis Trading System 101 (by ChartArt)This is a very simple trading system which is measuring the core of uptrends and downtrends using three basic elements: Close price, HL2 price, Pivot price.
Depending if the uptrend or downtrend is strong, the buy/sell signals are shown in different colors. The stronger trends are in brighter colors (lime and fuchsia). If the trend just fully changed direction from uptrend to downtrend (or vice versa), there is a background color highlight in the color of the new trend direction.
The trend detection should work best on monthly charts. I have created this in under an hour. My goal was to use the least amount of rules possible, therefore there are many false signals and the code is quite lazy.
You can lose all your money if you rely on these buy/sell signals!

TUX 4 MAThis indicator uses the 21, 55, 100 and 200 SMA.
Strategy:
When the 21 SMA crosses the 55 and 100 SMA it creates either a buy or sell symbol dependent on which way it crossed.

