Dynamic TestingInput Parameters
`lookbackPeriod` : Number of candles to check for determining the highest high (resistance) and lowest low (support) levels.
`atrPeriod` : The period for calculating the Average True Range (ATR), a measure of market volatility.
`atrMultiplierSL` : Multiplier to calculate the stop-loss distance relative to the ATR.
`atrMultiplierTP1` and `atrMultiplierTP2` : Multipliers to calculate two take-profit levels relative to ATR.
`rewardToRisk` : The ratio between reward (profit) and risk (stop loss) for trade management.
---
Core Calculations
ATR (Average True Range)
atr = ta.atr(atrPeriod)
ATR is computed using the specified period to gauge price volatility.
Volume SMA
volumeSMA = ta.sma(volume, atrPeriod)
The script calculates the simple moving average of volume over the same period as ATR. This is used as a threshold for validating high-volume scenarios.
---
Support and Resistance Levels
`support` : Lowest price over the last `lookbackPeriod` candles.
`resistance` : Highest price over the same period.
`supportBuffer` and `resistanceBuffer` : These are "buffered" zones around support and resistance, calculated using half of the ATR to prevent false breakouts.
---
Entry Scenarios
Bullish Entry (`isBullishEntry`)
The close is above the buffered support level.
The low of the current candle touches or breaks below the support level.
The trading volume is greater than the `volumeSMA`.
Bearish Entry (`isBearishEntry`)
The close is below the buffered resistance level.
The high of the current candle touches or exceeds the resistance level.
The trading volume is greater than the `volumeSMA`.
---
Box Visualization
Bullish and Bearish Boxes
Bullish Box (`bullishBox`):
- A green, semi-transparent rectangle around the support level to highlight the bullish entry zone.
- Dynamically updates based on recent price action.
Bearish Box (`bearishBox`):
- A red, semi-transparent rectangle around the resistance level to highlight the bearish entry zone.
- Adjusts similarly as price evolves.
---
Stop Loss and Take Profit Calculations
Bullish Trades
Stop Loss (`bullishSL`): Calculated as support - atrMultiplierSL * ATR .
Take Profit 1 (`bullishTP1`): support + rewardToRisk * atrMultiplierTP1 * ATR .
Take Profit 2 (`bullishTP2`): support + rewardToRisk * atrMultiplierTP2 * ATR .
Bearish Trades
Stop Loss (`bearishSL`): resistance + atrMultiplierSL * ATR .
Take Profit 1 (`bearishTP1`): resistance - rewardToRisk * atrMultiplierTP1 * ATR .
Take Profit 2 (`bearishTP2`): resistance - rewardToRisk * atrMultiplierTP2 * ATR .
---
Visualization for Key Levels
Bullish Scenario
Green lines represent `bullishTP1` and `bullishTP2` for profit targets.
A red line indicates the `bullishSL` .
Labels like "TP1," "TP2," and "SL" dynamically appear at respective levels to make the targets and risk visually clear.
Bearish Scenario
Red lines represent `bearishTP1` and `bearishTP2` .
A green line marks the `bearishSL` .
Similar dynamic labeling for `TP1` , `TP2` , and `SL` at corresponding bearish levels.
---
Dynamic Updates
Both the entry boxes and key level visualizations (lines and labels) adjust dynamically based on real-time price and volume data.
---
Purpose
Identify high-probability bullish and bearish trade setups.
Define clear entry zones (using boxes) and exit levels (TP1, TP2, SL).
Incorporate volatility (via ATR) and volume into decision-making.
---
Technical Summary
Dynamically visualize support/resistance levels.
Set risk-managed trades using ATR-based stop-loss and profit levels.
Automate visual trade zones for enhanced chart clarity.
---
Indikator-Indikator Rentang

Sessions ny vizScript Purpose
This indicator draws a colored background during the New York trading session. It's useful for traders who want to have a visual overview of when the American (NY) trading session is active.
Main Features
NY Session Visualization - draws a gray bar in the background of the chart during NY trading hours (15:00-19:00 CET)
Customization - allows users to:
Set custom session time range
Adjust background color and transparency
Limit display to only the last 24 hours
Input Parameters
sessionRange - session time range (default 15:00-19:00 CET)
sessionColour - background color (default gray with 90% transparency)
onlyLast24Hours - toggle for showing only the last 24 hours (default false)
Technical Details
Script is written in Pine Script version 5
Uses UNIX timestamp for time period calculations
Runs as an overlay indicator (overlay=true), meaning it displays directly on the price chart
Uses the bgcolor() function for background rendering
Contains logic to check if current time is within defined session
Usage
This indicator is useful for:
Monitoring active NY trading session hours
Planning trades during the most liquid hours of the US market
Visual orientation in the chart during different trading sessions

Galagtic Radar Grid - AYNETFeatures:
Concentric Circles:
Drawn using points (•) placed around a center.
The number of circles and their spacing are customizable.
Radial Lines:
Straight lines radiate outward from the center.
You can customize the number of lines (e.g., 12 for 30° intervals).
Highlight Marker:
An orange marker is placed at a specific angle (customizable) on the outermost circle.
Key Customization Inputs:
Circle Count: Number of concentric circles.
Circle Spacing: Distance between circles.
Line Count: Number of radial lines.
Highlight Angle: Position of the orange marker in degrees.
Colors: Customize grid and marker colors.
Core Logic:
Circles and radial lines are calculated using trigonometric functions (math.cos and math.sin).
The x-coordinates are tied to bar_index (integer), ensuring compatibility with TradingView's requirements.
This script is ideal for creating a visual radar-like grid on TradingView charts. Let me know if you'd like further enhancements! 😊

Wick Trend Analysis - AYNETScientific Explanation
1. Wick Trend Lines
Upper Wick Trend Line: The upper_wick_trend is calculated as the Simple Moving Average (SMA) of the upper wick lengths over the user-defined period (trend_length).
pinescript
Kodu kopyala
float upper_wick_trend = ta.sma(upper_wick_length, trend_length)
Lower Wick Trend Line: The lower_wick_trend is similarly calculated for the lower wick lengths.
pinescript
Kodu kopyala
float lower_wick_trend = ta.sma(lower_wick_length, trend_length)
2. Filling Between Lines
fill Function: The fill function colors the area between two plotted lines (plot_upper and plot_lower) based on a defined condition.
pinescript
Kodu kopyala
fill(plot_upper, plot_lower, color=fill_color, title="Wick Trend Area")
Condition for Coloring: The color is determined based on whether the upper wick trend is greater or less than the lower wick trend:
Green Fill: Indicates that the upper wick trend is dominant (i.e., upper_wick_trend > lower_wick_trend).
Red Fill: Indicates that the lower wick trend is dominant (i.e., upper_wick_trend <= lower_wick_trend).
Visualization Features
Trend Lines:
Upper wick trend is plotted as a green line.
Lower wick trend is plotted as a red line.
Filled Area:
The area between the two trend lines is filled:
Green when the upper wick trend is dominant.
Red when the lower wick trend is dominant.
Dynamic Adjustments:
The user can adjust the trend_length to change the sensitivity of the SMA calculations.
Applications
Sentiment Analysis:
Green Fill (Upper Trend Dominance): Indicates stronger rejection at higher prices, suggesting bearish sentiment.
Red Fill (Lower Trend Dominance): Indicates stronger rejection at lower prices, suggesting bullish sentiment.
Signal Generation:
Transitions in the fill color (from green to red or vice versa) can serve as potential trade signals.
Volatility Assessment:
Wider gaps between the trend lines indicate higher market volatility, while narrower gaps suggest lower volatility.
Enhancements
1. Trend Strength Filtering
Add thresholds to filter out minor trends or insignificant wick activity:
pinescript
Kodu kopyala
bool significant_upper_wick = upper_wick_length > 10 // Minimum length for upper wick
bool significant_lower_wick = lower_wick_length > 10
2. Alerts for Trend Changes
Trigger alerts when the dominance of the trend changes:
pinescript
Kodu kopyala
alertcondition(upper_wick_trend > lower_wick_trend, title="Upper Wick Dominance", message="Upper wick trend is now dominant.")
alertcondition(lower_wick_trend > upper_wick_trend, title="Lower Wick Dominance", message="Lower wick trend is now dominant.")
3. Combined Wick Analysis
Incorporate total wick activity (upper + lower wicks) for holistic analysis:
pinescript
Kodu kopyala
float total_wick_trend = ta.sma(upper_wick_length + lower_wick_length, trend_length)
Conclusion
This script provides a robust visualization of wick trends with dynamic color filling to indicate trend dominance. By observing the relative strength of upper and lower wick trends, traders can assess market sentiment, detect potential reversals, and gauge volatility. This method can be further enhanced with additional filters, alerts, and composite indicators to refine trading strategies.
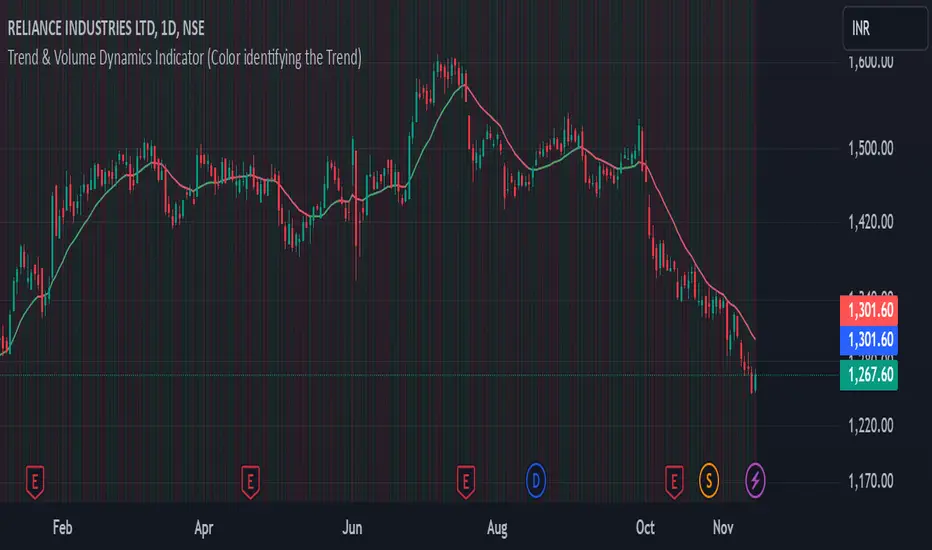
Trend & Volume Dynamics Indicator (Color identifying the Trend)Benefits
1. Trend Identification:
o The script calculates a 20-period Weighted Moving Average (WMA) of the closing prices. This helps in smoothing out price data to identify the underlying trend.
o The color of the WMA line changes based on the price position relative to the WMA:
Green: When the current price is above the WMA, indicating a potential uptrend.
Red: When the current price is below the WMA, indicating a potential downtrend.
Blue: When the price is exactly at the WMA, indicating no clear trend.
2. Volume Dynamics:
o The script also plots the volume with a color-coding mechanism:
Green: When the current volume is higher than the previous period's volume, indicating increasing trading activity.
Red: When the current volume is lower than the previous period's volume, indicating decreasing trading activity.
o The volume bars are plotted with 90% transparency, making them less visually dominant but still informative.
Usage
• Overlay: The indicator is set to overlay=true, meaning it will be plotted directly on the price chart, allowing users to see the WMA and volume dynamics in the context of the price movements.
• WMA Length: The length of the WMA is set to 20 periods, which is a common setting for short to medium-term trend analysis.
• Visual Cues: The color changes in both the WMA and volume bars provide immediate visual cues about the trend and volume dynamics, helping traders make quicker decisions.
Detailed Explanation of the Script
1. Indicator Declaration:
o Declares the indicator with a descriptive name and specifies that it should be overlaid on the price chart.
2. WMA Calculation:
o Defines the length of the WMA and calculates it using the closing prices.
3. Plotting the WMA:
o Plots the WMA with full brightness (0 transparency).
4. Color-Coding the WMA:
o Changes the color of the WMA line based on the price's position relative to the WMA.
5. Volume Indicator:
o Plots the volume bars with color-coding based on the volume change from the previous period and with 90% transparency.
Conclusion
One of the most best combinations of Volume and Moving average and works on any given timeframe and charts
Time Change Indicator-AYNETDetailed Scientific Explanation of the Time Change Indicator Code
This Pine Script code implements a financial indicator designed to measure and visualize the percentage change in the closing price of an asset over a specified timeframe. It uses historical data to calculate changes and displays them as a histogram for intuitive analysis. Below is a comprehensive scientific breakdown of the code:
1. User Inputs
The script begins by defining user-configurable parameters, enabling flexibility in analysis:
timeframe: The user selects the timeframe for measuring price changes (e.g., 1 hour, 1 day). This determines the granularity of the analysis.
positive_color and negative_color: Users choose the colors for positive and negative changes, enhancing visual interpretation.
2. Data Retrieval
The script employs request.security to fetch closing price data (close) for the specified timeframe. This function ensures that the indicator adapts to different timeframes, providing consistent results regardless of the chart's base timeframe.
Current Closing Price (current_close):
current_close
=
request.security(syminfo.tickerid, timeframe, close)
current_close=request.security(syminfo.tickerid, timeframe, close)
Retrieves the closing price for the defined timeframe.
Previous Closing Price (prev_close): The script uses a variable (prev_close) to store the previous closing price. This variable is updated dynamically as new data is processed.
3. Price Change Calculation
The script calculates both the absolute and percentage change in closing price:
Absolute Price Change (price_change):
price_change
=
current_close
−
prev_close
price_change=current_close−prev_close
Measures the difference between the current and previous closing prices.
Percentage Change (percent_change):
percent_change
=
price_change
prev_close
×
100
percent_change=
prev_close
price_change
×100
Normalizes the change relative to the previous closing price, making it easier to compare changes across different assets or timeframes.
4. Conditional Logic for Visualization
The script uses a conditional statement to determine the color of each histogram bar:
Positive Change: If price_change > 0, the bar is assigned the user-defined positive_color.
Negative Change: If price_change < 0, the bar is assigned the negative_color.
This differentiation provides a clear visual cue for understanding price movement direction.
5. Visualization
The script visualizes the percentage change using a histogram and enhances the chart with dynamic labels:
Histogram (plot.style_histogram):
Each bar represents the percentage change for a given timeframe.
Bars above the zero line indicate positive changes, while bars below the zero line indicate negative changes.
Zero Line (hline(0)): A reference line at zero provides a baseline for interpreting changes.
Dynamic Labels (label.new):
Each bar is annotated with its exact percentage change value.
The label's position and color correspond to the bar, improving clarity.
6. Algorithmic Flow
Data Fetching: Retrieve the current and previous closing prices for the specified timeframe.
Change Calculation: Compute the absolute and percentage changes between the two prices.
Bar Coloring: Determine the color of the histogram bar based on the change's direction.
Plotting: Visualize the changes as a histogram and add labels for precise data representation.
7. Applications
This indicator has several practical applications in financial analysis:
Volatility Analysis: By visualizing percentage changes, traders can assess the volatility of an asset over specific timeframes.
Trend Identification: Positive and negative bars highlight periods of upward or downward momentum.
Cross-Asset Comparison: Normalized percentage changes enable the comparison of price movements across different assets, regardless of their nominal values.
Market Sentiment: Persistent positive or negative changes may indicate prevailing bullish or bearish sentiment.
8. Scientific Relevance
This script applies fundamental principles of data visualization and time-series analysis:
Statistical Normalization: Percentage change provides a scale-invariant metric for comparing price movements.
Dynamic Data Processing: By updating the prev_close variable with real-time data, the script adapts to new market conditions.
Visual Communication: The use of color and labels improves the interpretability of quantitative data.
Conclusion
This indicator combines advanced Pine Script functions with robust financial analysis techniques to create an effective tool for evaluating price changes. It is highly adaptable, providing users with the ability to tailor the analysis to their specific needs. If additional features, such as smoothing or multi-timeframe analysis, are required, the code can be further extended.

Torus Visualization-Secret Geometry-AYNETExplanation:
Outer and Inner Circles:
The script draws two main circles: the outer boundary and the inner boundary of the Torus.
Bands Between Circles:
Additional concentric circles are drawn to create the illusion of a Torus structure.
Customizable Inputs:
You can control the outer radius, inner radius, number of segments for smoother circles, and the number of bands to improve visualization.
Parameters:
center_x and center_y define the center of the Torus on the chart.
outer_radius and inner_radius control the size of the Torus.
segments define the resolution of the circles (more segments = smoother appearance).
Visualization:
The Torus appears as a series of concentric circles, giving a 2D approximation of the 3D structure.
This script can be visualized on any chart, and the Torus will adjust its position based on the specified center and radius values.

Meme Coin Buy Signal Indicator by asharThis custom TradingView indicator is specifically designed for meme coins, using technical analysis indicators to identify optimal buy signals. It combines short-term moving averages, volume spikes, and Bitcoin trend alignment to pinpoint potential entry points during high-momentum periods.
Indicator Components:
Moving Averages (MA): A 5-period fast MA and a 13-period slow MA highlight short-term price momentum. Buy signals are generated when the fast MA crosses above the slow MA, indicating potential upward momentum.
Volume Spike Detection: The indicator detects high-volume periods using a multiplier. If the current volume exceeds the 10-period average volume by the set multiplier (default: 2.0), it indicates increased buying interest, which is crucial for meme coins.
Bitcoin Trend Alignment: The trend of Bitcoin, a market-wide sentiment indicator, is gauged with a 20-day moving average. Buy signals are validated only when Bitcoin is also in an uptrend, providing additional bullish confirmation for meme coins.
Buy Signal Criteria: A buy signal is triggered when:
The fast MA crosses above the slow MA.
Volume is above the average by the set multiplier.
The price is above the slow MA.
Bitcoin is trending up based on the 20-day moving average.
This indicator is ideal for meme coin traders looking to time entries with momentum-driven trends, aligning volume and trend indicators for a more comprehensive approach to high-risk assets.

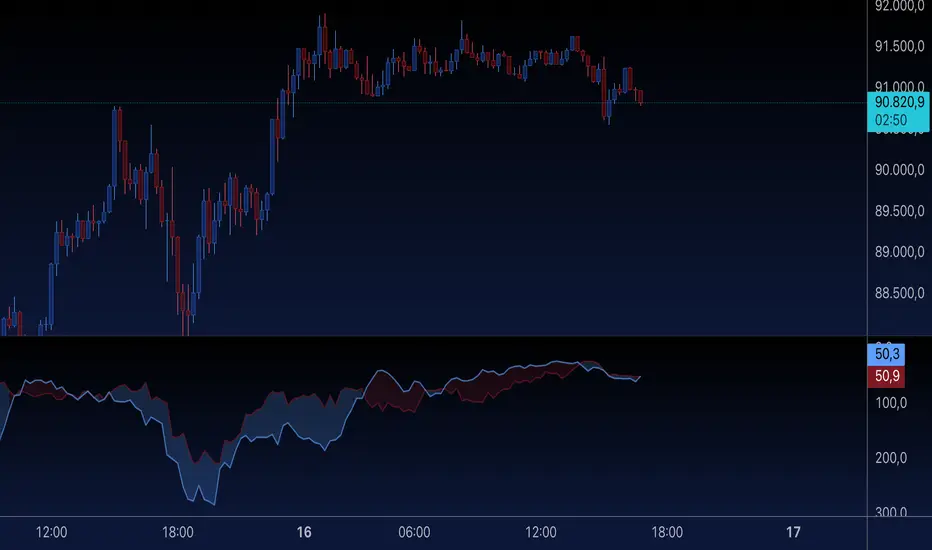
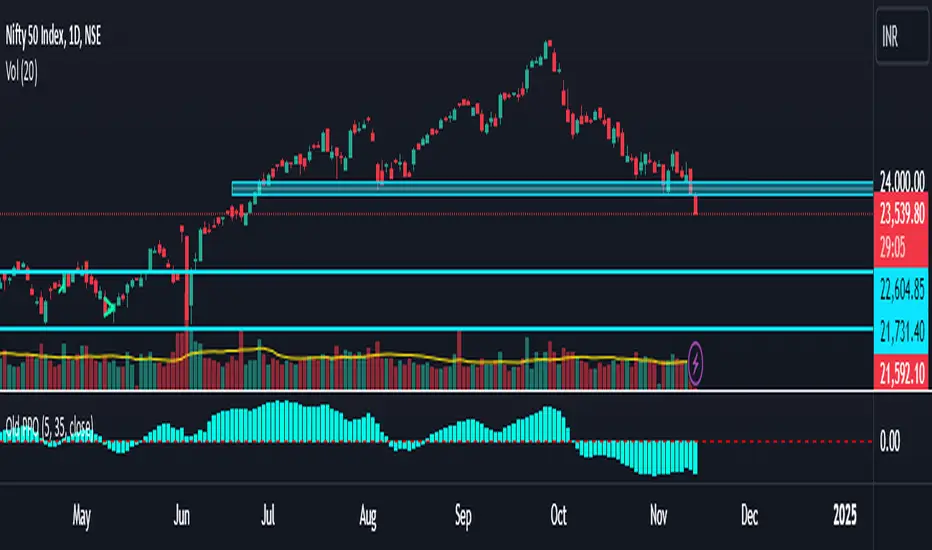
Old Price OscillatorThe Old Price Oscillator (OPO) is a momentum indicator widely used by traders and analysts to gauge the direction and strength of price trends. It works by calculating the difference between two moving averages—a shorter-term moving average and a longer-term moving average—of a security’s price. This difference is plotted as an oscillating line, helping traders visualize the momentum and determine when price reversals or continuations might occur. Typically, when the oscillator value is positive, the price is trending upwards, suggesting potential buy signals; conversely, when the oscillator turns negative, it indicates downward momentum, which could signal a potential sell.
The OPO is similar to other oscillators, like the Moving Average Convergence Divergence (MACD), in that it uses moving averages to smooth out price fluctuations and clarify trends. Traders often customize the length of the short- and long-term moving averages to better suit specific assets or market conditions. Generally, this indicator is especially useful in markets that exhibit clear trends. However, it may generate false signals during sideways or highly volatile periods, so many traders combine the OPO with other technical indicators or filters to improve accuracy.
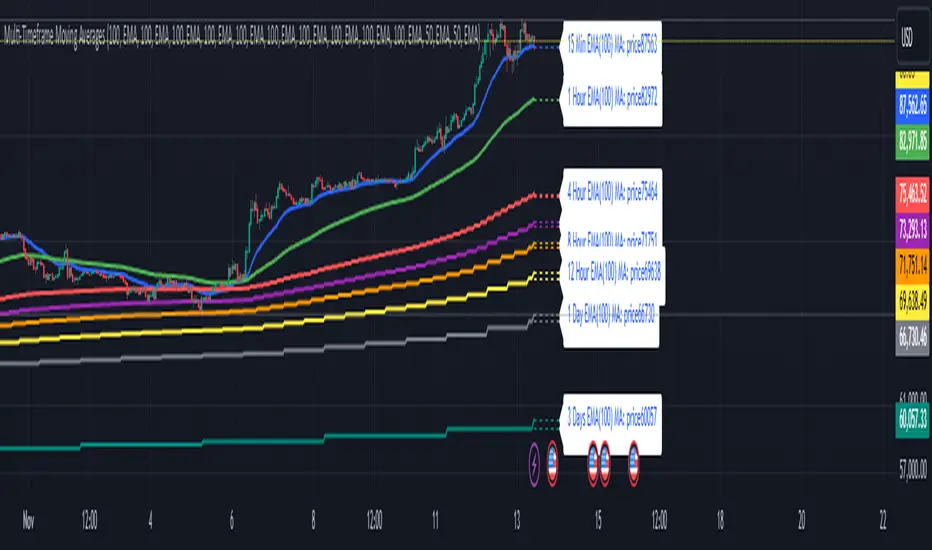
Multi-Timeframe Moving Averages by Skyito"Hope everyone likes this and finds it useful! This multi-timeframe moving average indicator provides a comprehensive view of moving averages from various timeframes directly on one chart. It’s designed to help traders analyze market trends and levels more effectively without constantly switching between charts.
Script Explanation: This indicator supports a range of moving average types, including SMA, EMA, HMA, WMA, VWMA, RMA, SSMA, and DEMA, allowing for flexibility in analysis. Each moving average is fully customizable by length and type for each timeframe, giving you control over how trends are represented.
The indicator includes timeframes such as 15 minutes, 1 hour, 4 hours, 6 hours, 8 hours, 12 hours, 1 day, 3 days, 5 days, 1 week, 3 weeks, and 1 month. Each moving average is displayed as a line with a small dashed extension, showing a label that contains the moving average’s timeframe, type, and current price level. The dark blue labels are slightly enlarged to enhance readability on the chart, making it easier to track important levels at a glance.
Use Case: This tool is ideal for traders looking to stay aware of trend levels across multiple timeframes on one chart. Adjusting the moving averages’ lengths and types enables customization for any strategy, while the label information provides an immediate understanding of the timeframe and trend context.
Enjoy the streamlined view and the added insights from multi-timeframe analysis!"
NASI +The NASI + indicator is an advanced adaptation of the classic McClellan Oscillator, a tool widely used to gauge market breadth. It calculates the McClellan Oscillator by measuring the difference between the 19-day and 39-day EMAs of net advancing issues, which are optionally adjusted to account for the relative strength of advancing vs. declining stocks.
To enhance this analysis, NASI + applies the Relative Strength Index (RSI) to the cumulative McClellan Oscillator values, generating a unique momentum-based view of market breadth. Additionally, two extra EMAs—a 10-day and a 4-day EMA—are applied to the RSI, providing further refinement to signals for overbought and oversold conditions.
With NASI +, users benefit from:
-A deeper analysis of market momentum through cumulative breadth data.
-Enhanced sensitivity to trend shifts with the applied RSI and dual EMAs.
-Clear visual cues for overbought and oversold conditions, aiding in intuitive signal identification.

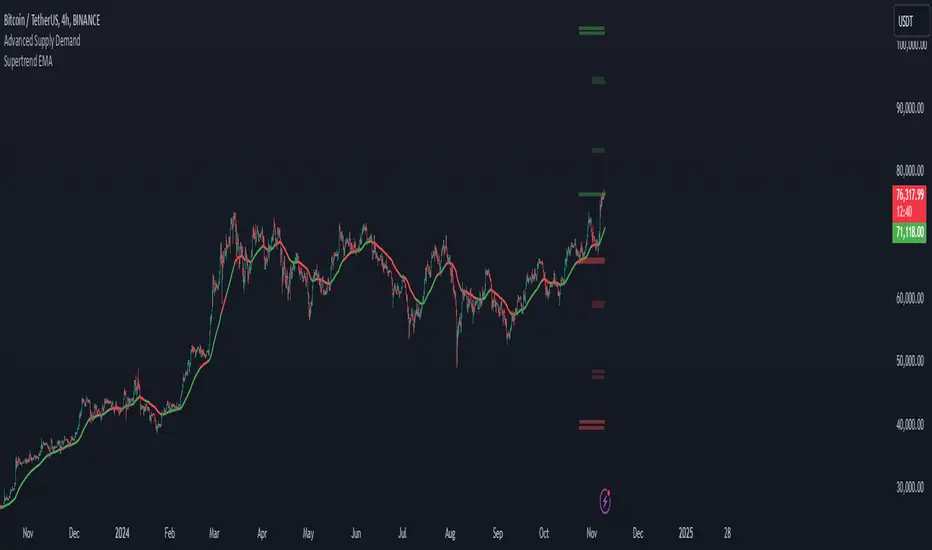
Supertrend EMA & KNNSupertrend EMA & KNN
The Supertrend EMA indicator cuts through the noise to deliver clear trend signals.
This tool is built using the good old Exponential Moving Averages (EMAs) with a novel of machine learning; KNN (K Nearest Neighbors) breakout detection method.
Key Features:
Effortless Trend Identification: Supertrend EMA simplifies trend analysis by automatically displaying a color-coded EMA. Green indicates an uptrend, red signifies a downtrend, and the absence of color suggests a potential range.
Dynamic Breakout Detection: Unlike traditional EMAs, Supertrend EMA incorporates a KNN-based approach to identify breakouts. This allows for faster color changes compared to standard EMAs, offering a more dynamic picture of the trend.
Customizable Parameters: Fine-tune the indicator to your trading style. Adjust the EMA length for trend smoothing, KNN lookback window for breakout sensitivity, and breakout threshold for filtering noise.
A Glimpse Under the Hood:
Dual EMA Power: The indicator utilizes two EMAs. A longer EMA (controlled by the "EMA Length" parameter) provides a smooth trend direction, while a shorter EMA (controlled by the "Short EMA Length" parameter) triggers color changes, aiming for faster response to breakouts.
KNN Breakout Detection: This innovative feature analyzes price action over a user-defined lookback period (controlled by the "KNN Lookback Length" parameter) to identify potential breakouts. If the price surpasses a user-defined threshold (controlled by the "Breakout Threshold" parameter) above the recent highs, a green color is triggered, signaling a potential uptrend. Conversely, a breakdown below the recent lows triggers a red color, indicating a potential downtrend.
Trading with Supertrend EMA:
Ride the Trend: When the indicator displays green, look for long (buy) opportunities, especially when confirmed by bullish price action patterns on lower timeframes. Conversely, red suggests potential shorting (sell) opportunities, again confirmed by bearish price action on lower timeframes.
Embrace Clarity: The color-coded EMA provides a clear visual representation of the trend, allowing you to focus on price action and refine your entry and exit strategies.
A Word of Caution:
While Supertrend EMA offers faster color changes than traditional EMAs, it's important to acknowledge a slight inherent lag. Breakout detection relies on historical data, and there may be a brief delay before the color reflects a new trend.
To achieve optimal results, consider:
Complementary Tools: Combine Supertrend EMA with other indicators or price action analysis for additional confirmation before entering trades.
Solid Risk Management: Always practice sound risk management strategies such as using stop-loss orders to limit potential losses.
Supertrend EMA is a powerful tool designed to simplify trend identification and enhance your trading experience. However, remember, no single indicator guarantees success. Use it with a comprehensive trading strategy and disciplined risk management for optimal results.
Disclaimer:
While the Supertrend EMA indicator can be a valuable tool for identifying potential trend changes, it's important to note that it's not infallible. Market conditions can be highly dynamic, and indicators may sometimes provide false signals. Therefore, it's crucial to use this indicator in conjunction with other technical analysis tools and sound risk management practices. Always conduct thorough research and consider consulting with a financial advisor before making any investment decisions.
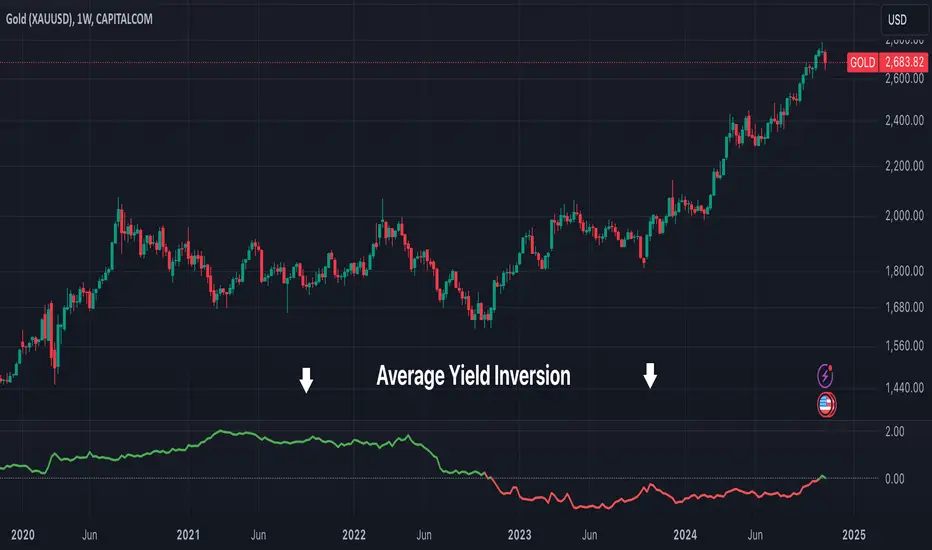
Average Yield InversionDescription:
This script calculates and visualizes the average yield curve spread to identify whether the yield curve is inverted or normal. It takes into account short-term yields (1M, 3M, 6M, 2Y) and long-term yields (10Y, 30Y).
Positive values: The curve is normal, indicating long-term yields are higher than short-term yields. This often reflects economic growth expectations.
Negative values: The curve is inverted, meaning short-term yields are higher than long-term yields, a potential signal of economic slowdown or recession.
Key Features:
Calculates the average spread between long-term and short-term yields.
Displays a clear graph with a zero-line reference for quick interpretation.
Useful for tracking macroeconomic trends and potential market turning points.
This tool is perfect for investors, analysts, and economists who need to monitor yield curve dynamics at a glance.
Ido strategy RSI Oversold with MACD Buy Signal Indicator
This indicator combines the Relative Strength Index (RSI) and the Moving Average Convergence Divergence (MACD) to help identify potential buy signals based on oversold conditions and trend reversals. This script is designed for traders looking to identify entry points when an asset is likely undervalued (oversold) and showing bullish momentum.
How It Works
RSI Oversold Detection: The RSI measures the speed and change of price movements. This indicator flags when the RSI falls below 30, signaling that the asset may be oversold. The user can customize the RSI lookback period and the timeframe within which oversold conditions are considered relevant.
MACD Crossover: The MACD line crossing above the Signal line often indicates a shift to bullish momentum. In this script, a buy signal is generated when a MACD bullish crossover occurs after an RSI oversold condition has been met within a user-defined lookback window.
Buy Signal: A green triangle appears below the price chart each time both conditions are met—when the RSI has recently been in oversold territory and the MACD line crosses above the Signal line. This signal suggests that the asset may be positioned for a potential upward trend, providing a visual cue for entry points.
Customizable Settings
RSI Settings: Adjust the RSI source and period length.
MACD Settings: Customize the fast, slow, and signal lengths of the MACD to suit different market conditions.
Lookback Period: Define how many bars back to check for an RSI oversold condition before confirming a MACD crossover.
Visual Elements
Oversold Background Color: The background on the price chart is shaded red whenever the RSI is below 30.
Buy Signal: A green triangle is displayed on the chart to indicate a potential entry point when both conditions are met.
Alerts
This indicator includes optional alerts, allowing traders to receive notifications whenever the conditions for a buy signal are met, making it easier to monitor multiple assets and stay informed of trading opportunities.
This indicator is ideal for traders using a combination of momentum and trend reversal strategies, especially in volatile markets where oversold conditions often precede a trend change.

Effective Volume (ADV) v3Effective Volume (ADV) v3: Enhanced Accumulation/Distribution Analysis Tool
This indicator is an updated version of the original script by cI8DH, now upgraded to Pine Script v5 with added functionality, including the Volume Multiple feature. The tool is designed for analyzing Accumulation/Distribution (A/D) volume, referred to here as "Effective Volume," which represents the volume impact in alignment with price direction, providing insights into bullish or bearish trends through volume.
Accumulation/Distribution Volume Analysis : The script calculates and visualizes Effective Volume (ADV), helping traders assess volume strength in relation to price action. By factoring in bullish or bearish alignment, Effective Volume highlights points where volume strongly supports price movements.
Volume Multiple Feature for Volume Multiplication : The Volume Multiple setting (default value 2) allows you to set a multiplier to identify bars where Effective Volume exceeds the previous bar’s volume by a specified factor. This feature aids in pinpointing significant shifts in volume intensity, often associated with potential trend changes.
Customizable Aggregation Types : Users can choose from three volume aggregation types:
Simple - Standard SMA (Simple Moving Average) for averaging Effective Volume
Smoothed - RMA (Recursive Moving Average) for a less volatile, smoother line
Cumulative - Accumulated Effective Volume for ongoing trend analysis
Volume Divisor : The “Divide Vol by” setting (default 1 million) scales down the Effective Volume value for easier readability. This allows Effective Volume data to be aligned with the scale of the price chart.
Visualization Elements
Effective Volume Columns : The Effective Volume bar plot changes color based on volume direction:
Green Bars : Bullish Effective Volume (volume aligns with price movement upwards)
Red Bars : Bearish Effective Volume (volume aligns with price movement downwards)
Moving Average Lines :
Volume Moving Average - A gray line representing the moving average of total volume.
A/D Moving Average - A blue line showing the moving average of Accumulation/Distribution (A/D) Effective Volume.
High ADV Indicator : A “^” symbol appears on bars where the Effective Volume meets or exceeds the Volume Multiple threshold, highlighting bars with significant volume increase.
How to Use
Analyze Accumulation/Distribution Trends : Use Effective Volume to observe if bullish or bearish volume aligns with price direction, offering insights into the strength and sustainability of trends.
Identify Volume Multipliers with Volume Multiple : Adjust Volume Multiple to track when Effective Volume has notably increased, signaling potential shifts or strengthening trends.
Adjust Volume Display : Use the volume divisor setting to scale Effective Volume for clarity, especially when viewing alongside price data on higher timeframes.
With customizable parameters, this script provides a flexible, enhanced perspective on Effective Volume for traders analyzing volume-based trends and reversals.

Jackson Volume breaker Indication# Jackson Volume Breaker Beta
### Advanced Volume Analysis Indicator
## Description
The Jackson Volume Breaker Beta is a sophisticated volume analysis tool that helps traders identify buying and selling pressure by analyzing price action and volume distribution. This indicator separates and visualizes buying and selling volume based on where the price closes within each candle's range, providing clear insights into market participation and potential trend strength.
## Key Features
1. **Smart Volume Distribution**
- Automatically separates buying and selling volume
- Color-coded volume bars (Green for buying, Red for selling)
- Winning volume always displayed on top for quick visual reference
2. **Real-time Volume Analysis**
- Shows current candle's buy/sell ratio
- Displays total volume with smart number formatting (K, M, B)
- Percentage-based volume distribution
3. **Technical Overlays**
- 20-period Volume Moving Average
- Dynamic scaling relative to price action
- Clean, uncluttered visual design
## How to Use
### Installation
1. Add the indicator to your chart
2. Adjust the Volume Scale input based on your preference (default: 0.08)
3. Toggle the Moving Average display if desired
### Reading the Indicator
#### Volume Bars
- **Green Bars**: Represent buying volume
- **Red Bars**: Represent selling volume
- **Stacking**: The larger volume (winning side) is always displayed on top
- **Height**: Relative to the actual volume, scaled for chart visibility
#### Information Table
The top-right table shows three key pieces of information:
1. **Left Percentage**: Winning side's volume percentage
2. **Middle Percentage**: Losing side's volume percentage
3. **Right Number**: Total volume (abbreviated)
### Trading Applications
1. **Trend Confirmation**
- Strong buying volume in uptrends confirms bullish pressure
- High selling volume in downtrends confirms bearish pressure
- Volume divergence from price can signal potential reversals
2. **Support/Resistance Breaks**
- High volume on breakouts suggests stronger moves
- Low volume on breaks might indicate false breakouts
- Monitor volume distribution for break direction confirmation
3. **Reversal Identification**
- Volume shift from selling to buying can signal potential bottoms
- Shift from buying to selling can indicate potential tops
- Use with price action for better entry/exit points
## Input Parameters
1. **Volume Scale (0.01 to 1.0)**
- Controls the height of volume bars
- Default: 0.08
- Adjust based on your chart size and preference
2. **Show MA (True/False)**
- Toggles 20-period volume moving average
- Useful for identifying volume trends
- Default: True
3. **MA Length (1+)**
- Changes the moving average period
- Default: 20
- Higher values for longer-term volume trends
## Best Practices
1. **Multiple Timeframe Analysis**
- Compare volume patterns across different timeframes
- Look for volume convergence/divergence
- Use higher timeframes for major trend confirmation
2. **Combine with Other Indicators**
- Price action patterns
- Support/resistance levels
- Momentum indicators
- Trend indicators
3. **Volume Pattern Recognition**
- Monitor for unusual volume spikes
- Watch for volume climax patterns
- Identify volume dry-ups
## Tips for Optimization
1. Adjust the Volume Scale based on your chart size
2. Use smaller timeframes for detailed volume analysis
3. Compare current volume bars to historical patterns
4. Watch for volume/price divergences
5. Monitor volume distribution changes near key price levels
## Note
This indicator works best when combined with proper price action analysis and risk management strategies. It should not be used as a standalone trading system but rather as part of a comprehensive trading approach.
## Version History
- Beta Release: Initial public version
- Features buy/sell volume separation, moving average, and real-time analysis
- Optimized for both intraday and swing trading timeframes
## Credits
Developed by Jackson based on other script creators
Special thanks to the trading community for feedback and suggestions
