Breakout Scanner (Screener)Breakout Scanner (Screener style — single indicator to drop in Screener tab)
Pita dan Kanal

Emmanuel Optuma Bar Colors v2This script colours TradingView’s Bar Chart to follow a simple, powerful bar-type logic used in Optuma-style analysis.
It makes the chart easier to read by showing the relationship between:
Up bars
Down bars
Outside bars
Inside bars
🔍 Bar Type Detection
Up Bar
Close > Previous close
→ Indicates upward strength
→ Coloured Green
Down Bar
Close < Previous close
→ Indicates downward pressure
→ Coloured Red
Outside Bar
High > Previous high and Low < Previous low
→ Market expands its range
→ Coloured Blue
Inside Bar
High < Previous high and Low > Previous low
→ Market contracts inside the previous bar
→ Follows previous bar’s colour
🎨 Colour Rules Summary
Bar Type Colour Meaning
Up Bar 🟩 Green Bullish pressure
Down Bar 🟥 Red Bearish pressure
Outside Bar 🔵 Blue Range expansion, bar resets structure
Inside Bar Same as previous bar Market indecision, continuation
🧠 Inside Bar Logic (Very Important)
Inside bars always copy the colour of the previous bar, which means:
If the previous bar was Green → inside bar becomes Green
If the previous bar was Red → inside bar becomes Red
If the previous bar was Blue → inside bar becomes Blue
This keeps the structure visually consistent and easy to read.
📈 Why This Helps Traders
This approach makes it easier to see:
✔ Trend continuation
Inside bars keep the trend colour, making swings clearer.
✔ Trend weakness
Inside bars after outside bars show contraction.
✔ Breakouts
Blue outside bars stand out as moments of range expansion.
✔ Market rhythm
The chart becomes easier to follow for beginners and advanced traders.
🧩 How to Use It
Set chart type to Bars
Add the script
Hide default colours (barcolor replaces them)
This instantly transforms TradingView into a teaching-friendly chart like Optuma.

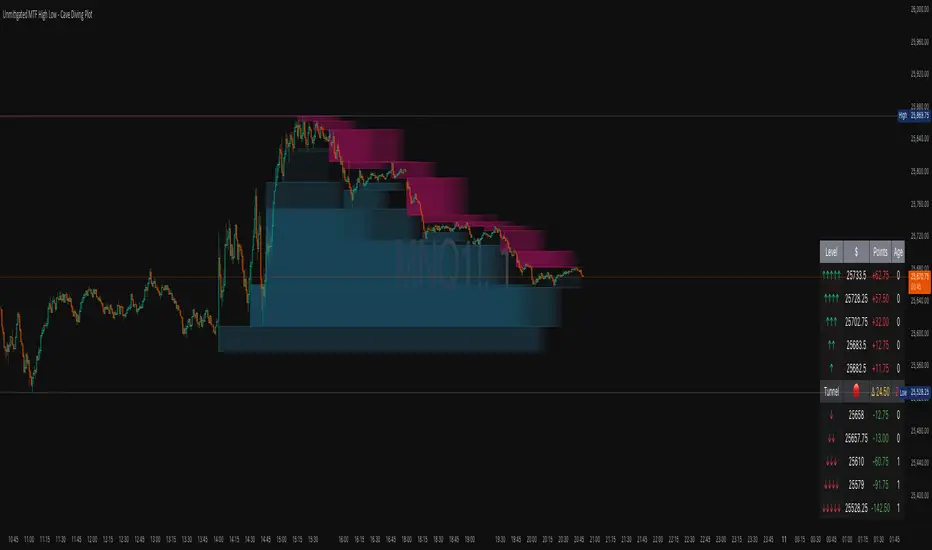
Unmitigated MTF High Low - Cave Diving Plot
IntroductionThe Unmitigated MTF High Low -
Cave Diving Plot is a multi-timeframe (MTF) indicator designed for NQ and ES futures traders who want to identify high-probability entry and exit zones based on unmitigated price levels. The "Cave Diving" visualization helps you navigate between support (floor) and resistance (ceiling) zones, while the integrated Strat analysis provides directional context.
Who Is This For?
Futures traders (NQ, ES) trading during ETH and RTH sessions
Scalpers and day traders looking for precise entry/exit levels
Traders using The Strat methodology for directional analysis
Anyone seeking confluence between price action and key levels
Core Concepts
1. Unmitigated Level:
An unmitigated level is a price high or low that has been created but not yet tested (touched) by price. These levels act as magnets - price often returns to test them.Key Properties:
Resistance (Highs): Price has created a high but hasn't revisited it
Support (Lows): Price has created a low but hasn't revisited it
Mitigation: When price touches a level, it becomes "mitigated" and loses strength
2. The Cave Diving MetaphorThink of trading as cave diving between two zones:
┌─────────────────────────────────┐
│ CEILING (Upper Band) │ ← 1st & 2nd Unmitigated Highs
│ 🟥 Resistance Zone │
├─────────────────────────────────┤
│ │
│ THE TUNNEL │ ← Price navigates here
│ (Trading Channel) │
│ │
├─────────────────────────────────┤
│ 🟢 Support Zone │
│ FLOOR (Lower Band) │ ← 1st & 2nd Unmitigated Lows
└─────────────────────────────────┘
Trading Concept:
Ceiling: Formed by the 1st and 2nd most recent unmitigated highs
Floor: Formed by the 1st and 2nd most recent unmitigated lows
Tunnel: The space between ceiling and floor where price operates
Cave Diving: Navigating between these zones for entries and exits
3. Session-Based Age TrackingLevels are tracked by session age:
Session: 6:00 PM to 5:00 PM NY time (23-hour window)
Age 0: Created in the current session (today)
Age 1: Created 1 session ago (yesterday)
Age 2+: Older levels (more significant)
Why Age Matters:
Older unmitigated levels are typically stronger magnets
Fresh levels (Age 0) may be weaker and easier to break
Age 2+ levels often provide high-probability reversal zones
Indicator Components
Visual Elements
1. Colored Bands (Cave Zones)Upper Band (Pink/Maroon - 95% transparency)
Space between 1st and 2nd unmitigated highs
Acts as resistance zone
Price often hesitates or reverses here
Lower Band (Teal - 95% transparency)
Space between 1st and 2nd unmitigated lows
Acts as support zone
Price often finds buyers here
2. Information Table Located in your chosen corner (default: Bottom Right), the table displays:
5 most recent unmitigated highs (top section)
Tunnel row (middle separator)
5 most recent unmitigated lows (bottom section)
Reading the TableTable Structure
┌────────┬──────────┬────────┬───────┐
│ Level │ $ │ Points │ Age │
├────────┼──────────┼────────┼───────┤
│ ↑↑↑↑↑ │ 21,450.25│ +45.30 │ 3 │ ← 5th High (oldest)
│ ↑↑↑↑ │ 21,425.50│ +32.75 │ 2 │ ← 4th High
│ ↑↑↑ │ 21,410.00│ +25.00 │ 1 │ ← 3rd High
│ ↑↑ │ 21,400.75│ +18.50 │ 1 │ ← 2nd High
│ ↑ │ 21,395.25│ +12.00 │ 0 │ ← 1st High (newest)
├────────┼──────────┼────────┼───────┤
│ Tunnel │ 🟢 │ Δ 85.50│ 2U │ ← Current State
├────────┼──────────┼────────┼───────┤
│ ↓ │ 21,310.00│ -15.25 │ 0 │ ← 1st Low (newest)
│ ↓↓ │ 21,295.50│ -22.75 │ 1 │ ← 2nd Low
│ ↓↓↓ │ 21,280.25│ -30.00 │ 1 │ ← 3rd Low
│ ↓↓↓↓ │ 21,265.75│ -38.50 │ 2 │ ← 4th Low
│ ↓↓↓↓↓ │ 21,250.00│ -45.00 │ 3 │ ← 5th Low (oldest)
└────────┴──────────┴────────┴───────┘Column
Breakdown
Column 1: Level (Arrows)
Green arrows (↑): Resistance levels above current price
Red arrows (↓): Support levels below current price
Arrow count: Indicates recency (1 arrow = newest, 5 arrows = oldest)
Why This Matters:
More arrows = older level = stronger magnet for price
Column 2: $ (Price)
Exact price of the unmitigated level
Use this for limit orders and stop placement
Column 3: Points (Distance)
Positive (+) for highs: Points above current price
Negative (-) for lows: Points below current price
Helps gauge proximity to key levels
Trading Application:
If you're +2.50 points from resistance, a reversal may be imminent
If you're -45.00 points from support, you're far from the floor
Column 4: Age (Sessions)
Number of full 6pm-5pm sessions the level has survived
Age 0: Created today (current session)
Age 1+: Created in previous sessions
Significance Ladder:
Age 0: Weak, may break easily
Age 1-2: Medium strength
Age 3+: Strong, high-probability reaction zone
Tunnel Row (Critical Information)│ Tunnel │ 🟢 │ Δ 85.50│ 2U │
└─┬─┘ └─┬─┘ └──┬──┘ └─┬─┘
│ │ │ │
Label Direction Range Strat
1. Tunnel Label: Identifies the separator row
2. Direction Indicator (🟢/🔴)
🟢 Green Circle: Current 15m bar closed bullish (above previous close)
🔴 Red Circle: Current 15m bar closed bearish (below previous close)
3. Δ (Delta/Range)
Distance in points between 1st High and 1st Low
Shows the tunnel width (trading range)
Example: Δ 85.50 = 85.50 points between ceiling and floor
Trading Use:
Wide tunnel (>100 points): More room to trade, consider range strategies
Narrow tunnel (<50 points): Tight range, expect breakout
4. Strat Pattern
1: Inside bar (consolidation)
2U: 2 Up (bullish directional bar)
2D: 2 Down (bearish directional bar)
3: Outside bar (expansion/volatility)
Color Coding:
Green: 2U (bullish)
Red: 2D (bearish)
Yellow: 3 (expansion)
Gray: 1 (inside/neutral)
IDLP – Intraday Daily Levels Pro [FXSMARTLAB]🔥 IDLP – Intraday Daily Levels Pro
IDLP – Intraday Daily Levels Pro is a precision toolkit for intraday traders who rely on objective daily structure instead of repainting indicators and noisy signals.
Every level plotted by IDLP is derived from one simple rule:
Today’s trading decisions must be based on completed market data only.
That means:
✅ No use of the current day’s unfinished data for levels
✅ No lookahead
✅ No hidden repaint behavior
IDLP reconstructs the previous trading day from the intraday chart and then projects that structure forward onto the current session, giving you a stable, institutional-style intraday map.
🧱 1. Previous Daily Levels (Core Structure)
IDLP extracts and displays the full previous daily structure, which you can toggle on/off individually via the inputs:
Previous Daily High (PDH)
Previous Daily Low (PDL)
Previous Daily Open
Previous Daily Close,
Previous Daily Mid (50% of the range)
Previous Daily Q1 (25% of the range)
Previous Daily Q3 (75% of the range)
All of these come from the day that just closed and are then locked for the entire current session.
What these levels tell you:
PDH / PDL – true extremes of yesterday’s price action (liquidity zones, breakout/reversal points).
Previous Daily Open / Close – how the market positioned itself between session start and end
Mid (50%) – equilibrium level of the previous day’s auction.
Q1 / Q3 (25% / 75%) internal structure of the previous day’s range, dividing it into four equal zones and helping you see if price is trading in the lower, middle, or upper quarter of yesterday’s range.
All these levels are non-repaint: once the day is completed, they are fixed and never change when you scroll, replay, or backtest.
🎯 2. Previous Day Pivot System (P, S1, S2, R1, R2)
IDLP includes a classic floor-trader pivot grid, but critically:
It is calculated only from the previous day’s high, low, and close.
So for the current session, the following are fixed:
Pivot P – central reference level of the previous day.
Support 1 (S1) and Support 2 (S2)
Resistance 1 (R1) and Resistance 2 (R2)
These levels are widely used by institutional desks and algos to structure:
mean-reversion plays, breakout zones, intraday targets, and risk placement.
Everything in this section is non-repaint because it only uses the previous day’s fully closed OHLC.
📏 3. 1-Day ADR Bands Around Previous Daily Open
Instead of a multi-day ADR, IDLP uses a pure 1-Day ADR logic:
ADR = Range of the previous day
ADR = PDH − PDL
From that, IDLP builds two clean bands centered around the previous daily Open:
ADR Upper Band = Previous Day Open + (ADR × Multiplier)
ADR Lower Band = Previous Day Open − (ADR × Multiplier)
The multiplier is user-controlled in the inputs:
ADR Multiplier (default: 0.8)
This lets you choose how “tight” or “wide” you want the ADR envelope to be around the previous day’s open.
Typical use cases:
Identify realistic intraday extension targets, Spot exhaustion moves beyond ADR bands, Frame reversals after reaching volatility extremes, Align trades with or against volatility expansion
Again, since ADR is calculated only from the completed previous day, these bands are totally non-repaint during the current session.
🔒 4. True Non-Repaint Architecture
The internal logic of IDLP is built to guarantee non-repaint behavior:
It reconstructs each day using time("D") and tracks:
dayOpen, dayHigh, dayLow, dayClose for the current day
prevDayOpen, prevDayHigh, prevDayLow, prevDayClose for the previous day
At the moment a new day starts:
The “current day” gets “frozen” into prevDay*
These prevDay* values then drive: Previous Daily Levels, Pivots, ADR.
During the current day:
All these “previous day” values stay fixed, no matter what happens.
They do not move in real time, they do not shift in replay.
This means:
What you see in the past is exactly what you would have seen live.
No fake backtests.
No illusion of perfection from repainting behavior.
🎯 5. Designed For Intraday Traders
IDLP – Intraday Daily Levels Pro is made for:
- Day traders and scalpers
- Index and FX traders
- Prop firm challenge trading
- Traders using ICT/SMC-style levels, liquidity, and range logic
- Anyone who wants a clean, institutional-style daily framework without noise
You get:
Previous Day OHLC
Mid / Q1 / Q3 of the previous range
Previous-Day Pivots (P, S1, S2, R1, R2)
1-Day ADR Bands around Previous Day Open
All calculated only from closed data, updated once per day, and then locked.

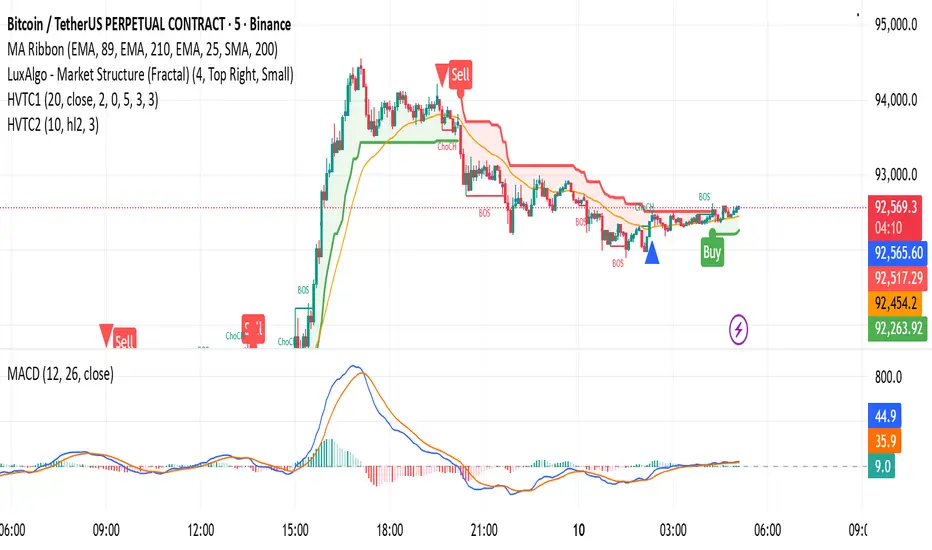
HVTC 1HVTC – SMC Market Structure & Trend Indicator
HVTC is a Smart Money Concepts–based tool that helps traders visualize market structure and trend direction with clarity.
Features:
CHoCH & BOS Detection
Automatically identifies structural shifts using true SMC logic and labels them directly on the chart.
Trend Filter
Confirms bullish or bearish conditions using an internal trend system to keep trades aligned with the major direction.
EMA 25 Guide
EMA 25 acts as dynamic support/resistance, helping define momentum and bias.
Alerts (Optional)
Notify traders when CHoCH/BOS or key retests occur—ideal for those who don’t monitor charts continuously.
Use Cases:
Works for Crypto, Forex, Gold, Indices, and Stocks across all timeframes. Helps improve entries, exits, and overall market understanding based on institutional structure.
Not financial advice. Use with proper risk management.
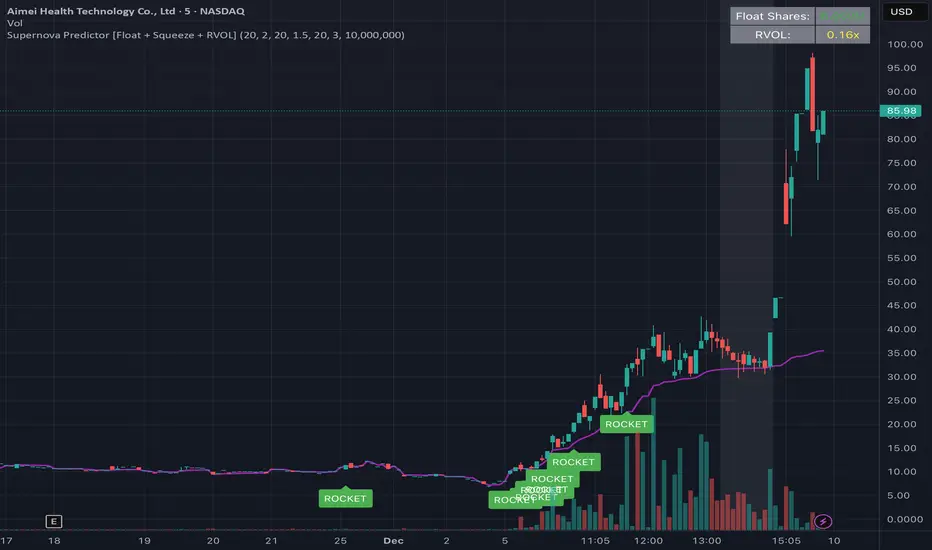
W Alart Supernova Predictor [Float + Squeeze + RVOL]the script will automatically fetch the Float size of the stock you are looking at.
If the Float is Low (< 10M), it will show a "Low Float" label on the chart.
The "ROCKET" alert will ONLY fire if the stock is actually a Low Float stock. This prevents you from getting false signals on heavy stocks like Apple or Tesla.
How to read the signals on your chart
The Grey Background (The Warning):
When you see the background of the chart turn Grey, this indicates a Squeeze.
This matches the left side of your screenshot where the price was flat. It tells you: "Pay attention, energy is building up."
The Purple Line:
This is the VWAP. Generally, you only want to take long trades when the price is above this line.
The "ROCKET" Label:
This label will appear only when three things happen at once:
Price breaks the upper Bollinger Band.
Price is above VWAP.
Volume is 2.5x higher than average (you can change this number in settings).
******A Crucial Note on "False Positives"****
This script is designed to catch the start of the move. However, sometimes a stock will break out and then immediately fail (a "fake out").
To protect yourself, professional traders usually wait for the candle with the "ROCKET" signal to close, and then enter the trade only if the next candle breaks the high of that signal candle.
gelizon ema pack (9 EMA, 21 EMA, 55 EMA, 200 SMA)This indicator plots a set of commonly used moving averages designed for trend identification, momentum confirmation, and multi-timeframe alignment. It includes three exponential moving averages (9, 21, 55) and one long-term simple moving average (200). These moving averages help traders quickly assess short-term momentum, medium-term trend structure, and overall market direction.
Included Moving Averages:
9 EMA – Fast momentum guide; useful for scalping and intraday trend continuation.
21 EMA – Medium-speed EMA that helps identify short-term trend structure.
55 EMA – Smoother trend line offering a broader view of momentum flow.
200 SMA – Widely used long-term trend benchmark for overall market bias.
Features:
Toggle each moving average on or off
Customize colors for all MAs
Clean overlay design for easy chart interpretation
This indicator is ideal for day traders, swing traders, and algorithmic setups that rely on moving-average alignment or crossover behavior to confirm trend direction and identify high-probability entries.

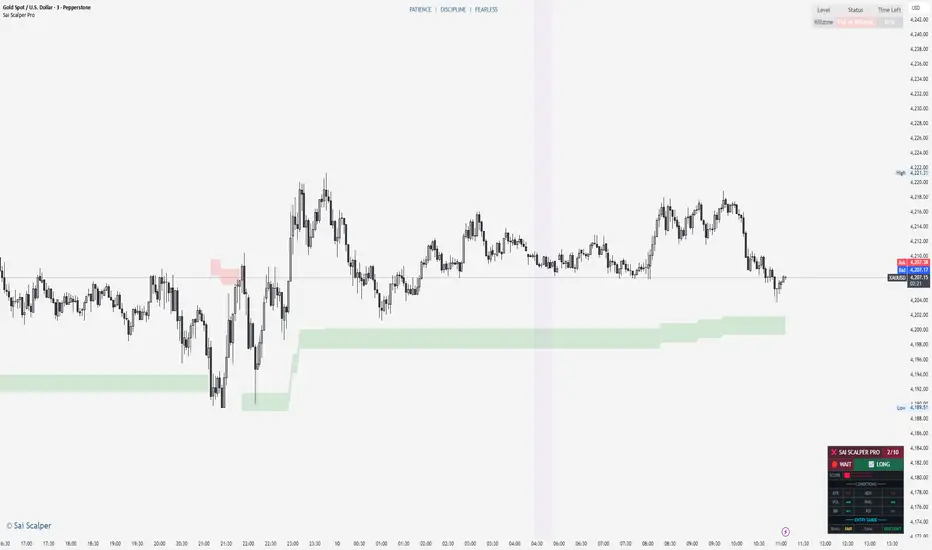
Sai Scalper ProSai Scalper Pro – Feature Summary
Trend Engine
- ATR-based trailing stop with Fibonacci levels (61.8%, 78.6%, 88.6%)
- Auto trend detection with swing point tracking
Scalping Detection (0-10 Score)
- Analyzes 7 factors: ATR compression, ADX, Volume, Range, Consolidation, RSI, BB Squeeze
- Smart state machine with hysteresis to prevent false signals
- Adjustable sensitivity & stability settings
Cloud Modes (7 Options)
- Full Zone, Entry Zone, Premium/Discount, Fib Bands, Upper/Middle/Lower Band
Pro Dashboard
- Real-time scalp score with visual meter
- Entry quality rating & zone display
- Suggested TP/SL based on ATR
- Session detection (Sydney/Tokyo/London/NY) with overlap alerts
- 3 styles (Minimal/Pro/Full) × 4 sizes × 9 positions
Alerts
- Scalp ready, Prime conditions (8+), Optimal entry zone
- Direction-specific (Long/Short bias)
Combines trend-following Fibonacci analysis with intelligent ranging detection for optimal scalping opportunities.

3EMA-8EMA Current Candle Scannerintraday scanner can also be used for short term trades, crossing above the ema high and low with volume gives signal

Price BoundariesThe Price Boundaries indicator plots two dynamic levels above and below the current market price. These levels help traders visualize a custom price band around the instrument, assisting with intraday bias, breakout zones, stop-loss planning, or scalp targets.
You can set the distance between the current price and each boundary using a user-defined input. For example, if the price is 6250 and the distance is set to 25, the indicator will automatically draw lines at 6275 (upper boundary) and 6225 (lower boundary). These levels update every candle based on the closing price.
This tool is useful for:
Marking expected movement ranges
Planning mean-reversion or breakout setups
Creating consistent distance-based zones
Visual reference for volatility compression or expansion
The indicator also optionally shades the area between the boundaries to make the zone easier to spot on the chart.

VWAP + EMA9 With SignalsThis script is for scalping on the 5 minute timeframe. It contains signals that indicate intersection of VWAP by the EMA9. It contains Buy signals when a candle closes above both lines indicating a quick continuation of a long position (quick scalp) as well as Sell signals when a candle closes below both lines indicating a quick continuation of a short position (quick scalp). Please note that i do not recommend entries at Buy and Sell signals during Accumulation/Consolidation. Positions should be taken with volume.

Pre-Market + Previous Session High/LowThis script plots the key intraday levels most daytraders watch:
Today’s Pre-Market High & Low
Previous Regular Session High & Low

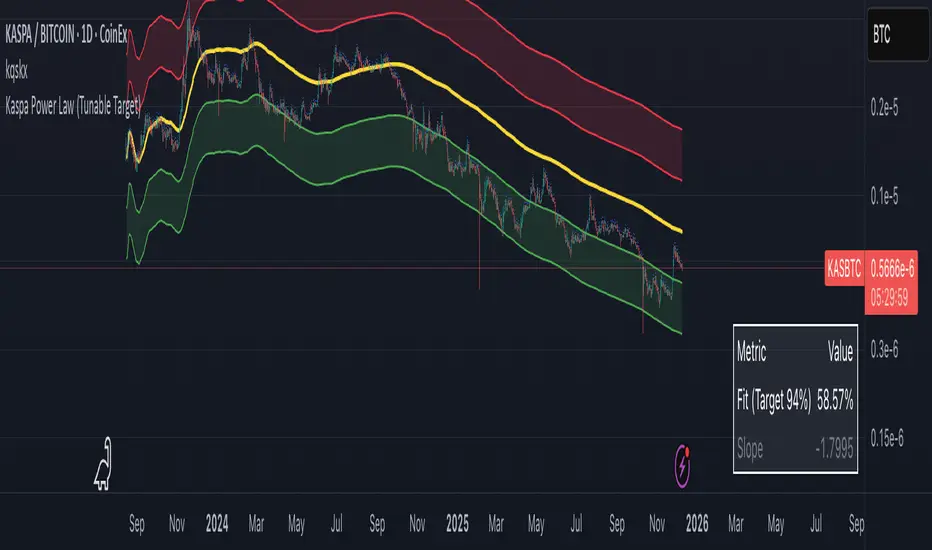
Kaspa Power Law (R=94%)Kaspa Power Law indicatior with 94% regression fit.
i have found that it may be more useful on the kas/btc chart.
Multi SMAOverlay indicator that displays a complete set of Simple Moving Averages in a single script: SMA 5, 10, 15, 20, 25, 30, 35, 40, 45, 50, 100, and 200.
It includes a selectable source (close, hl2, etc.) and two toggles to quickly show/hide short-term SMAs (5–50) and long-term SMAs (100–200). Ideal for analyzing trend direction, moving average alignment, and dynamic support/resistance zones directly on the price chart.

8EMA+BB-SubiProvides the facility to display 8 EMAs along with Bollinger Bands in the same indicator.

rosha xau-usd 3.1.6 (v6)one of my fresh creations, use to trade profitably, includes months of my analysis and sgreen time for you all xauusd traders

BB & MTF EMAs + DPOC/WPOC v0.1This indicator combines multiple trend and support/resistance tools into a single overlay with specific customization for the Indian Standard Time (IST) session.
Features Included:
Bollinger Bands: 20-period SMA Basis, 1.5 StdDev.
4 Multi-Timeframe EMAs:
EMA 1: 9 Length (1m timeframe)
EMA 2: 20 Length (3m timeframe)
EMA 3: 50 Length (15m timeframe)
EMA 4: 200 Length (15m timeframe)
Session POCs (IST):
Daily POC (DPOC): Calculated 05:30-05:29 IST. Extends for full 24h session.
Weekly POC: Calculated from Monday 05:30 IST Open. Extends for full 7-day week.
Controls:
Toggle visibility for all individual components.
"Show Historical" toggle for pivots to see past levels or keep charts clean.
2 days ago
Release Notes
Description:
This indicator combines multiple trend and support/resistance tools into a single overlay with specific customization for the Indian Standard Time (IST) session.
Features Included:
Bollinger Bands: 20-period SMA Basis, 1.5 StdDev.
4 Multi-Timeframe EMAs:
EMA 1: 9 Length (1m timeframe)
EMA 2: 20 Length (3m timeframe)
EMA 3: 50 Length (15m timeframe)
EMA 4: 200 Length (15m timeframe)
Session POCs (IST):
Daily POC (DPOC): Calculated 05:30-05:29 IST. Extends for full 24h session.
Weekly POC: Calculated from Monday 05:30 IST Open. Extends for full 7-day week.
Controls:
Toggle visibility for all individual components.
"Show Historical" toggle for pivots to see past levels or keep charts clean.

rosha 3.1.6 (v6)ema based for scalping xauusd,good during london and newyork sassions, use withour modifications, dont enter in tranverse markate

Dual Session Range Boxes with FIB Lines█ OVERVIEW
The Dual Session Range Boxes with FIB Lines indicator is a powerful tool for identifying and visualizing Range Breakout or Inside Boxes Strategy setups with dual session tracking, customizable Fibonacci extensions, and trade zone levels. Perfect for traders who focus on session-based strategies across multiple markets.
█ FEATURES
◆ DUAL SESSION RANGES
- Range 1: Defines the Range (ORB) based on a specific time window
- Range 2: Extends the Range levels throughout a second session for trade management
- Both ranges can be independently configured with preset sessions or custom times
◆ SESSION PRESETS
- Tokyo Session (00:00 - 09:00)
- London Session (08:00 - 17:00)
- New York Session (14:00 - 21:00)
- Pre Market Session (10:00 - 15:30)
- Custom Time: Define your own session windows
◆ FIBONACCI EXTENSION LEVELS
- Automatically calculated from Range 1 High/Low
- Buy Side Levels: Projected above the range (green)
- Sell Side Levels: Projected below the range (red)
- 10 customizable Fib levels with individual on/off toggles:
- 23.6%, 38.2%, 50%, 61.8%, 78.6%, 100%, 127.2%, 161.8%, 200%, 261.8%
- Special color highlighting for key levels (50%, 100%, 200%)
- All percentage values are fully editable
◆ INSIDE TRADE ZONES
- Two horizontal lines drawn inside the Range 1 box
- Configurable percentage from High/Low (default: 10%)
- Helps identify premium/discount zones within the range
◆ LABELS & DISPLAY OPTIONS
- Show/hide price values on labels
- Show/hide percentage values on labels
- Adjustable label size (Tiny, Small, Normal, Large, Huge)
- Configurable label offset (distance above lines)
- Multiple rounding options for price display:
- 0.25 (quarter points - ideal for indices)
- 0.1 (tenth points)
- 0.01 (two decimals)
◆ STYLE CUSTOMIZATION
- Independent fill and border colors for both ranges
- Adjustable border width (1-5)
- Line style options: Solid, Dashed, Dotted
- Separate color settings for:
- Buy side Fibonacci levels
- Sell side Fibonacci levels
- Trade zone lines
- Special levels (50%, 100%, 200%)
◆ HISTORICAL DATA CONTROL
- Toggle to show/hide historical sessions
- Current session always remains visible
- Clean chart view when analyzing only the active session
█ HOW TO USE
1. Set your timezone in General settings
2. Configure Range 1 to capture your desired Opening Range period
3. Configure Range 2 to define how long levels should extend
4. Adjust Fibonacci levels based on your trading strategy
5. Use Trade Zones to identify key areas within the range
6. Toggle historical data on/off based on your analysis needs
█ USE CASES
- Opening Range Breakout (ORB) strategies
- Session-based trading (London, New York, Tokyo, Pre-Market)
- Fibonacci extension targets for breakout trades
- Identifying support/resistance from session ranges
- Multi-session analysis and confluence zones
█ NOTES
- Indicator works on timeframes lower than Daily
- All times are based on the selected timezone setting
- Range 2 only activates after Range 1 completes
- Fibonacci levels extend from Range 1 start to Range 2 end
Let me know if you like to have any enhancements.
Leave a like if you like it!

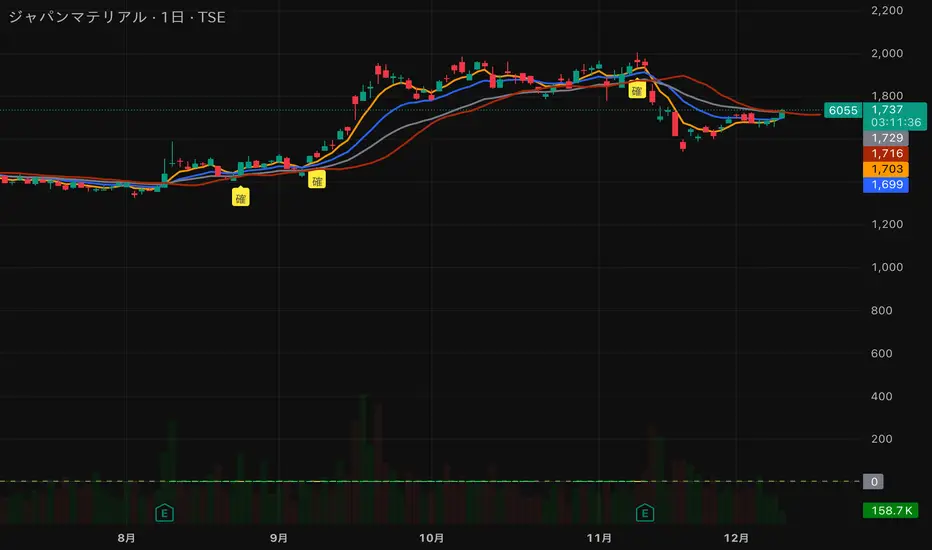
猛の掟・初動スクリーナー v3//@version=5
indicator("猛の掟・初動スクリーナー v3", overlay=true)
// ===============================
// 1. 移動平均線(EMA)設定
// ===============================
ema5 = ta.ema(close, 5)
ema13 = ta.ema(close, 13)
ema26 = ta.ema(close, 26)
plot(ema5, title="EMA5", color=color.orange, linewidth=2)
plot(ema13, title="EMA13", color=color.new(color.blue, 0), linewidth=2)
plot(ema26, title="EMA26", color=color.new(color.gray, 0), linewidth=2)
// ===============================
// 2. MACD(10,26,9)設定
// ===============================
fast = ta.ema(close, 10)
slow = ta.ema(close, 26)
macd = fast - slow
signal = ta.ema(macd, 9)
macdBull = ta.crossover(macd, signal)
// ===============================
// 3. 初動判定ロジック
// ===============================
// ゴールデン並び条件
goldenAligned = ema5 > ema13 and ema13 > ema26
// ローソク足が26EMAより上
priceAbove26 = close > ema26
// 3条件すべて満たすと「確」
bullEntry = goldenAligned and priceAbove26 and macdBull
// ===============================
// 4. スコア(0=なし / 1=猛 / 2=確)
// ===============================
score = bullEntry ? 2 : (goldenAligned ? 1 : 0)
// ===============================
// 5. スコアの色分け
// ===============================
scoreColor = score == 2 ? color.new(color.yellow, 0) : score == 1 ? color.new(color.lime, 0) : color.new(color.gray, 80)
// ===============================
// 6. スコア表示(カラム)
// ===============================
plot(score,
title="猛スコア (0=なし,1=猛,2=確)",
style=plot.style_columns,
color=scoreColor,
linewidth=3)
// 目安ライン
hline(0, "なし", color=color.new(color.gray, 80))
hline(1, "猛", color=color.new(color.lime, 60))
hline(2, "確", color=color.new(color.yellow, 60))
// ===============================
// 7. チャート上に「確」ラベル
// ===============================
plotshape(score == 2,
title="初動確定",
style=shape.labelup,
text="確",
color=color.yellow,
textcolor=color.black,
size=size.tiny,
location=location.belowbar)
Pious 3EMA-8EMA with 89ema when the stock price is above 89 ema and 3emah is above 8emah and 3emal is above 8emal buy prefers and vice versa, other conditions are additive to it
