Popgun Bar PatternI created this script to research the trading effectiveness of the Popgun Bar Pattern.
The Popgun Bar Pattern is found when 3 candlesticks in order form the following pattern:
0. Any bar that is then followed by:
1. An inside bar. This is a bar that is completely engulfed by the bar before it. It will have a lower high and a higher low than the previous bar.
2. An outside bar immediately after. This is a bar that completely engulfs the prior inside bar. It will have a higher high and a lower low than the previous bar.
Simply put, the Popgun Bar Pattern is an inside bar followed by an outside bar.
I would highly recommend incorporating this signal as a "trigger" for existing technical analysis. Used in isolation it may not have a high probability of success.
To make it more effective as a trigger to a trading signal I incorporated into my code an Entry, Stop, and a Target dot.
The Entry dot is offset from the low of a bearish Popgun Bar Pattern or the high of a bullish Popgun Bar Pattern by a factor of ATR. The default ATR percentage is 33% but can be adjusted.
The Stop dot is based on the recent highest high (bearish) or lowest low (bullish) of a set range (default is 9 bars) plus/minus the ATR percentage buffer.
The Target dot is automatically calculated from the entry based on a configurable reward factor (default is 3) from the entry to stop distance. This projects a potential 3:1 reward/risk trade by default.
There is an additional alert condition which can be configured at the end of the script.
Rata-Rata Rentang Sebenarnya / Average True Range (ATR)

ATR color zones with volume radar [LM]Hello Guys,
I would like to introduce you the ATR color zones with volume radar indicator. It's a fork of @GlobalMarketSignals "GMS: Mr. Yen's Color Zone" shout-out to him.
I have enriched it -> that zones are calculated based on the ATR and percentages as described below and volume radar on candle bars. You can select from which timeframe color zones are calculated.
Zones:
white line is the previous period close
red zone = +/- 20% ATR of previous period
yellow zone = +/- 40% ATR of previous period
green zone = +/- 60% ATR of previous period
blue zone = +/- 100% ATR of previous period
Volume radar:
lime = above volume MA average multiplied by multiplier up bar
maroon = above volume MA average multiplied by multiplier down bar
black = volume is decreasing but is not below half of volume MA
navy = volume is decreasing and is below half of volume MA
markers are shown when volume is increasing two consecutive candle in row in direction of the candle
Any suggestions are welcomed

CC - Array-meta Consolidated Interval Display (ACID)This script extends my other two Array examples (which I've also provided to you open source):
The Ticker-centric 5m,15m,45m,1h,4h,1d resolution labels using arrays:
And the more Macro VIX,GLD,TLT,QQQ,SPY,IWM 1d resolution labels using arrays:
This script aims to show how to use min/max/avg with Arrays easily. My next example after this will be exploring the usage of variance versus covariance ratios over different periodic interval resolutions. Currently, this is using the following intervals: 5m,15m,45m,1h,4h,1d. It takes these intervals, calculates the values at those resolutions and puts the absolute min and max from the 5 minute to the 1 day resolutions.
It's more of an example of the power that arrays can hold, as all this truly is right now is a min/max bound calculator. The real gem lies in the avg calculators for multiple resoltuions tied into a single label with readable data. Check out the code and let me know what you think. If you need more examples, the other two scripts I mentioned before are also open source.
Using this on intervals of less than 1D sometimes times out, the way I wrote it is memory intensive, may not work for non-pro users.
Thanks!
NONE OF THIS IS FOREWARD LOOKING STATEMENTS, THIS IS NOT A PREDECTIVE ANALYSIS TOOL. THIS IS A RESEARCH ATTEMPT AT A NOVEL INDICATOR. I am not responsible for outcomes using it.
Please use and give criticisms freely. I am experimenting with combining resolutions and comparing covariance values at different levels right now, so let me know your thoughts! The last indicator will likely not be open source, but may be depending on how complex I get.

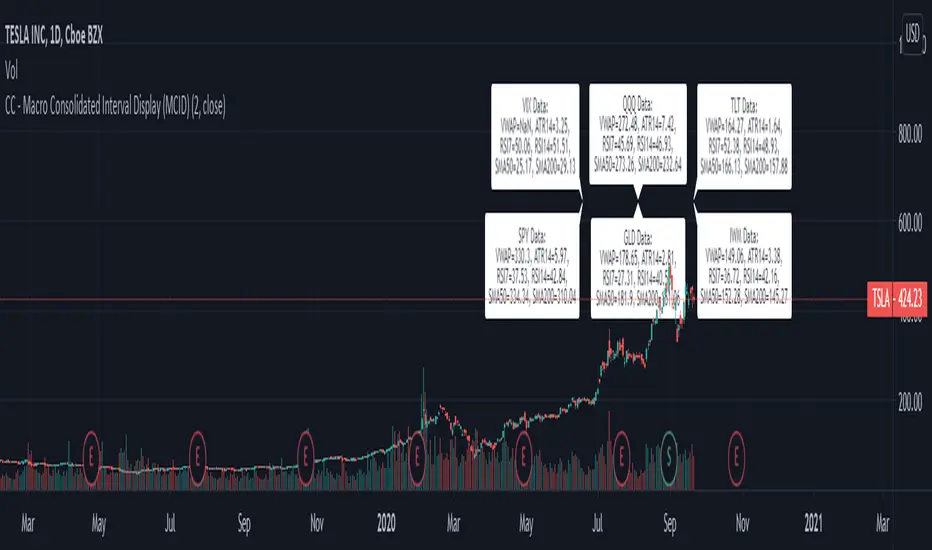
CC - Macro Consolidated Interval Display (MCID)Ever wish you didn't have to rapidly flip between 6 different tickers to get the full picture?
Yeah, me too. Do you also wish that you kind of understood how the shift / unshift function works for arrays?
Yeah, I did too. Both of those birds are taken care of with one stone!
The Macro Consolidated Interval Display uses the new Array structure and security to display data for VIX, GLD, TLT, QQQ, SPY and IWM (at a 1D interval) SIMUTANEOUSLY! Regardless of which ticker you're looking at you can get the full picture of macro futures data without flipping around to get it.
This is my first script trying to use arrays. It basically shows the following a 1d interval:
ATR14, RSI7, RSI14, SMA50, SMA200 and VWAP for VIX.
ATR14, RSI7, RSI14, SMA50, SMA200 and VWAP for GLD.
ATR14, RSI7, RSI14, SMA50, SMA200 and VWAP for TLT.
ATR14, RSI7, RSI14, SMA50, SMA200 and VWAP for QQQ.
ATR14, RSI7, RSI14, SMA50, SMA200 and VWAP for SPY.
ATR14, RSI7, RSI14, SMA50, SMA200 and VWAP for IWM
To make it more or less busy, I've allowed you to toggle off any of the levels you wish. I've also chosen to leave this as open source, as it's nothing too experimental, and I hope that it can gain some traction as an Array example that the public can use! If you don't like the different values that are shown, use this source code example as a spring-board to put values that you do care about onto the labels.
If this code has helped you at all please drop me a like or some constructive criticism if you do not think it's worth a like.
Good luck and happy trading friends. This should be compatible with my CID as well:
If this gets traction, I will post something similar for a dynamic combination of tickers and intervals that you can set yourself.
CC - Consolidated Interval Display (CID)Ever wish you didn't have to rapidly flip between 6 different intervals to get the full picture?
Yeah, me too. Do you also wish that you kind of understood how the shift / unshift function works for arrays?
Yeah, I did too. Both of those birds are taken care of with one stone!
The Consolidated Interval Display uses the new Array structure and security to display data for 5m, 15m, 45m, 1h, 4h and 1d intervals SIMUTANEOUSLY! Regardless of which interval you're looking at you can get the full picture of numerical data without flipping around to get it.
This is my first script trying to use arrays. It basically shows the following for the given ticker:
ATR14, RSI7, RSI14, SMA50, SMA200 and VWAP at the 5 minute level.
ATR14, RSI7, RSI14, SMA50, SMA200 and VWAP at the 15 minute level.
ATR14, RSI7, RSI14, SMA50, SMA200 and VWAP at the 45 minute level.
ATR14, RSI7, RSI14, SMA50, SMA200 and VWAP at the 1 hour level.
ATR14, RSI7, RSI14, SMA50, SMA200 and VWAP at the 4 hour level.
ATR14, RSI7, RSI14, SMA50, SMA200 and VWAP at the 1 day level.
To make it more or less busy, I've allowed you to toggle off any of the levels you wish. I've also chosen to leave this as open source, as it's nothing too experimental, and I hope that it can gain some traction as an Array example that the public can use! If you don't like the different values that are shown, use this source code example as a spring-board to put values that you do care about onto the labels.
If this code has helped you at all please drop me a like or some constructive criticism if you do not think it's worth a like.
Good luck and happy trading friends.
If this gets traction, I will post something similar for a combination of SPY, VIX, GOLD, QQQ, IWM and TLT.

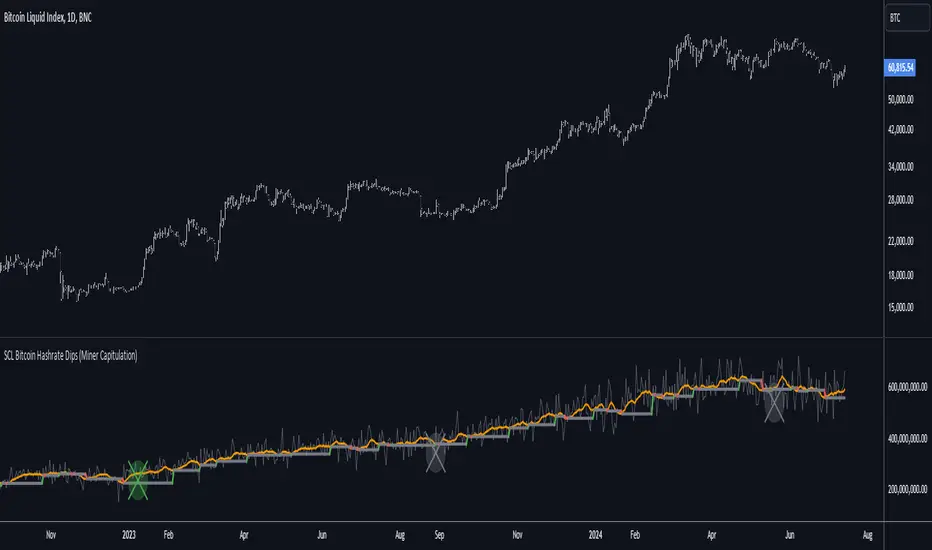
[SCL] Bitcoin Hashrate Dips (Miner Capitulation)Gives long-term buy signals for Bitcoin from dips and recoveries in the hashrate (the "miner capitulation" theory). It has an overlay and a standalone mode and is fully configurable. It uses Williams Lows and ATR instead of moving averages.
Features that might be interesting for Pinescripters:
+ Automatic (as far as is possible currently) adjustment of plots for overlay and standalone display modes.
+ A neat label function for debugging floats
+ Fully commented
+ The debug that I used to overcome problems in developing it is left in
+ Ideas for how to deal with a wildly oscillating and exponentially increasing data source
You need to run this indicator on the Bitcoin daily chart for it to make any sense. The best is a BTC/USD chart with a long history, such as BNC:BLX.
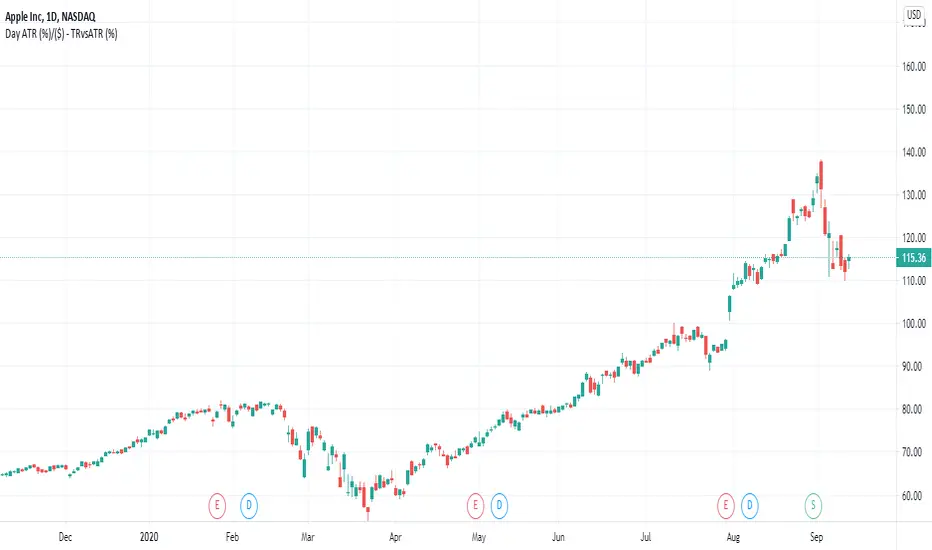
Daily Average True RangeThis script should give you a quick idea how far your stock has moved intraday compared to the ATR.
Label Display DemoA label function for display an arbitrary value above or below the chart.
There is no convenient way to display the value of a variable in pinescript. This is most convenient way I found.
It will follow the current bar (the position is calculated with highest/lowest and atr value, as such it will never display over the chart)
In this script we display ATR for the example

Volatility GuppyBased on my previous script "Turtle N Normalized," this script plots the CM SuperGuppy on the value of N to identify changing trends in the volatility of any instrument.
Turtle rules taken from an online PDF:
"The Turtles used a concept that Richard Dennis and Bill Eckhardt called N to represent the underlying volatility of a particular market.
N is simply the 20-day exponential moving average of the True Range, which is now more commonly known as the ATR. Conceptually, N represents the average range in price movement that a particular market makes in a single day, accounting for opening gaps. N was measured in the same points as the underlying contract.
The Turtles built positions in pieces which we called Units. Units were sized so that 1 N represented 1% of the account equity. Thus, a unit for a given market or commodity can be calculated using the following formula:
Unit = 1% of Account/(N x Dollars per Point)"
To normalize the Unit formula, this script instead takes the value of (close/N). Dollars per point = 1 for stocks and crypto, but will change depending on the contract specifications for individual futures .
"Since the Turtles used the Unit as the base measure for position size, and since those units were volatility risk adjusted, the Unit was a measure of both the risk of a position, and of the entire portfolio of positions."
When the EMA's are green, volatility is decreasing.
When the EMA's are red, volatility is increasing.
When the EMA's are grey, the trend is changing.

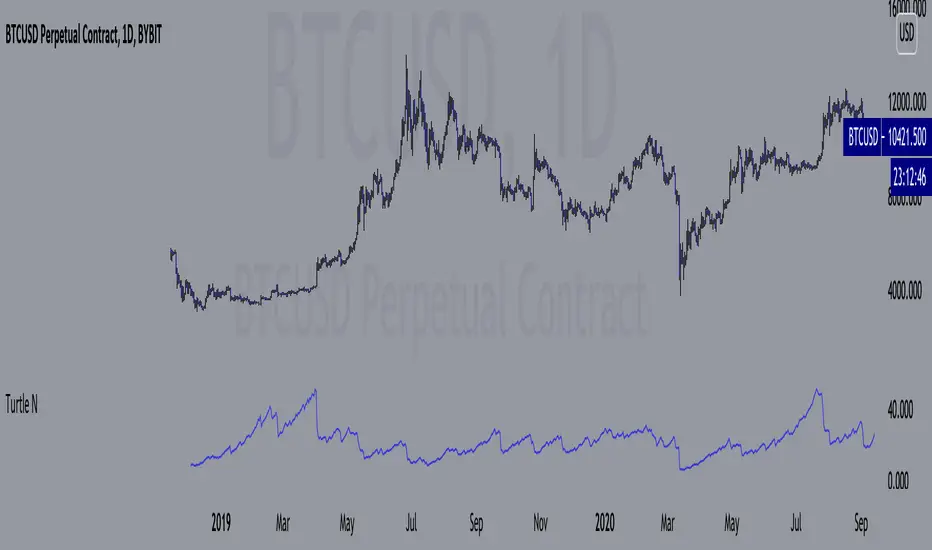
Turtle N NormalizedSimple script that calculates the normalized value of N. Rules taken from an online PDF containing the original Turtle system:
"The Turtles used a volatility-based constant percentage risk position sizing algorithm. The Turtles used a concept that Richard Dennis and Bill Eckhardt called N to represent the underlying volatility of a particular market.
N is simply the 20-day exponential moving average of the True Range, which is now more commonly known as the ATR. Conceptually, N represents the average range in price movement that a particular market makes in a single day, accounting for opening gaps. N was measured in the same points as the underlying contract.
The Turtles built positions in pieces which we called Units. Units were sized so that 1 N represented 1% of the account equity. Thus, a unit for a given market or commodity can be calculated using the following formula:
Unit = 1% of Account/(N x Dollars per Point)"
To normalize the Unit formula, this script instead takes the value of (close/N). Dollars per point = 1 for stocks and crypto, but will change depending on the contract specifications for individual futures.
"Since the Turtles used the Unit as the base measure for position size, and since those units were volatility risk adjusted, the Unit was a measure of both the risk of a position, and of the entire portfolio of positions."
When the value of N is high, volatility is low and you should be more risk-on.
When the value of N is low, volatility is high and you should be more risk-off.
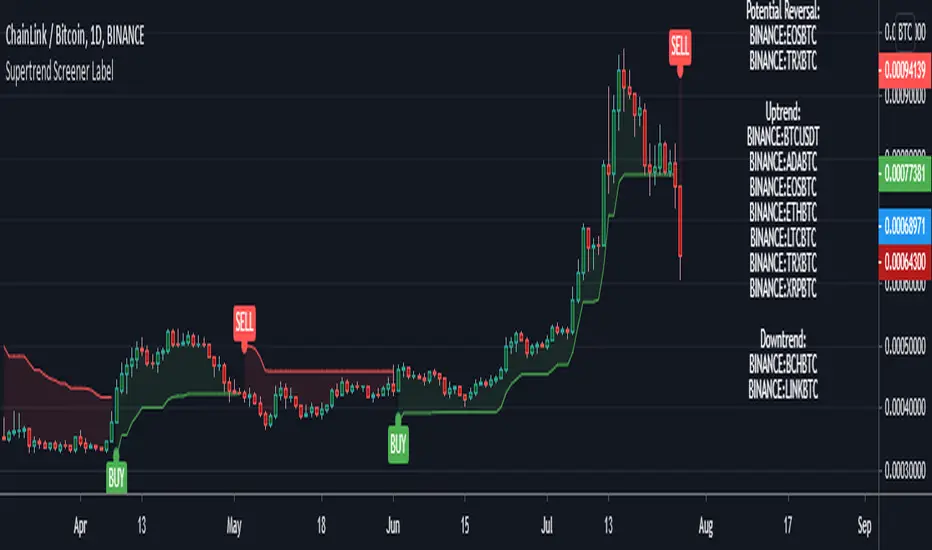
Supertrend Screener LABELThis screens for Supertrend reversal's in 10 different securities. The main logic for the screener is taken from "Simple Custom Screener in Pinescript" by QuantNomad with his permission. If the label color is not visible due to the text in it being white colored, then choose a different color from settings. Also added a simple supertrend to it.
Terminology explanation:
Confirmed Reversal: Supertrend reversal that happened in the last bar and cannot be repainted.
Potential Reversal: Supertrend reversal that might happen in the current bar but can also not happen depending upon the timeframe closing price.
Uptrend/Downtrend : Shows all the tickers that are either currently in uptrend or downtrend.
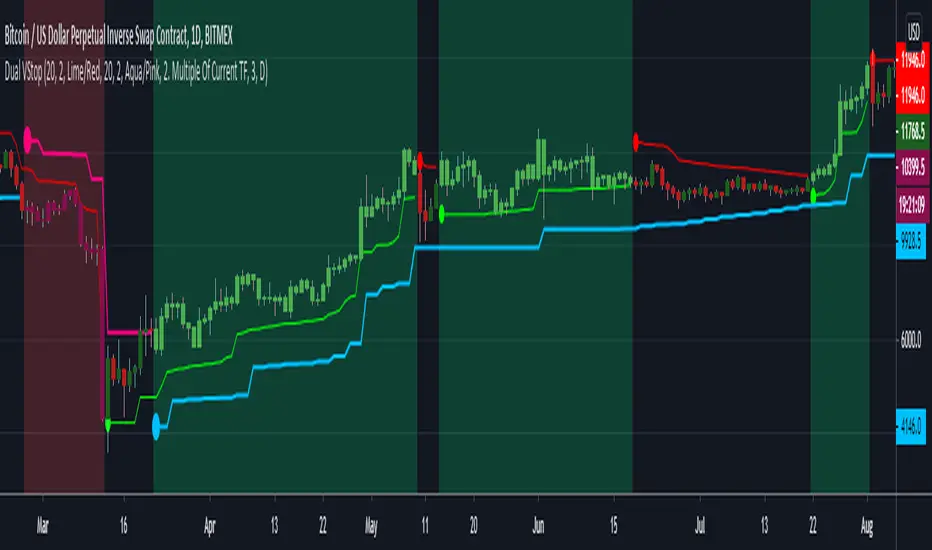
Dual Volatility StopThis merges Volatility Stop & its MTF version both published by u/TradingView . Background is colored green or red when both the current timeframe Vstop and higher timeframe Vstop point in same direction. Aim is to take the standard Vstop script which differentiates market from only uptrend/downtrend to uptrend/downtrend/sideways. There is a tradeoff with this, that there is no need for the Vstop to be always in a position which reduces trade time & frees up capital. However this leads to situations where it takes slightly more time to catch on to a trend after a reversal.
Green Background = Buy
Red Background = Sell
No Background = Flat
ATR Daily LevelsPlots the daily ATR on the chart as upper and lower levels.
It can be use to adapt your trading in high and low periods of market volatility, determine reasonable target or take profit, entry at likely mean reversion, stop loss beyond normal flows etc...
More on the script behavior:
- Daily ATR upper/lower levels are applied on the current day low/high;
- The ATR value is defined by the last D1 bar;
- Shows up to D1 timeframe;
- Configuration for the indicator's period (default: 20 period ATR);
- Configuration for plotting the indicator on the the x axis with an offset/at begining of the day (default: offset);

Daily Range 1) Daily high - low range as a column chart
2) If differentiates the days of the week, Wednesday - Blue, Thursday - Red

Stop Loss PanelHere is a label panel that shows the stop-loss number for Long or Short trades based on volatility using average true range and and a mult of that.

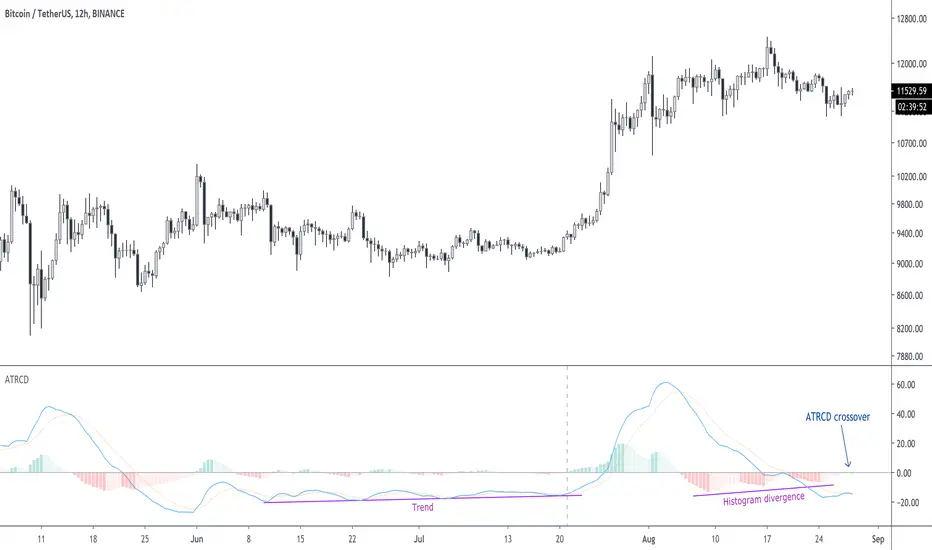
ATRCD, Average True Range Convergence DivergenceATRCD calculates a MACD over the Average True Range, therefore helping traders to spot momentum in volatility.
The Average True Range is a measurement of the average candle size over a period of time, i.e. when the candles are small, the ATR is low. ATR measures volatility .
The MACD is a momentum indicator. It measures market momentum based on the average closing prices over a period.
Therefore, using the MACD calculation over the ATR we get a measurement of momentum in volatility . The ATRCD is a concept at this point. I was curious to see whether such an indicator could provide any edge trading the markets. Because this is a MACD of the ATR the same concepts can be applied, e.g. spotting divergences, momentum trends, etc. Please be careful however, this indicator only looks like the MACD but it measures volatility and not price momentum . Maybe this can help traders confirm breakouts using price action?
Applying this indicator to the 12h of BTC/USDT we can see that we could be nearing a volatility expansion with a divergence on the histogram, and an ATRCD crossover.
BINANCE:BTCUSDT
AITI Investa: Trend FollowingScript ini dibuat untuk membantu strategi trend following harian pada saham-saham di IHSG.
Terdiri dari:
1. Petunjuk visual untuk area trend yang sebaiknya dihindari ( bearish trend ), berupa background berwarna merah. Dimana area bearish trend adalah ketika garis fast ema berada di bawah garis slow ema .
2. Batas stop loss / trailing stop, dengan acuan nilai ATR.
Script ini tidak memberikan sinyal buy. Silakan gunakan strategi buy on weakness/breakout sesuai analisa dan preferensi masing-masing. Untuk mencari entry trigger, penulis merekomendasikan untuk menarik garis support/resistance manual dan digabungkan dengan indikator MACD & CCI sebagai konfirmasi.
-AITI Investa

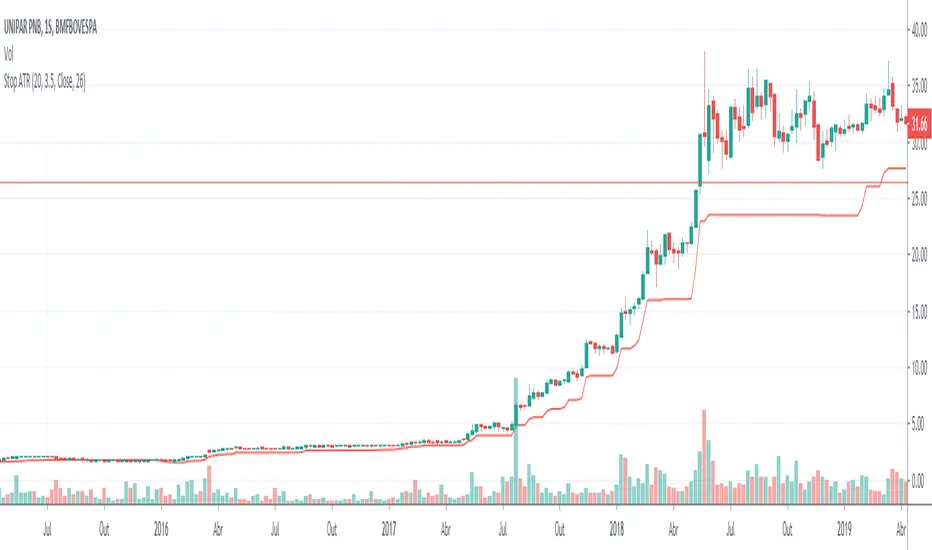
Stop ATR BuyStop ATR focused on Bull Trend Following, therefore it is plotted only as ATR subtracted from the prices. This indicator has the correct calculation of the ATR formula.
Up/Down Trend MarkerA simple indicator of trend by using 3 EMAs of multiplies of 2, 5 and 10, filtered by standard positive/negative directional movements (DM) which are the base of Average Directional Index (ADX).
The "Trend Strength" option is included to set the EMA multipliers and also the variation between DM+ and DM- which interpret the trend as a weak or a strong one.
Note that the markers only point to almost the beginning of the trends and just change the direction when the opposite trend is detected.
Feel free to send me your opinions.

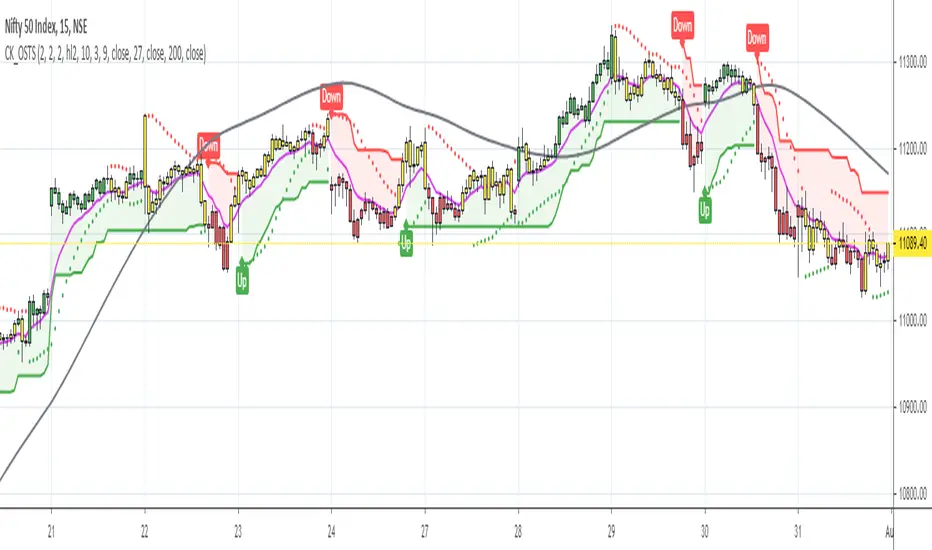
One-Stop Trading SetupOne-Stop Trading Setup:
This script designed to identify up, down, and sideways trends. 200 HMA, 9 EMA, PSAR, and ATR are used to identify the strength of any instrument.
Candle Colors - Simpler approach to follow:
Green color indicates for up side trade signals
Red color indicates for down side trade signals
Yellow color can be interpreted for stop, sideways, and counter trade trade signals
Multiple Trade Setups:
Green Zone - Trading green candles within green zone has better odds of long trades
Red Zone - Trading red candles within red zone has better odds of short trades
200 HMA - Candles above 200 HMA mostly for long trades. Candles below 200 HMA usually for short trades. But the zone also very important to consider
9 EMA - Cross over above 200 HMA in Green zone, look for long trades. Cross over below 200 HMA in red zone, look for short trades
PSAR - This can be used as potential initial warning sign. Also can be used to exit partial or wait for it goes to opposite side for taking trade decisions
Candle Above all - If Green candle and above all the indicators, then very good sign of long side. If red candle and below all indicators, then very good sign of short side.
Multiple Time Frame:
This works very well with any instrument and on any time frame. Always its better to do analysis on multi time frame before entry, exit, and trade execution. Back test it with this setup and also observe it on live market. That will give edge in taking trade decisions. All the best and happy trading.
Disclaimer:
This script and setup is written with the sole purpose of identifying the strength of any instrument. Interpretation, trade decisions, and changing inputs are up to each individual users/trades.
ATR Vol Proxy CrossThis script is a simple ATR cross, where the short-term ATR helps quickly and easily determine whether volatility is "high" or "low" compared to the long-term ATR value. Both values are adjustable, but initially calibrated for the daily chart.

ATR with Take and StopThis simple indicator will plot the take profit and stop loss values based on the ATR indicator.
It's possible to set how many times the ATR value will be applied to the closing price and
what trade type is used, Long or Short.

[CP]ATR Triple Stop Loss LevelsATR based Triple Stop Loss levels that are plotted on the chart (like moving averages!).
With ATR Levels plotted on the price chart itself, you can better set your volatility based trailing Stop Loss.
Also helps to define the SL when making an entry into a stock.
Note:
This indicator is supposed to be used on Daily and Weekly Charts.
For other timeframes you would need to tweek the default parameters.
