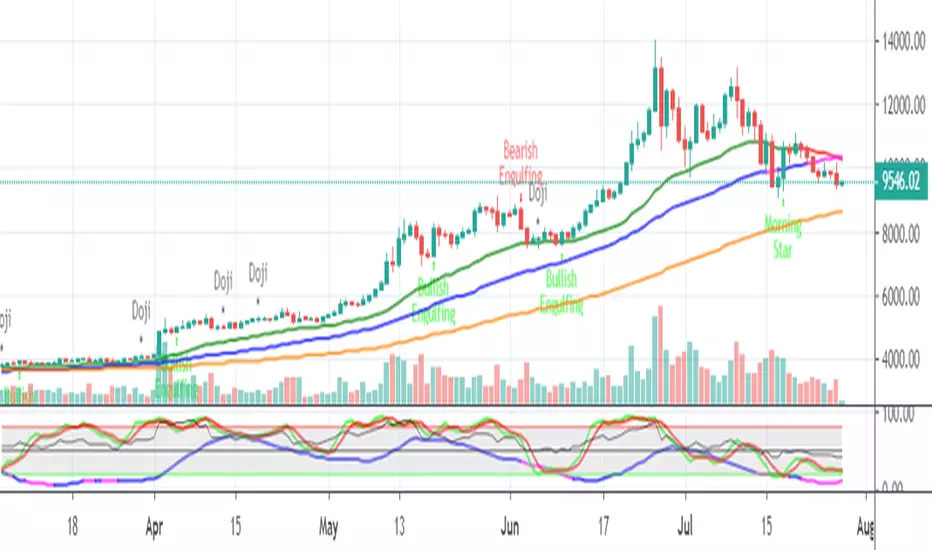
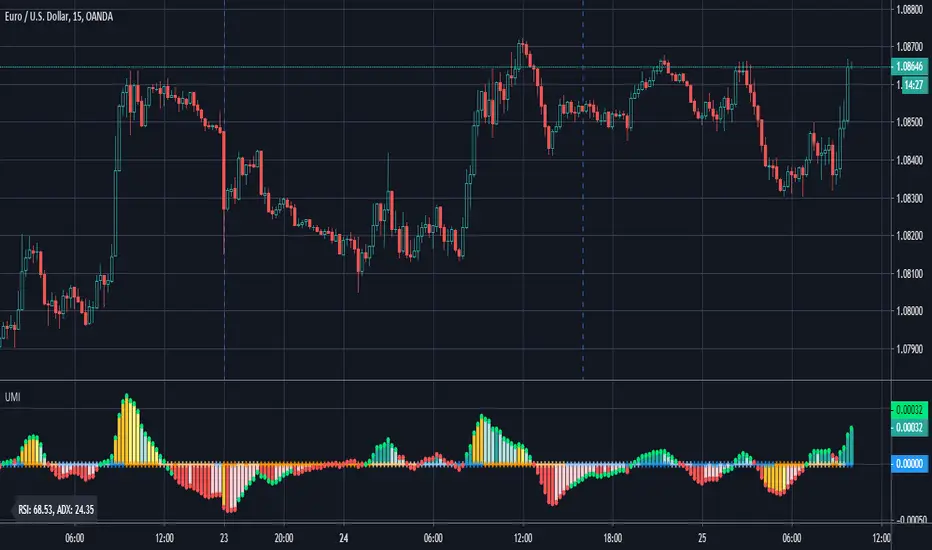
Ultimate Momentum IndicatorThis is an indicator I've been playing with for a while, based on my previous MACD w/ RSI Warning indicator. This one takes it a step further, including information from MACD, RSI, ADX, and Parabolic SAR. These four indicators are represented in this indicator as follows:
MACD: The histogram itself is a normal MACD histogram. Nothing strange about it, and you can adjust the settings for it just as you would a normal MACD.
RSI: Any time the RSI is outside of normal ranges (which can be adjusted in the settings), the bar on the histogram will turn amber to warn you. The actual RSI value is also shown in a label to the left side of the indicator.
ADX: Crosses are drawn along the 0 line to indicate ADX. Blue means the ADX is below the trending level (adjustable in the settings), and orange means it is above that level. Darker colors indicate the ADX has gone up since the previous bar, while lighter colors indicate it has gone down. The actual ADX value is also shown in the label to the left side of the indicator.
Parabolic SAR: At the outside point of each bar in the histogram, a colored dot is drawn. If the dot is green, the Parabolic SAR (settings adjustable) is currently below the closing price. If the dot is red, the SAR is above the closing price.
I must stress that this indicator is not a replacement for any one of the indicators it includes, as it's really only pulling small bits of information from each. The point of this indicator is to give a cohesive picture of momentum at a quick glance. I encourage you to continue to use the normal versions of whichever of the basic indicators you already use, especially if those indicators are a key part of your strategy. This indicator is designed purely as a way to get a bird's eye view of the momentum.
Pretty much every normally adjustable value can be adjusted in the settings for each of the base indicators. You can also set:
The RSI warning levels (30 and 70 by default)
The ADX Crossover, i.e. the point at which you consider the ADX value to indicate a strong trend (25 by default)
The offset for the label which shows the actual RSI & ADX values (109 by default, which happens to line up with my chart layout--yours will almost certainly need to be different to look clean)
All of the colors, naturally
As always, I am open to suggestions on how I might make the indicator look cleaner, or even other indicators I might try to include in the data this indicator produces. My choice of indicators to base this one from is entirely based on the ones I use and know, but I'm sure there are other great indicators that may improve this combination indicator even more!
Indeks Arah Rata-Rata / Average Directional Index (ADX)
unRekt - Dogs of WarThis indicator includes StochRSI, RSI and a double RSI-EMA. By combining StochRSI with the RSI , it becomes very powerful for directional moves. The double EMA-RSI powerful in itself, helps filter out typical noise by showing trend strength allowing for greater profits by holding the trade longer.

Stochastic Pop and Drop by Jake Bernstein v1 [Bitduke]I found a simple strategy by Jake Bernstein, modified it a little and created a strategy with Risk Management System (SL+TP); After that I test it on the different cryptocurrency pairs.
About the Indicator
Basically it's the strategy of 2 indicators: Stochastic Oscillator to define the bias and Average Directional Index to confirm it.
One again, It uses Stochastic Oscillator to define the trading bias. In particular, the trading bias was deemed bullish when the weekly 14-period Stochastic Oscillator was above some default value (in him paper - 50) and rising and vice versa.
Once the trading bias is established, Steckler used the Average Directional Index (ADX) to define a slowdown in the trend. ADX measures the strength of the trend and a move below 20 signals a weak trend.
Modifications
I didn't implement Average Directional Index (ADX) and test just different sources for data, oscillator periods and different levels in relation to the crypto market.
So, it shows good results with two tight thresholds at 55 and 45 level.
The bar chart below the defining the bullish and bearish periods (green and red) and gives a signal to enter the trade (purple bars).
Backtesting
Backtested on XBTUSD , BTCPERP (FTX) pairs. You may notice it shows good results on 3h timeframe.
Relatively low drawdown
~ 10% (from 2019 to date) FTX
~ 22% (4 years from 2016) Bitmex
I backtested on the different altcoin pairs as well, but the results were just not good.
Relatively good results were shown by some index pairs from the FTX exchange ( FTX:SHITPERP ), but I think there is a few data for backtesting to be asure in them.
Bitmex 3h (2017 - 2020) :
i.imgur.com
FTX 3h (2019 - 2020):
i.imgur.com
Possible Improvements
- Regarding trading algorithm it would be good to check with strategy with ADX somehow. Maybe for the better entries
- As for Risk Management system, it can be improved by adding trailing stop to the strategy.
Link: school.stockcharts.com

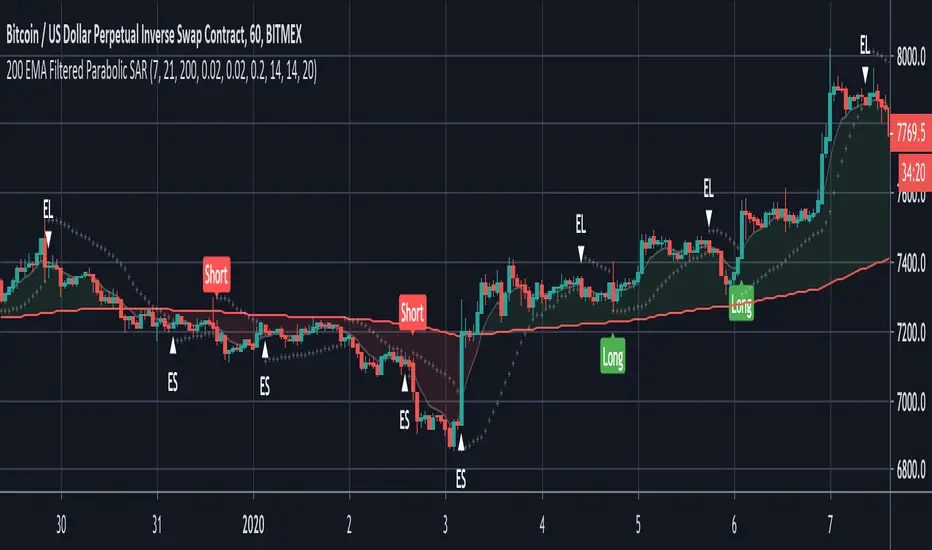
200 EMA Filtered Parabolic SARThis script uses Parabolic SAR with the 200 EMA to determine long and short trends. Only long signals are given when the price is above the 200MA and shorts when it is below. Signals are further filtered using ADX to reduce noise.
Suitable for trading bots where open positions in the same type are set to be ignored.
Alerts are built in.
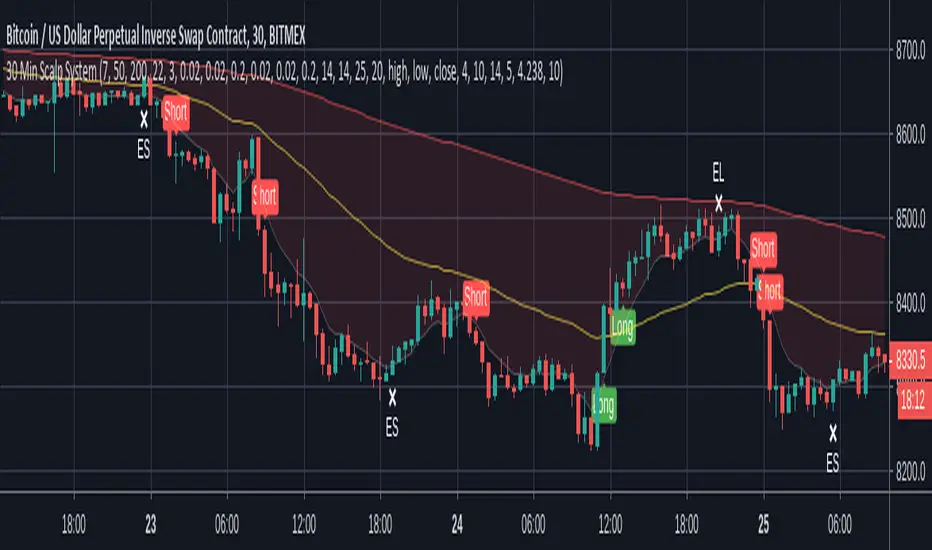
30 Min Scalp SystemA scalping script for the 30 min chart that is designed and tuned to be used with trading bots such as ProfitView or Autoview. I personally trade with this on Bitmex.
This trading system is built upon 4 established trading indicators that compliment each other. All signals are filtered in a number of ways to avoid chop and only trigger when a strong trend or crossover is identified.
Alerts are included for longs, shorts and exits in both directions.
Recommended setup:
- Trade with leverage and take 75%-80% out at 0.5% profit, leaving the rest to run
- Initial stop-loss of 1%, initiating a trailing stop of 0.75% when TP is hit
- Ensure bots are set to ignore open orders in the same direction
I use this in conjunction with ProfitView where I run three custom scripts to manage my position entries, monitor profit levels, dynamically move my stop and then exit positions where appropriate.
Note: Exit signals are show here even when trades aren't open because it's only possible to hide these when using a strategy script. This is coded as an indicator so that alerts can be sent to your chosen bot.
Disclaimer: The signals aren't perfect but no script is. The above cannot be considered financial advice and I take no responsibility from any losses incurred. A test account is recommended to verify the win rate before trading on a live platform.
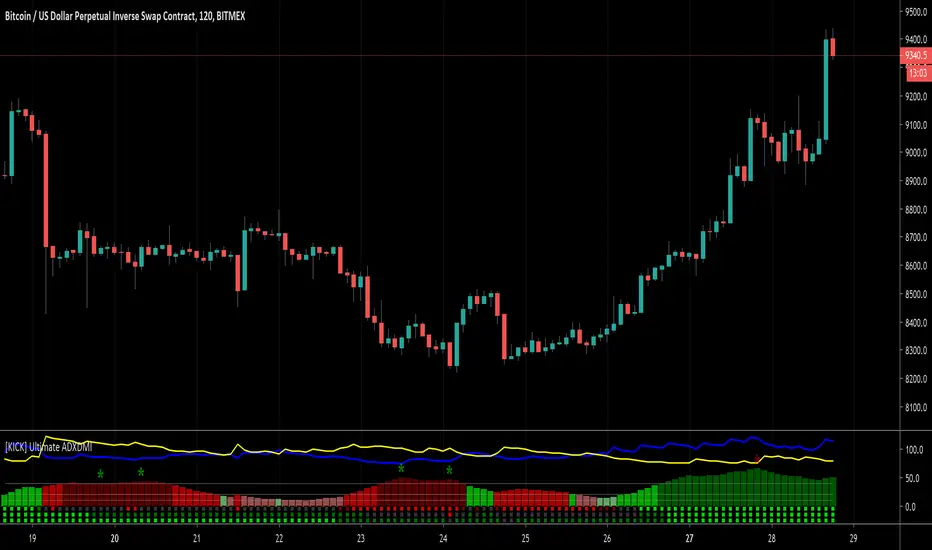
[KICK] Ultimate ADXDMIThis indicator is a version of the ADX and DMI indicators optimized for maximum information conveyance related to trending price action in a compact space.
Use the ADX barchart to determine strength of trend. There are various configurable thresholds for this measurement as well as peak marking within the exhaustion zone. The higher the values in the bar chart, the stronger the trend. Low values indicate non-trending or choppy price action.
Use the DMI line graphs (as well as the color codes on the ADX barchart) to determine trending direction. You can offset the DI+ and DI- lines so that they are not directly on top of the ADX chart. When the DI+ is on top (blue line by default) the trend is up and when the DI- line (yellow by default) is on top the trend is down. The colors of the ADX chart also indicate direction with red indicating down and green indicating up. The "pale" shades indicate a nacent/immature trend, "bright" shades indicate a solid trend, and the "darker" shades indicate a strong trend that is mature. Look for these mature trends to "top out" and have their peaks marked when the trend has exhausted itself (note that the peak indicators will repaint 1-2 candles in the past after the "high" is confirmed).
You can specify up to 3 additional timeframes to monitor in the dot map below the ADX chart that will give you a generalized idea of the trend on those larger timeframes. In these heat maps, the color red indicates a down trend and green an up trend. The brighter colors denote strong trends while the darker colors are weaker. Grey dots in the heat map indicate no strong trend present. Some users actually prefer to turn off the main ADX and DMI visualizations and only display the multi-timeframe heatmap as a way of checking higher timeframe trends before entering their trades.
Use the link below to watch a tutorial video, request a trial, or purchase for access.
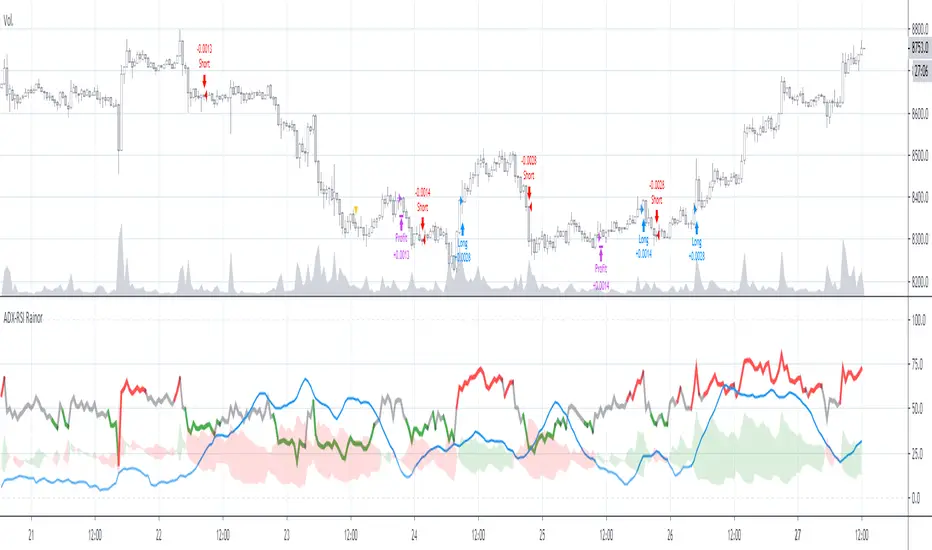
ADX-RSI RainorThis is a strategy based on the RSI and ADX indicators, used together to output an input and output signal from the trade.
Within the parameters we can identify the length and tolerance of each indicator separately, the length is due to the basic parameter in each of the indicators, on the other hand the tolerance is a threshold where it is determined when it is overbought / oversold in RSI and in ADX is the minimum value for the strategy to consider strength in the trend
the entry strategy is when it is above the thresholds in the 2 indicators and the exit with profit is when the force is less than the ADX threshold
As a note on the RSI threshold, it is considered as follows: oversold is from 0 to the threshold and overbought is from 100 to 100-threshold. Therefore if we take the default value (42) the neutral zone is from 42 to 58
I hope you liked it, if so you can support me with some observation or a like
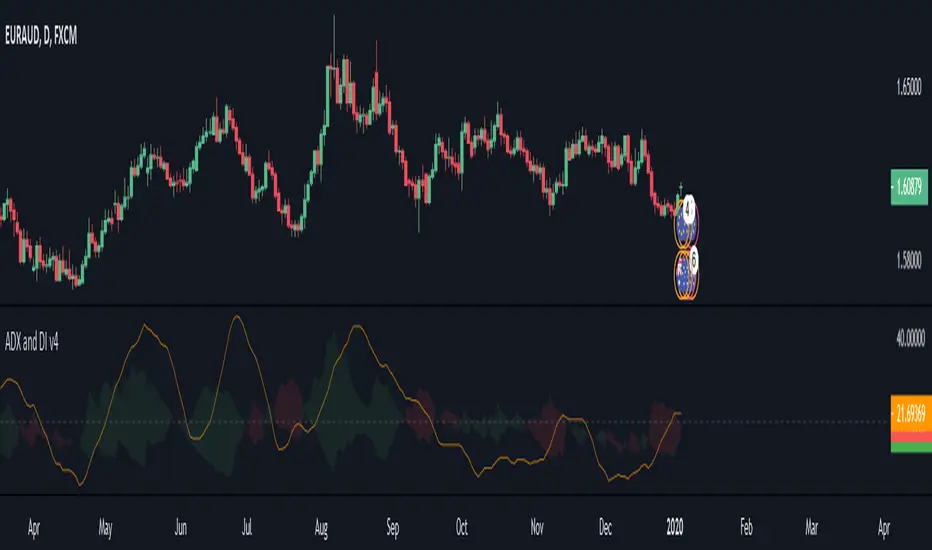
[PX] ADX and DI v4Hey guys,
I recently used the "ADX and DI" indicator in a variety of my own scripts. Because I keep on developing version 4 scripts and the "ADX and DI" indicator is developed in one of the previous PineScript versions, I had to update the old script every time I wanted to use it. I decided to publish the updated version and also changed a few things:
- ADX color is now orange
- Instead of plotting the DI+ and DI- lines, it's filling the space between the two (can be changed in the "style"-section)
Maybe some of you find it useful. If so, leave a like or follow :)
Happy trading,
paaax
P.S: The original indicator was developed by the user @MasaNakamura. Thanks for your great work!
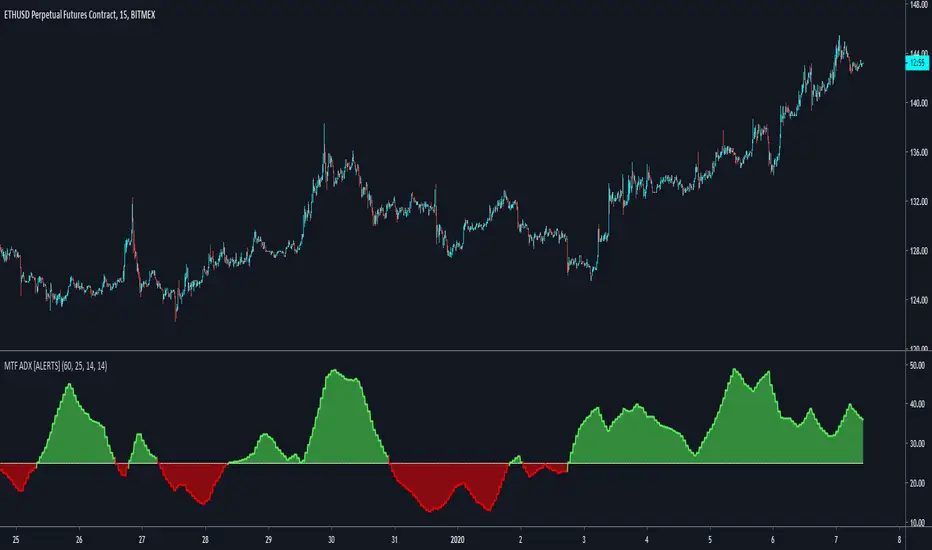
MTF Average Directional Index Range DetectorHigher Timeframe ADX to detect range/trending market while trading lower time frames.
Change the resolution in the parameters. You must use a time frame equal or higher to the current time frame.
Red = Range
Green = Trending
Use the alerts to get notified when the color changes.
Adjust the Threshold parameter to change the value from which the color changes.
Click Add to favorites to get the indicator on your chart (it will appear in the Indicators->Favorites tab).
Leave a like if you find it useful!

Directional Movement Index + Average Directional IndexPersonal DMI and ADX script
ADX color change from positive vs negative momentum
DMI Color fill based on DMI+/- positive momentum
No fill color during lack of momentum

(JS)DMI BarsAlright - so this is my own version of John Carter's "10x Bars"... I have done multiple things that are different from his version so they are slightly different..
So first of all the main indicator is based off of the ADX and the DMI;
For those who aren't familiar with it, Directional Movement is what you'd pull up under "built-in's" from the indicators tab (if you want to check it out).
The standard interpretation of this however, is when the ADX is above 20 that suggests the trend is strong, whereas under 20 suggests it is weak.
Also, when the D+ is above the D- that suggests a bullish trend, and D- above D+ suggests a bearish trend.
These bars take away the need to have it at the bottom of your screen, and places the data on the bars on your chart instead.
=========================================================================================================================================
So here's what the colors stand for -
Yellow - The ADX is under 20, no strength in trend
Shades of green occur when the ADX is above 20 and there's a bullish trend (D+ higher than D-)
Bright Green (Lime) - Bullish trend, D+ above 30
Green - Bullish Trend
Yellow Green - Bullish trend, D+ below 15
Shades of red occur when the ADX is above 20 and there's a bearish trend (D- higher than D+)
Bright Red - Bearish trend, D- above 30
Red - Bearish Trend
Orange - Bearish trend, D- below 15
=========================================================================================================================================
I have also added multiple time frame labels (label script used is the one created by Ricardo Santos)
These labels are color coded the same as the bars/candles, and they appear off to the right of your screen using every built in time increment from TradingView.
The purpose is to show you in real time, and on any chart resolution, what the current trend is on every individual time frame.
So using just one single chart you'll see your current resolutions candles, but also on the labels you'll see:
1 Minute
3 Minute
5 Minute
15 Minute
30 Minute
45 Minute
1 Hour
2 Hour
3 Hour
4 Hour
Daily
Weekly
Monthly
There is an input I added that allows you to adjust where your labels appear on the side of your screen as well!
=========================================================================================================================================
Now onto the volume spike portion of the indicator. This will plot a blue dot under each bar that has a spike in volume which meets your specified criteria.
I have 500% as the default setting.
What that means is that this indicator looks back and gets the 50 bar volume average and then applies dots where volume is 500% above average.
=========================================================================================================================================
Now finally, the reversal arrows. This is another simple to understand concept that I first read in John Carter's book "Mastering the Trade" that he calls "HOLP/LOHP".
I have added the ability to change the look back period you'd like the indicator to watch for highs and lows on.
What that stands for is 'High of Low Period' and 'Low of High Period', and it is used like this-
Whenever a bar makes a new high the indicator watches the low on that highest bar. Then when a bar afterwards makes a lower low then the one on the high bar,
a reversal arrow is given. Apply this same concept in the other direction in for the highs on the lowest bars.
=========================================================================================================================================
Now, I didn't want to make a "set" or have a bunch of different indicators out there that are all intended for the same package, so I took the time to put them together,
and if there's a part of it you don't care for they can easily be turned off in the settings.
Enjoy!

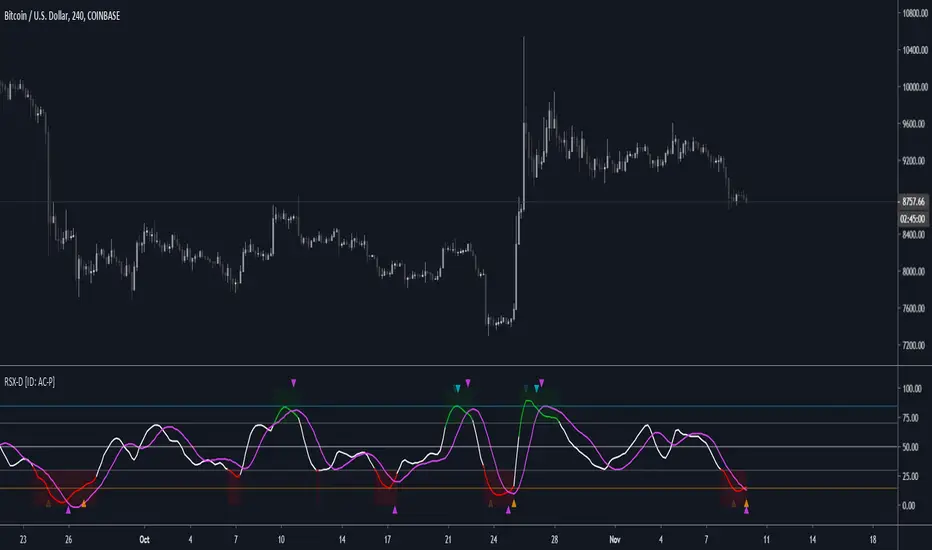
RSX-D [ID: AC-P]The "AC-P" version of Jaggedsoft's RSX Divergence and Everget's RSX script is my personal customized version of RSX with the following additions and modifications:
LSMA-D line that averages in three LSMA components to form a composite, the LSMA-D line. Offset for the LSMA-D line is set to -2 to offset latency from averaging togther the LSMA components to form a composite - recommended to adjust to your timeframe and asset/pair accordingly.
Divergence component from JustUncle, RicardoSantos, and Neobutane divergence scripts
Crossover indication and alerts for Midline, and custom M1 and M2 levels for both RSX and the LSMA-D line from Daveatt's CCI Stochastic Script
EMA21/55 zone cross highlighting option
SMA9/EMA45 MA option from my RSI sma/ema Cu script
Libertus Divergences and Pivot labels from Jaggedsoft's RSX Divergence script are hidden/off by default
Designed for darkmode by default. Minor visual changes from Jaggedsoft's and Everget's script(s) for darkmode and visual aesthetic.
Please Note:
Divergences that use fractal-based detection logic, offset, or a combination of both generally have a 1-2 bar/candle lag. This is an INHERENT limitation of divergence detection with fractals and offsets. Divergences generally will have a higher strikerate on HTF than LTF due to the 1-2 bar lag. While I'm not going to rule out a programming solution or math construct/formula that attempts to alleivates the 1-2 bar lag for divergences, this script is not it - please keep that in mind when using divergence components with a fractal base and offset.
LSMA-D is a composite of three LSMA lines, all with offset options. Different lengths and Offset values can compensate/adjust for the smoothing/latency from RSX, but only up to a certain point. For each LSMA, the least square regression line is calculated for the previous time periods, so the idea is that with finely tuned adjustments, you can get crossover/crossunder signals from the RSX with the LSMA-D line that you simply can't get with the SMA9/EMA45 due to the already smoothed RSX.
The defaults for the RSX and various components for the LSMA-D here will MOSTLY LIKELY NOT WORK OR BE APPLICABLE to every timeframe and asset that you trade - adjust, backtest, and test accordingly. The defaults are here are MEANT to be adjusted to the asset class and timeframe that you are trading.
If you're not familiar with the LSMA, tradingview author Alexgrover has a few great scripts that go into detail how the LSMA works, in addition to different interpretations and implementations of the LSMA.
References/Acknowledgements:
//@version=4
// Copyright (c) 2019-present, Alex Orekhov (everget)
// Jurik RSX script may be freely distributed under the MIT license.
//
//-------------------------------------------------------------------
// Acknowledgements:
//---- Base script:
// RSX Divergence — SharkCIA by Jaggedsoft
//
// Jurik Moving Average by Everget
//
//---- Divergences/Signals:
// Libertus RSI Divergences
//
// Price Divergence Dectector V3 by JustUncle
//
// Price Divergence Detector V2 by RicardoSantos
//
// Stochastic RSI with Divergences by Neobutane
//
// CCI Stochastic by Daveatt
//
//---- Misc. Reference:
// RSI SMA/EMA Cu by Auroagwei
//
// CBCI Cu by Auroagwei
//
// Chop and explode by fhenry0331
//
// T-Step LSMA by RafaelZioni
//
// Scripts by Jaggedsoft for structure and formatting
// Scripts by Everget for structure and formatting
//-------------------------------------------------------------------
// RSX-D v08
// Author: Auroagwei
// www.tradingview.com
//-------------------------------------------------------------------
Hashem DMI/ADXThis indicator will time Breakouts.
DMI+ (DMI Plus) = Blue = Buying Pressure.
DMI- (DMI Minus) = Pink = Selling Pressure.
ADX = Overall strength of a Trend. White = Trend is strong and gaining momentum, Gray = Trend is Weakening.
Can apply same logic for Divergences on DMI+ and DMI- lines.

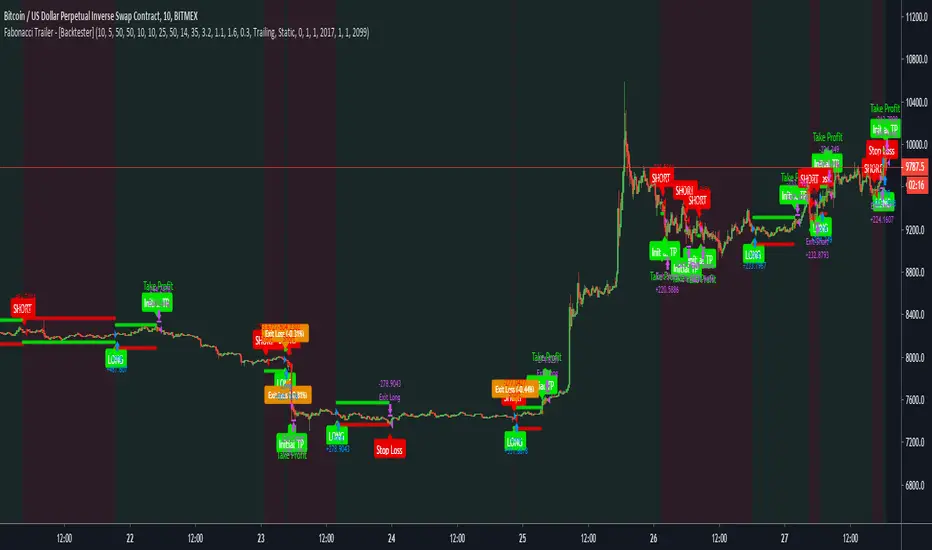
Fabonacci Trailer - [Backtester]This study comes with the following indicators and features:
ADX indicator
Chop indicator
Super Trend indicator
Trailing Take Profit and Stop Loss
Entry, Take Profit, and Stop Loss Alerts
Renko chart support
And a few more indicators in the back-end to increase accuracy and optimize entries
The study version with all alerts can be found in my profile. It is not repainting and we advise to use alerts on “Once Per Bar Close”.
Please note that this script is based on invite only.
Fabonacci Trailer - [Alerts]This script comes with the following indicators and features:
ADX indicator
Chop indicator
Super Trend indicator
Trailing Take Profit and Stop Loss
Entry, Take Profit, and Stop Loss Alerts
Renko chart support
And a few more indicators in the back-end to increase accuracy and optimize entries
This script works really well as a scalper on lower Time Frames as well as on higher Time Frames. Besides that you can also use it on pretty much any coin or asset.
This script is not repainting. We advise to use alerts on “Once Per Bar Close”.
If you’d like to automate this script you can do that by using AutoView, ProfitView, ProfitTrailer, CryptoHopper etc.
Please note that this script is based on invite only.

That One Indicator (Free) - [Backtester]This Backtester comes with the following indicators:
Bollinger Bands
ADX
Moving Average Trend Confirmation Filter ( EMA , SMA , DEMA , TEMA , WMA , VWMA , SMMA , HullMA, LSMA , ALMA , SSMA, TMA, ZLEMA )
And a few more indicators in the back-end to increase accuracy
This strategy works really well as a scalper on lower Time Frames as well as on higher Time Frames. Besides that you can also trade it on pretty much any coin or asset.
The alerts script is not repainting. We advise to use alerts on “Once Per Bar Close”.
If you’d like to automate this strategy you can do that by using our alerts script with AutoView, ProfitView, ProfitTrailer, CryptoHopper etc.
Alerts are set very clearly as Long and Short to avoid confusion.
Feel free to leave a comment and share it with your friends.

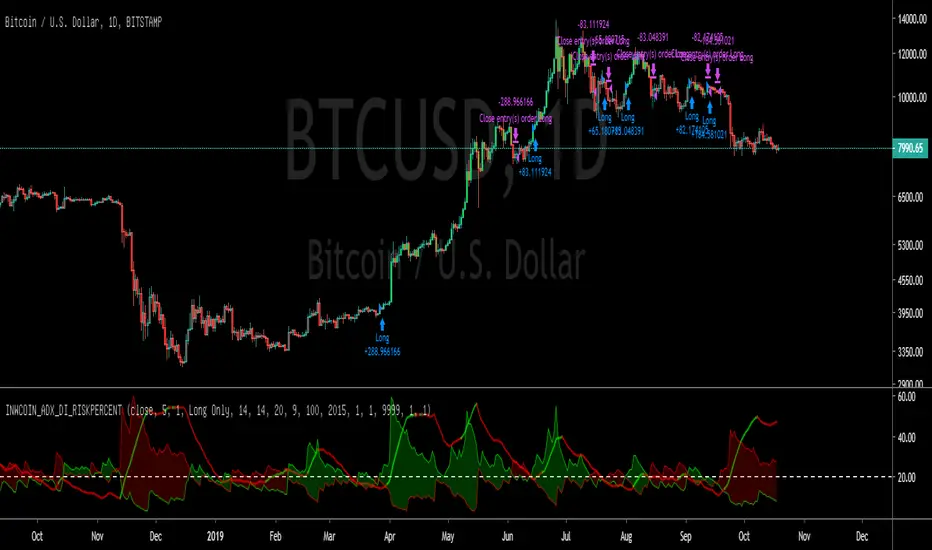
inwCoin ADX DI+- Risk% Strategy.=========================
English
=========================
Using simple ADX DI+- cross over to determine entry/exit
Buy = Green cross Red down
Sell = Red cross Green up
==========================
Thai
==========================
ลองเอา ADX DI+- มาใส่ strategy คุม Risk% ดู
ก็พบว่า ให้ผลค่อนข้าง ขี้โม้พอสมควร 55
แต่อย่างน้อยมันก็บอกจุดเข้าให้เราได้ อย่างถ้าดูตอนปีนี้ ใน TF Week จะเห็นเลยว่า มันบอกให้เข้า นานแล้ว แต่ยังไม่บอกให้ออกเลย
ตัวนี้ผมแนะนำให้ใช้แบบ TF Week ขึ้นไป สำหรับการรันเทรน เพราะไม่งั้นมันเข้าถี่เกิน ผลอาจจะมั่วซั่วได้

DAX Shooter 5M StrategyThis is a simple strategy that applies very well for scaling indices to 5 minutes especially for the DAX. The algorithm provides for buying or selling when the market is very "pulled". The rules are as follows:
you buy when:
1- The ADX indicator with the standard settings is greater than 32.
2- the RSI indicator set to 7 periods is crossing upwards the oversold line at 30
3- the candle minimum is lower than the lower band of bollinger bands set to 50 periods.
is sold when:
1- ADX indicator with standard settings is greater than 32.
2 - the RSI indicator set to 7 periods is crossing downwards the overbought line at 70
3- the maximum of the candle is higher than the upper band of the bollinger bands set to 50 periods.
Money management is at the discretion of the trader but usually it is better to set a fixed stop loss and a take profit on reaching the opposite bollinger band.
Enjoy trading at all!

ADX Di+ Di- [Gu5]Fill indicates Strong Trend
Cross indicates End of Trend
--
El relleno indica una fuerte tendencia cuando el Di supera "Level Trend"
El cruce de Di+ con Di- indica el fin de la tendencia
Cuando el valor del ADX es menor a "Level Range", estamos en Rango